

Key Insights
The Europe Power to Gas Market is poised for substantial expansion, with a projected market size of $46.76 billion in 2025. This growth is driven by a compelling compound annual growth rate (CAGR) of 11.35% throughout the forecast period of 2025-2033. The escalating demand for renewable energy integration, coupled with stringent government regulations aimed at reducing carbon emissions, are primary catalysts for this market's ascent. Power-to-gas technologies offer a crucial solution for storing surplus renewable electricity, particularly from intermittent sources like solar and wind, thereby enhancing grid stability and enabling a smoother transition to a low-carbon economy. The increasing adoption of hydrogen and synthetic methane as clean fuels in transportation, industrial processes, and heating applications further fuels this positive trajectory. Key technological advancements in electrolyzer efficiency and methanation processes are also contributing to cost reductions and improved performance, making power-to-gas more economically viable.
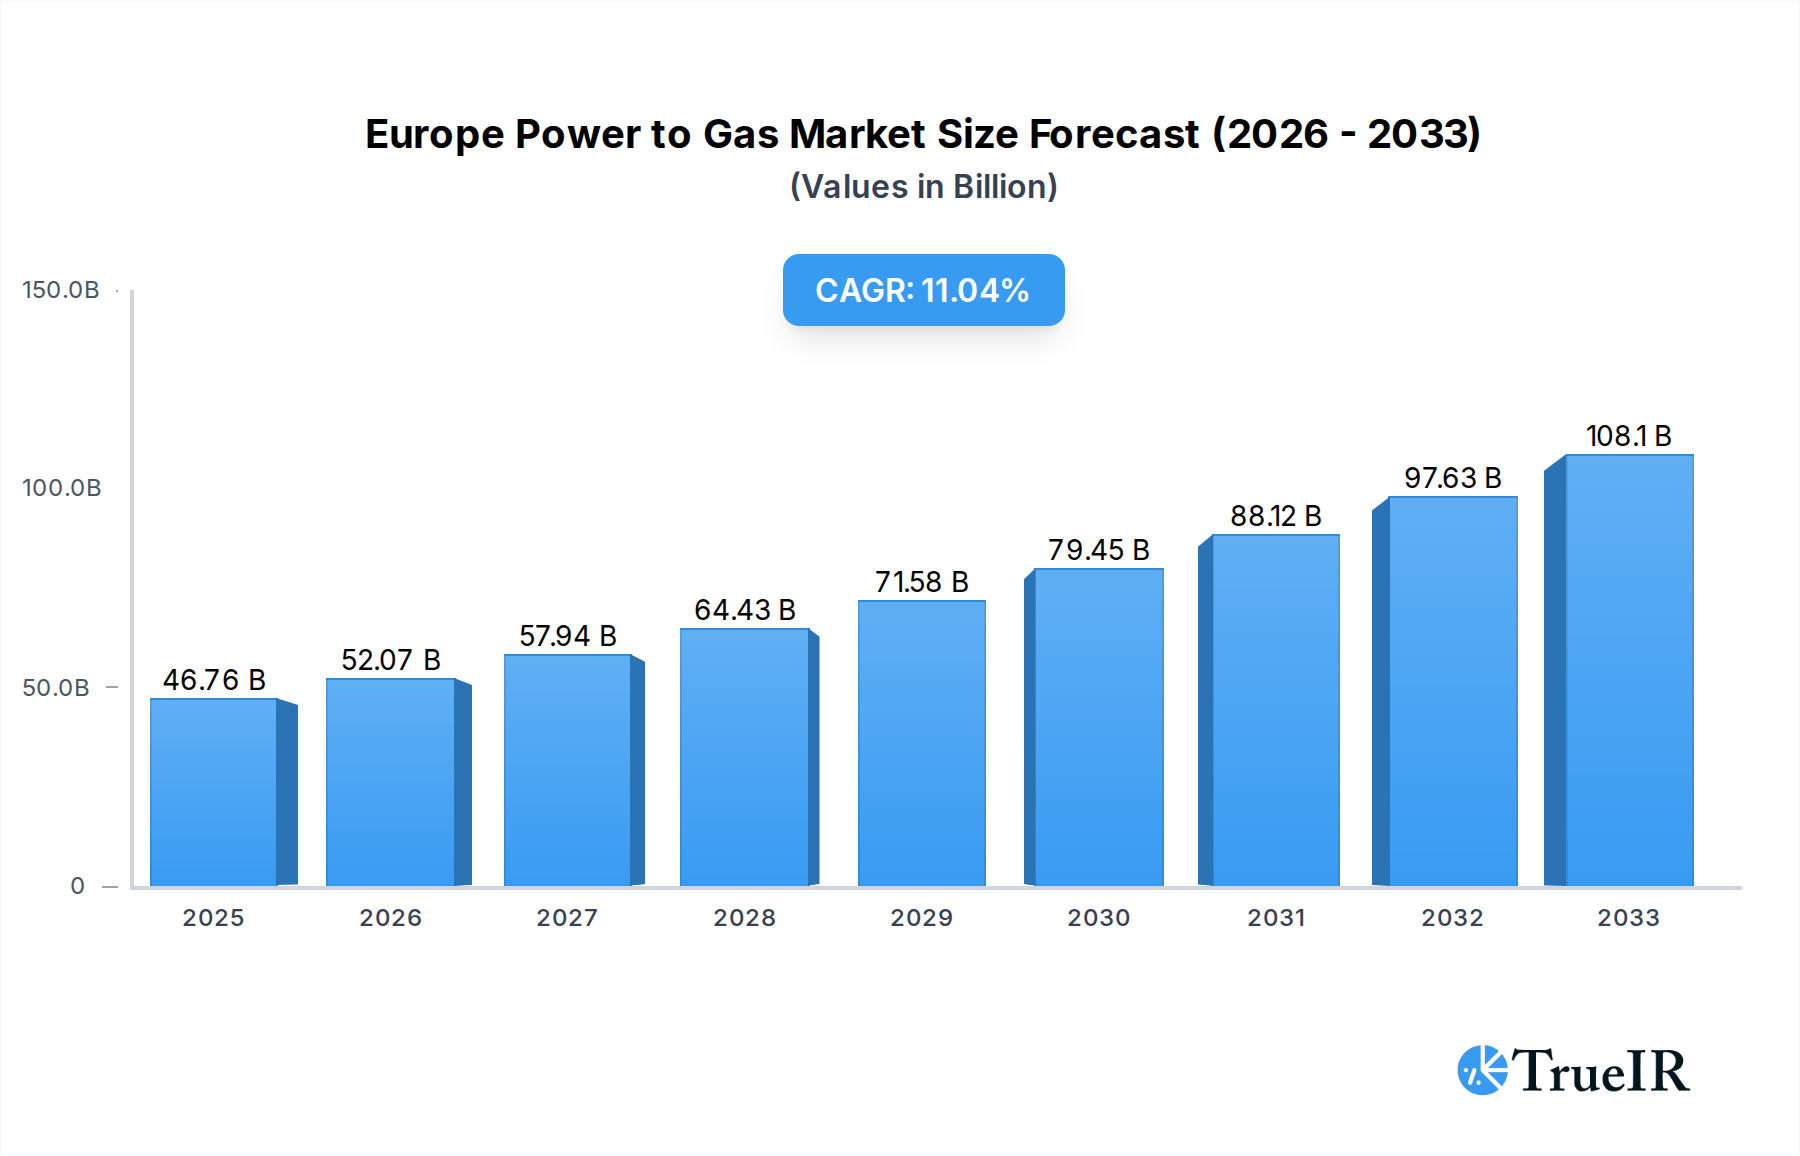
Europe Power to Gas Market Market Size (In Billion)
The market is segmented across various technology types, including Power-to-Methane (encompassing both chemical and biological pathways), and capacities ranging from less than 100 KW to over 1000 KW. Utilities, industrial sectors, and commercial entities represent the key end-users actively investing in and deploying these solutions. Geographically, the United Kingdom, Germany, and France are leading the charge in the European market, with significant investments and policy support. However, other nations like Spain and across the broader European region are also showing increasing interest and development. While the market exhibits robust growth, potential restraints include the high upfront capital costs associated with infrastructure development and the need for supportive regulatory frameworks and market incentives to fully unlock its potential. Nevertheless, the overarching trend towards decarbonization and energy independence in Europe strongly favors the continued and accelerated growth of the power-to-gas sector.

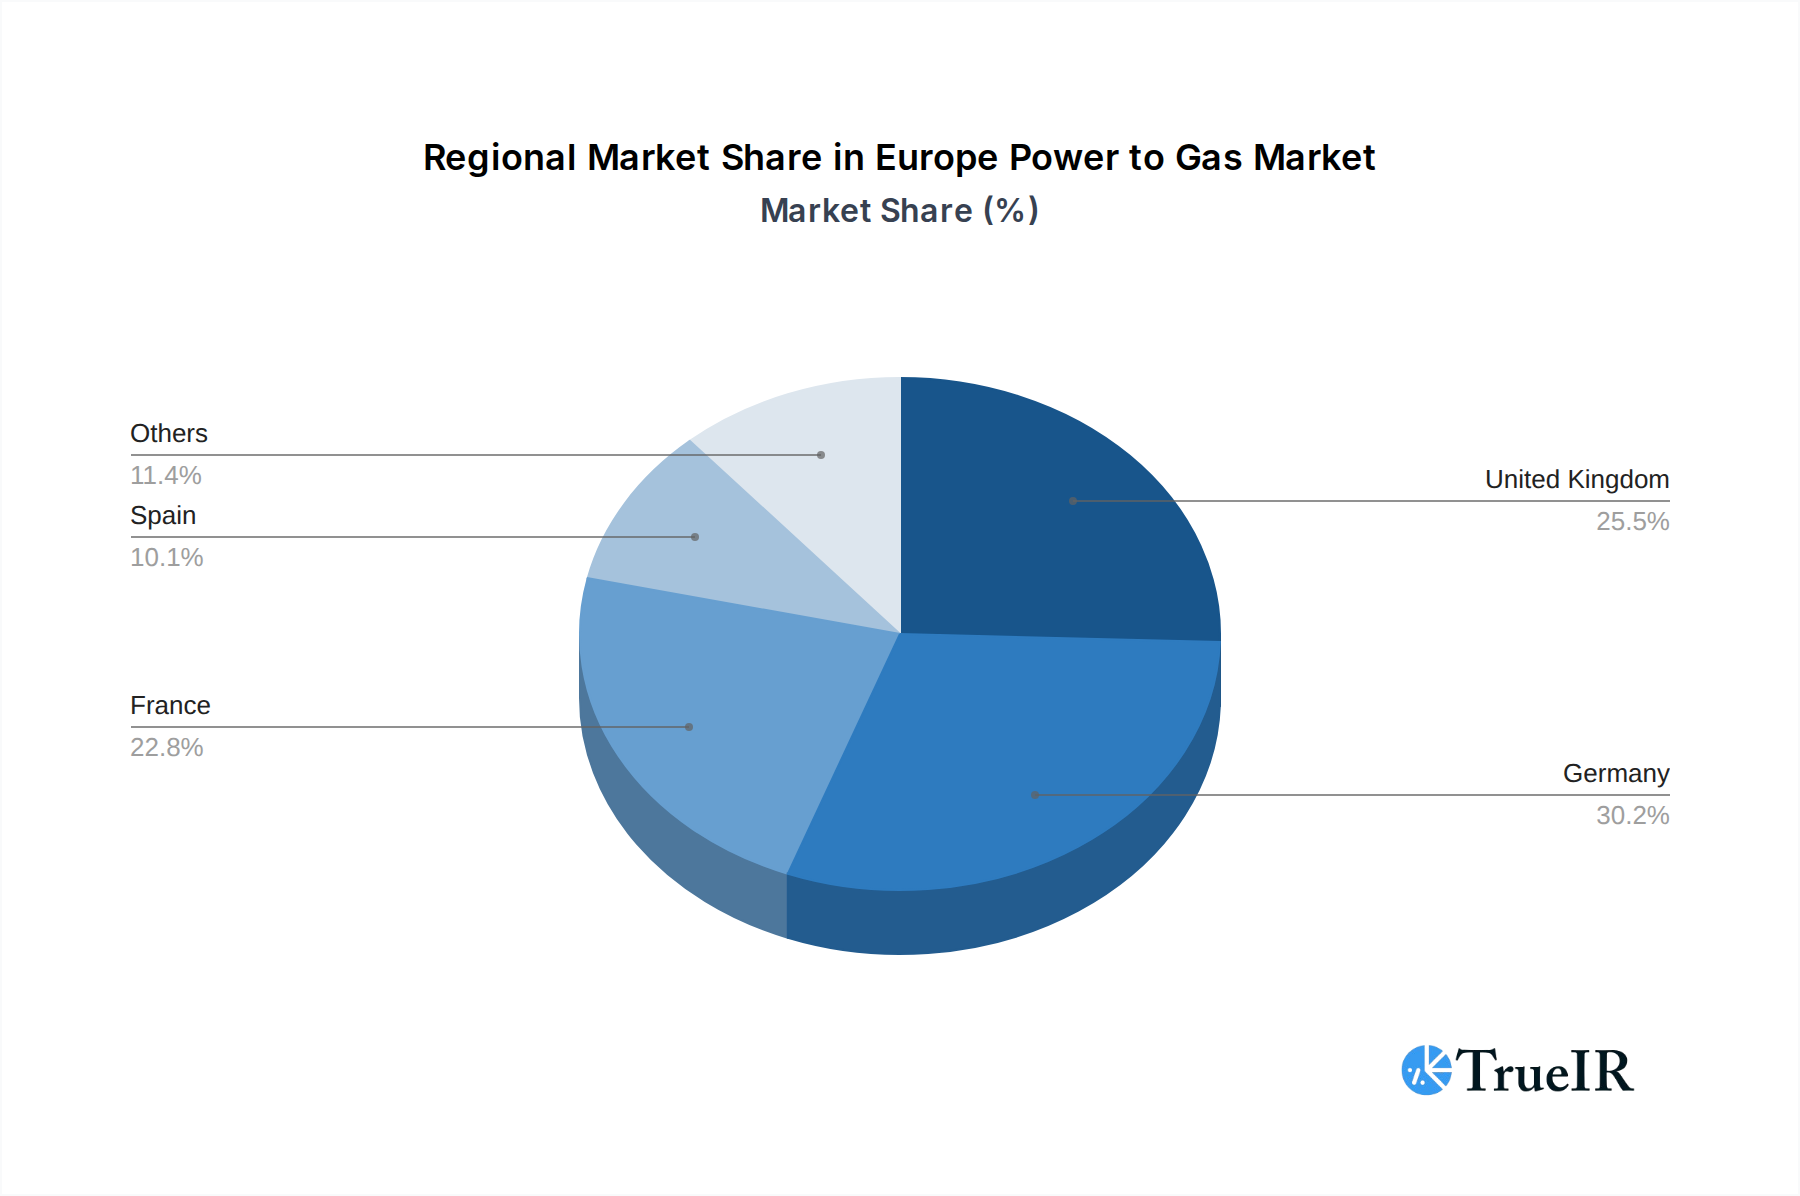
Europe Power to Gas Market Company Market Share
This comprehensive report delves into the dynamic Europe Power to Gas Market, a critical component of the continent's ambitious decarbonization strategies. Spanning from 2019 to 2033, with a base and estimated year of 2025 and a forecast period of 2025–2033, this analysis provides in-depth insights into market evolution, technological advancements, and future potential. The study meticulously examines the burgeoning Power-to-X (PtX) sector, focusing on Power-to-Hydrogen and Power-to-Methane (including both chemical and biological routes) technologies across various capacity ranges (Less than 100 KW, 100 to 1000 KW, More than 1000 KW) and end-user segments (Utilities, Industrial, Commercial). Key geographical markets like the United Kingdom, Germany, France, and Spain are dissected to reveal market dominance and growth drivers.
Europe Power to Gas Market Market Structure & Competitive Landscape
The Europe Power to Gas Market is characterized by a moderately concentrated structure, driven by significant capital investment requirements and the need for specialized technological expertise. Innovation is a key differentiator, with companies continuously investing in R&D to enhance electrolyzer efficiency, methanation catalysts, and integrated PtX system designs. Regulatory frameworks, particularly the EU's renewable energy directives and hydrogen strategies, play a pivotal role in shaping market dynamics by incentivizing green hydrogen production and the adoption of synthetic fuels. Product substitutes, while emerging, are primarily limited to direct renewable energy usage or traditional fossil fuels, underscoring the unique value proposition of Power-to-Gas. End-user segmentation highlights a growing demand from industrial sectors seeking to decarbonize hard-to-abate processes and utilities aiming to balance grid stability with renewable energy integration. Mergers and acquisitions (M&A) are becoming increasingly prevalent as larger energy players and technology providers consolidate their positions and expand their PtX portfolios. For instance, the historical period (2019-2024) has witnessed several strategic partnerships aimed at scaling up pilot projects and securing feedstock for future large-scale operations, indicating a trend towards consolidation and vertical integration within the Power-to-Gas value chain.
Europe Power to Gas Market Market Trends & Opportunities
The Europe Power to Gas Market is experiencing robust growth, projected to expand at a significant Compound Annual Growth Rate (CAGR) from 2025 to 2033. This expansion is propelled by a confluence of factors including the urgent need for energy security, the imperative to achieve net-zero emissions targets, and the burgeoning potential of green hydrogen and synthetic methane as critical components of a future sustainable energy system. Technological shifts are at the forefront, with continuous advancements in electrolyzer technologies, such as Proton Exchange Membrane (PEM) and Solid Oxide Electrolyzer Cells (SOEC), driving down production costs and improving efficiency. The increasing integration of intermittent renewable energy sources like solar and wind power necessitates advanced energy storage and conversion solutions, positioning Power-to-Gas as an indispensable technology for grid balancing and seasonal energy storage. Consumer preferences are evolving, with a growing demand for sustainable products and services, influencing industrial clients to seek low-carbon alternatives for their operations. This trend is particularly evident in sectors like heavy transport, chemicals, and metallurgy, where direct electrification is challenging.
The competitive landscape is intensifying, with established energy companies, technology providers, and innovative startups vying for market share. Strategic alliances and joint ventures are becoming common as companies seek to leverage complementary expertise and share the risks associated with large-scale PtX project development. The market penetration rate of Power-to-Gas solutions is steadily increasing, driven by supportive government policies, carbon pricing mechanisms, and the declining cost of renewable electricity. Opportunities abound for players who can offer integrated solutions, from renewable energy sourcing and electrolyzer manufacturing to synthetic gas production, transportation, and utilization. The development of robust hydrogen infrastructure, including pipelines and refueling stations, is a critical enabler for widespread adoption. Furthermore, the potential to produce e-fuels for aviation and shipping presents a significant long-term growth avenue. The market is poised for a transformative period, where Power-to-Gas will move from niche applications to becoming a mainstream energy carrier, contributing substantially to Europe's energy transition and economic competitiveness. The overall market size is estimated to reach trillions of Euros by 2033, reflecting its monumental growth trajectory and its pivotal role in the decarbonization of the European economy.
Dominant Markets & Segments in Europe Power to Gas Market
Germany stands out as a dominant market within the Europe Power to Gas landscape, largely due to its strong industrial base, proactive government support for hydrogen technologies, and significant investments in renewable energy infrastructure. The country's commitment to phasing out nuclear and coal power has created a clear demand for alternative energy sources and storage solutions. France is also a key player, with ambitious national hydrogen strategies and substantial investments in developing offshore wind power, which is crucial for green hydrogen production. The United Kingdom, despite its exit from the EU, is actively pursuing its hydrogen ambitions, particularly in offshore wind-to-hydrogen projects and industrial decarbonization. Spain, with its abundant solar resources, is emerging as a significant hub for green hydrogen production, attracting considerable investment in large-scale electrolysis facilities.
Key Growth Drivers:
- Infrastructure Development: The establishment of dedicated hydrogen pipelines, refueling stations, and storage facilities is a critical catalyst for market expansion, especially in industrial clusters and transportation hubs.
- Supportive Policies and Regulations: Government incentives, such as subsidies for green hydrogen production, tax breaks, and mandates for renewable gas injection into existing gas grids, are accelerating market adoption.
- Decarbonization Targets: Ambitious climate goals at both the national and EU levels are driving industries and utilities to seek low-carbon energy alternatives, with Power-to-Gas technologies offering a viable solution for hard-to-abate sectors.
- Technological Advancements: Continuous improvements in electrolyzer efficiency, durability, and cost-effectiveness are making Power-to-Gas solutions increasingly competitive.
Within the technology segment, Power-to-Hydrogen is currently experiencing the most rapid growth due to its direct application in various industrial processes and its role as a foundational element for synthetic fuels. However, Power-to-Methane, encompassing both chemical and biological methanation routes, is gaining significant traction as it allows for the direct injection of synthetic natural gas into existing gas networks, leveraging established infrastructure.
- Capacity: More than 1000 KW: This segment is projected to witness the highest growth, driven by the need for large-scale industrial applications, grid balancing, and the development of renewable energy hubs.
- Capacity: 100 to 1000 KW: This segment serves a crucial role in supporting medium-scale industrial applications and pilot projects for new technologies.
- Capacity: Less than 100 KW: This segment caters to smaller-scale commercial applications and localized energy generation needs.
The end-user segment of Utilities is a major driver, seeking Power-to-Gas for grid stabilization, energy storage, and the production of renewable hydrogen for various applications. The Industrial sector is a primary target, with a strong demand for decarbonizing processes in chemicals, steel, and manufacturing. The Commercial segment is also showing increasing interest, particularly in applications like hydrogen-powered heating and transport.
Europe Power to Gas Market Product Analysis
The Europe Power to Gas market is defined by innovative product offerings focused on efficient conversion of renewable electricity into storable and transportable energy carriers. Key product categories include advanced electrolyzers (PEM, alkaline, and SOEC), methanation reactors (catalytic and biological), and integrated Power-to-X systems that combine these components with renewable energy sources. These products are designed to produce green hydrogen for industrial feedstock, fuel cell applications, and blending into natural gas networks. Furthermore, Power-to-Methane solutions are producing synthetic natural gas (SNG) and e-fuels, offering direct drop-in replacements for fossil fuels in existing infrastructure. The competitive advantage lies in scalability, efficiency, cost-effectiveness, and the ability to integrate seamlessly with intermittent renewable power generation.
Key Drivers, Barriers & Challenges in Europe Power to Gas Market
Key Drivers:
- Climate Change Mitigation: The urgent global imperative to reduce greenhouse gas emissions is the primary driver, making Power-to-Gas a crucial technology for decarbonizing hard-to-abate sectors.
- Energy Security and Independence: Reducing reliance on imported fossil fuels and enhancing domestic energy production are key political and economic motivators for expanding the Power-to-Gas market.
- Technological Advancements and Cost Reductions: Continuous innovation in electrolyzer and methanation technologies is leading to improved efficiency and falling production costs, making Power-to-Gas more economically viable.
- Supportive Regulatory Frameworks: Government policies, subsidies, and mandates for renewable hydrogen and gases are providing significant impetus for market growth.
Barriers and Challenges:
- High Upfront Capital Costs: The initial investment required for Power-to-Gas infrastructure, including electrolyzers and supporting facilities, remains a significant barrier.
- Infrastructure Limitations: The availability of adequate hydrogen transport and distribution infrastructure, as well as suitable storage solutions, is critical for widespread adoption.
- Electrolyzer Efficiency and Durability: While improving, further advancements are needed to optimize electrolyzer performance and longevity, especially for large-scale industrial applications.
- Supply Chain Constraints: The sourcing of critical raw materials for electrolyzer production and the availability of skilled labor can pose challenges as the market scales.
- Regulatory Uncertainties and Permitting Processes: Complex and lengthy permitting processes for new facilities can slow down project development and investment.
Growth Drivers in the Europe Power to Gas Market Market
The growth of the Europe Power to Gas market is primarily propelled by a confluence of powerful drivers. Foremost among these is the unwavering commitment to climate change mitigation, with ambitious EU and national targets for greenhouse gas emission reductions making green hydrogen and synthetic methane indispensable. The pursuit of enhanced energy security and independence, particularly in light of geopolitical volatilities, further fuels the demand for domestically produced, renewable energy carriers. Technological advancements, such as the increasing efficiency and decreasing cost of electrolyzers, coupled with innovations in methanation processes, are making Power-to-Gas solutions more economically attractive. Furthermore, supportive government policies, including subsidies, tax incentives, and renewable gas blending mandates, are creating a favorable investment environment and stimulating market uptake across various sectors.
Challenges Impacting Europe Power to Gas Market Growth
Despite its immense potential, the Europe Power to Gas market faces several significant challenges. The high upfront capital investment required for the establishment of Power-to-Gas facilities and associated infrastructure, such as hydrogen pipelines and storage, remains a substantial hurdle for widespread deployment. The current limited availability and high cost of renewable electricity, though decreasing, can impact the overall economic viability of green hydrogen production. Moreover, the lack of established and widespread hydrogen transportation and distribution networks necessitates considerable investment in new infrastructure, hindering rapid scaling. Regulatory complexities and lengthy permitting procedures for new projects can also create delays and uncertainty for investors. Finally, competition from other decarbonization technologies and the need to develop robust supply chains for critical components like electrolyzers present ongoing challenges that need to be addressed for sustained market growth.
Key Players Shaping the Europe Power to Gas Market Market
- Siemens Energy AG
- GRT Gaz SA
- AquahydreX Inc
- Ineratec GmbH
- Electrochaea GmbH
- Sempra Energy
- Nel ASA
Significant Europe Power to Gas Market Industry Milestones
- March 2022: Environmental Resources Management's (ERM) ERM Dolphyn and Source Energie announced a partnership to develop a 200 MW floating wind to hydrogen project in the United Kingdom, expected to be commissioned by 2027 and likely to produce green hydrogen.
- March 2022: Sunfire secured a contract to supply electrolysis equipment for Finland's first industrial-scale green hydrogen plant by P2X Solutions. Construction of the 20 MW hydrogen and synthetic methane production plant in Harjavalta, southwest Finland, began mid-2022, with an investment of EUR 70 million.
Future Outlook for Europe Power to Gas Market Market
The future outlook for the Europe Power to Gas market is exceptionally bright, driven by accelerating decarbonization mandates and increasing energy independence ambitions across the continent. Significant growth catalysts include the ongoing decline in renewable energy costs, continuous technological innovations in electrolysis and methanation, and the expansion of supportive regulatory frameworks. Strategic opportunities lie in the scaling up of green hydrogen production for industrial applications, the development of e-fuels for the transport sector (particularly aviation and shipping), and the integration of Power-to-Gas for grid balancing and seasonal energy storage. The market is poised for a substantial expansion, with Power-to-Gas technologies playing a pivotal role in achieving Europe's net-zero targets and fostering a sustainable energy future. The overall market potential is estimated to be in the hundreds of billions of Euros by 2033.
Europe Power to Gas Market Segmentation
-
1. Technology
- 1.1. Power-to
- 1.2. Power-to-Methane (incl. Chemical and Biological)
-
2. Capacity
- 2.1. More than 1000 KW
- 2.2. 100 to 1000 KW
- 2.3. Less than 100 KW
-
3. End-User
- 3.1. Utilities
- 3.2. Industrial
- 3.3. Commercial
-
4. Location
- 4.1. United Kingdom
- 4.2. Germany
- 4.3. France
- 4.4. Spain
- 4.5. Others
Europe Power to Gas Market Segmentation By Geography
-
1. Europe
- 1.1. United Kingdom
- 1.2. Germany
- 1.3. France
- 1.4. Italy
- 1.5. Spain
- 1.6. Netherlands
- 1.7. Belgium
- 1.8. Sweden
- 1.9. Norway
- 1.10. Poland
- 1.11. Denmark
Europe Power to Gas Market Regional Market Share
Geographic Coverage of Europe Power to Gas Market
Europe Power to Gas Market REPORT HIGHLIGHTS
| Aspects | Details |
|---|---|
| Study Period | 2020-2034 |
| Base Year | 2025 |
| Estimated Year | 2026 |
| Forecast Period | 2026-2034 |
| Historical Period | 2020-2025 |
| Growth Rate | CAGR of 11.35% from 2020-2034 |
| Segmentation |
|
Table of Contents
- 1. Introduction
- 1.1. Research Scope
- 1.2. Market Segmentation
- 1.3. Research Objective
- 1.4. Definitions and Assumptions
- 2. Executive Summary
- 2.1. Market Snapshot
- 3. Market Dynamics
- 3.1. Market Drivers
- 3.2. Market Restrains
- 3.3. Market Trends
- 3.4. Market Opportunities
- 4. Market Factor Analysis
- 4.1. Porters Five Forces
- 4.1.1. Bargaining Power of Suppliers
- 4.1.2. Bargaining Power of Buyers
- 4.1.3. Threat of New Entrants
- 4.1.4. Threat of Substitutes
- 4.1.5. Competitive Rivalry
- 4.2. PESTEL analysis
- 4.3. BCG Analysis
- 4.3.1. Stars (High Growth, High Market Share)
- 4.3.2. Cash Cows (Low Growth, High Market Share)
- 4.3.3. Question Mark (High Growth, Low Market Share)
- 4.3.4. Dogs (Low Growth, Low Market Share)
- 4.4. Ansoff Matrix Analysis
- 4.5. Supply Chain Analysis
- 4.6. Regulatory Landscape
- 4.7. Current Market Potential and Opportunity Assessment (TAM–SAM–SOM Framework)
- 4.8. TIR Analyst Note
- 4.1. Porters Five Forces
- 5. Market Analysis, Insights and Forecast 2021-2033
- 5.1. Market Analysis, Insights and Forecast - by Technology
- 5.1.1. Power-to
- 5.1.2. Power-to-Methane (incl. Chemical and Biological)
- 5.2. Market Analysis, Insights and Forecast - by Capacity
- 5.2.1. More than 1000 KW
- 5.2.2. 100 to 1000 KW
- 5.2.3. Less than 100 KW
- 5.3. Market Analysis, Insights and Forecast - by End-User
- 5.3.1. Utilities
- 5.3.2. Industrial
- 5.3.3. Commercial
- 5.4. Market Analysis, Insights and Forecast - by Location
- 5.4.1. United Kingdom
- 5.4.2. Germany
- 5.4.3. France
- 5.4.4. Spain
- 5.4.5. Others
- 5.5. Market Analysis, Insights and Forecast - by Region
- 5.5.1. Europe
- 5.1. Market Analysis, Insights and Forecast - by Technology
- 6. Europe Power to Gas Market Analysis, Insights and Forecast, 2021-2033
- 6.1. Market Analysis, Insights and Forecast - by Technology
- 6.1.1. Power-to
- 6.1.2. Power-to-Methane (incl. Chemical and Biological)
- 6.2. Market Analysis, Insights and Forecast - by Capacity
- 6.2.1. More than 1000 KW
- 6.2.2. 100 to 1000 KW
- 6.2.3. Less than 100 KW
- 6.3. Market Analysis, Insights and Forecast - by End-User
- 6.3.1. Utilities
- 6.3.2. Industrial
- 6.3.3. Commercial
- 6.4. Market Analysis, Insights and Forecast - by Location
- 6.4.1. United Kingdom
- 6.4.2. Germany
- 6.4.3. France
- 6.4.4. Spain
- 6.4.5. Others
- 6.1. Market Analysis, Insights and Forecast - by Technology
- 7. Competitive Analysis
- 7.1. Company Profiles
- 7.1.1 Siemens Energy AG
- 7.1.1.1. Company Overview
- 7.1.1.2. Products
- 7.1.1.3. Company Financials
- 7.1.1.4. SWOT Analysis
- 7.1.2 GRT Gaz SA
- 7.1.2.1. Company Overview
- 7.1.2.2. Products
- 7.1.2.3. Company Financials
- 7.1.2.4. SWOT Analysis
- 7.1.3 AquahydreX Inc
- 7.1.3.1. Company Overview
- 7.1.3.2. Products
- 7.1.3.3. Company Financials
- 7.1.3.4. SWOT Analysis
- 7.1.4 Ineratec GmbH
- 7.1.4.1. Company Overview
- 7.1.4.2. Products
- 7.1.4.3. Company Financials
- 7.1.4.4. SWOT Analysis
- 7.1.5 Electrochaea GmbH
- 7.1.5.1. Company Overview
- 7.1.5.2. Products
- 7.1.5.3. Company Financials
- 7.1.5.4. SWOT Analysis
- 7.1.6 Sempra Energy
- 7.1.6.1. Company Overview
- 7.1.6.2. Products
- 7.1.6.3. Company Financials
- 7.1.6.4. SWOT Analysis
- 7.1.7 Nel ASA
- 7.1.7.1. Company Overview
- 7.1.7.2. Products
- 7.1.7.3. Company Financials
- 7.1.7.4. SWOT Analysis
- 7.1.1 Siemens Energy AG
- 7.2. Market Entropy
- 7.2.1 Company's Key Areas Served
- 7.2.2 Recent Developments
- 7.3. Company Market Share Analysis 2025
- 7.3.1 Top 5 Companies Market Share Analysis
- 7.3.2 Top 3 Companies Market Share Analysis
- 7.4. List of Potential Customers
- 8. Research Methodology
List of Figures
- Figure 1: Europe Power to Gas Market Revenue Breakdown (billion, %) by Product 2025 & 2033
- Figure 2: Europe Power to Gas Market Share (%) by Company 2025
List of Tables
- Table 1: Europe Power to Gas Market Revenue billion Forecast, by Technology 2020 & 2033
- Table 2: Europe Power to Gas Market Volume Gigawatt Forecast, by Technology 2020 & 2033
- Table 3: Europe Power to Gas Market Revenue billion Forecast, by Capacity 2020 & 2033
- Table 4: Europe Power to Gas Market Volume Gigawatt Forecast, by Capacity 2020 & 2033
- Table 5: Europe Power to Gas Market Revenue billion Forecast, by End-User 2020 & 2033
- Table 6: Europe Power to Gas Market Volume Gigawatt Forecast, by End-User 2020 & 2033
- Table 7: Europe Power to Gas Market Revenue billion Forecast, by Location 2020 & 2033
- Table 8: Europe Power to Gas Market Volume Gigawatt Forecast, by Location 2020 & 2033
- Table 9: Europe Power to Gas Market Revenue billion Forecast, by Region 2020 & 2033
- Table 10: Europe Power to Gas Market Volume Gigawatt Forecast, by Region 2020 & 2033
- Table 11: Europe Power to Gas Market Revenue billion Forecast, by Technology 2020 & 2033
- Table 12: Europe Power to Gas Market Volume Gigawatt Forecast, by Technology 2020 & 2033
- Table 13: Europe Power to Gas Market Revenue billion Forecast, by Capacity 2020 & 2033
- Table 14: Europe Power to Gas Market Volume Gigawatt Forecast, by Capacity 2020 & 2033
- Table 15: Europe Power to Gas Market Revenue billion Forecast, by End-User 2020 & 2033
- Table 16: Europe Power to Gas Market Volume Gigawatt Forecast, by End-User 2020 & 2033
- Table 17: Europe Power to Gas Market Revenue billion Forecast, by Location 2020 & 2033
- Table 18: Europe Power to Gas Market Volume Gigawatt Forecast, by Location 2020 & 2033
- Table 19: Europe Power to Gas Market Revenue billion Forecast, by Country 2020 & 2033
- Table 20: Europe Power to Gas Market Volume Gigawatt Forecast, by Country 2020 & 2033
- Table 21: United Kingdom Europe Power to Gas Market Revenue (billion) Forecast, by Application 2020 & 2033
- Table 22: United Kingdom Europe Power to Gas Market Volume (Gigawatt) Forecast, by Application 2020 & 2033
- Table 23: Germany Europe Power to Gas Market Revenue (billion) Forecast, by Application 2020 & 2033
- Table 24: Germany Europe Power to Gas Market Volume (Gigawatt) Forecast, by Application 2020 & 2033
- Table 25: France Europe Power to Gas Market Revenue (billion) Forecast, by Application 2020 & 2033
- Table 26: France Europe Power to Gas Market Volume (Gigawatt) Forecast, by Application 2020 & 2033
- Table 27: Italy Europe Power to Gas Market Revenue (billion) Forecast, by Application 2020 & 2033
- Table 28: Italy Europe Power to Gas Market Volume (Gigawatt) Forecast, by Application 2020 & 2033
- Table 29: Spain Europe Power to Gas Market Revenue (billion) Forecast, by Application 2020 & 2033
- Table 30: Spain Europe Power to Gas Market Volume (Gigawatt) Forecast, by Application 2020 & 2033
- Table 31: Netherlands Europe Power to Gas Market Revenue (billion) Forecast, by Application 2020 & 2033
- Table 32: Netherlands Europe Power to Gas Market Volume (Gigawatt) Forecast, by Application 2020 & 2033
- Table 33: Belgium Europe Power to Gas Market Revenue (billion) Forecast, by Application 2020 & 2033
- Table 34: Belgium Europe Power to Gas Market Volume (Gigawatt) Forecast, by Application 2020 & 2033
- Table 35: Sweden Europe Power to Gas Market Revenue (billion) Forecast, by Application 2020 & 2033
- Table 36: Sweden Europe Power to Gas Market Volume (Gigawatt) Forecast, by Application 2020 & 2033
- Table 37: Norway Europe Power to Gas Market Revenue (billion) Forecast, by Application 2020 & 2033
- Table 38: Norway Europe Power to Gas Market Volume (Gigawatt) Forecast, by Application 2020 & 2033
- Table 39: Poland Europe Power to Gas Market Revenue (billion) Forecast, by Application 2020 & 2033
- Table 40: Poland Europe Power to Gas Market Volume (Gigawatt) Forecast, by Application 2020 & 2033
- Table 41: Denmark Europe Power to Gas Market Revenue (billion) Forecast, by Application 2020 & 2033
- Table 42: Denmark Europe Power to Gas Market Volume (Gigawatt) Forecast, by Application 2020 & 2033
Frequently Asked Questions
1. What is the projected Compound Annual Growth Rate (CAGR) of the Europe Power to Gas Market?
The projected CAGR is approximately 11.35%.
2. Which companies are prominent players in the Europe Power to Gas Market?
Key companies in the market include Siemens Energy AG, GRT Gaz SA, AquahydreX Inc, Ineratec GmbH, Electrochaea GmbH, Sempra Energy, Nel ASA.
3. What are the main segments of the Europe Power to Gas Market?
The market segments include Technology, Capacity, End-User, Location.
4. Can you provide details about the market size?
The market size is estimated to be USD 46.76 billion as of 2022.
5. What are some drivers contributing to market growth?
4.; Growing Demand to Develop the Natural Gas Infrastructure4.; Increase in Offshore Oil and Gas Exploration and Production (E&P) Activities.
6. What are the notable trends driving market growth?
Germany is going to dominate the market.
7. Are there any restraints impacting market growth?
4.; High Volatility of Oil and Gas Prices.
8. Can you provide examples of recent developments in the market?
In March 2022. Environmental Resources Management's (ERM) ERM Dolphyn and Source Energie have entered into a partnership to develop a 200 floating wind to hydrogen project in the United Kingdom. The project is expected to be commissioned by 2027 and is likely to produce green hydrogen.
9. What pricing options are available for accessing the report?
Pricing options include single-user, multi-user, and enterprise licenses priced at USD 4750, USD 5250, and USD 8750 respectively.
10. Is the market size provided in terms of value or volume?
The market size is provided in terms of value, measured in billion and volume, measured in Gigawatt.
11. Are there any specific market keywords associated with the report?
Yes, the market keyword associated with the report is "Europe Power to Gas Market," which aids in identifying and referencing the specific market segment covered.
12. How do I determine which pricing option suits my needs best?
The pricing options vary based on user requirements and access needs. Individual users may opt for single-user licenses, while businesses requiring broader access may choose multi-user or enterprise licenses for cost-effective access to the report.
13. Are there any additional resources or data provided in the Europe Power to Gas Market report?
While the report offers comprehensive insights, it's advisable to review the specific contents or supplementary materials provided to ascertain if additional resources or data are available.
14. How can I stay updated on further developments or reports in the Europe Power to Gas Market?
To stay informed about further developments, trends, and reports in the Europe Power to Gas Market, consider subscribing to industry newsletters, following relevant companies and organizations, or regularly checking reputable industry news sources and publications.
Methodology
Step 1 - Identification of Relevant Samples Size from Population Database


Step 2 - Approaches for Defining Global Market Size (Value, Volume* & Price*)

Note*: In applicable scenarios
Step 3 - Data Sources
Primary Research
- Web Analytics
- Survey Reports
- Research Institute
- Latest Research Reports
- Opinion Leaders
Secondary Research
- Annual Reports
- White Paper
- Latest Press Release
- Industry Association
- Paid Database
- Investor Presentations

Step 4 - Data Triangulation
Involves using different sources of information in order to increase the validity of a study
These sources are likely to be stakeholders in a program - participants, other researchers, program staff, other community members, and so on.
Then we put all data in single framework & apply various statistical tools to find out the dynamic on the market.
During the analysis stage, feedback from the stakeholder groups would be compared to determine areas of agreement as well as areas of divergence