

Key Insights
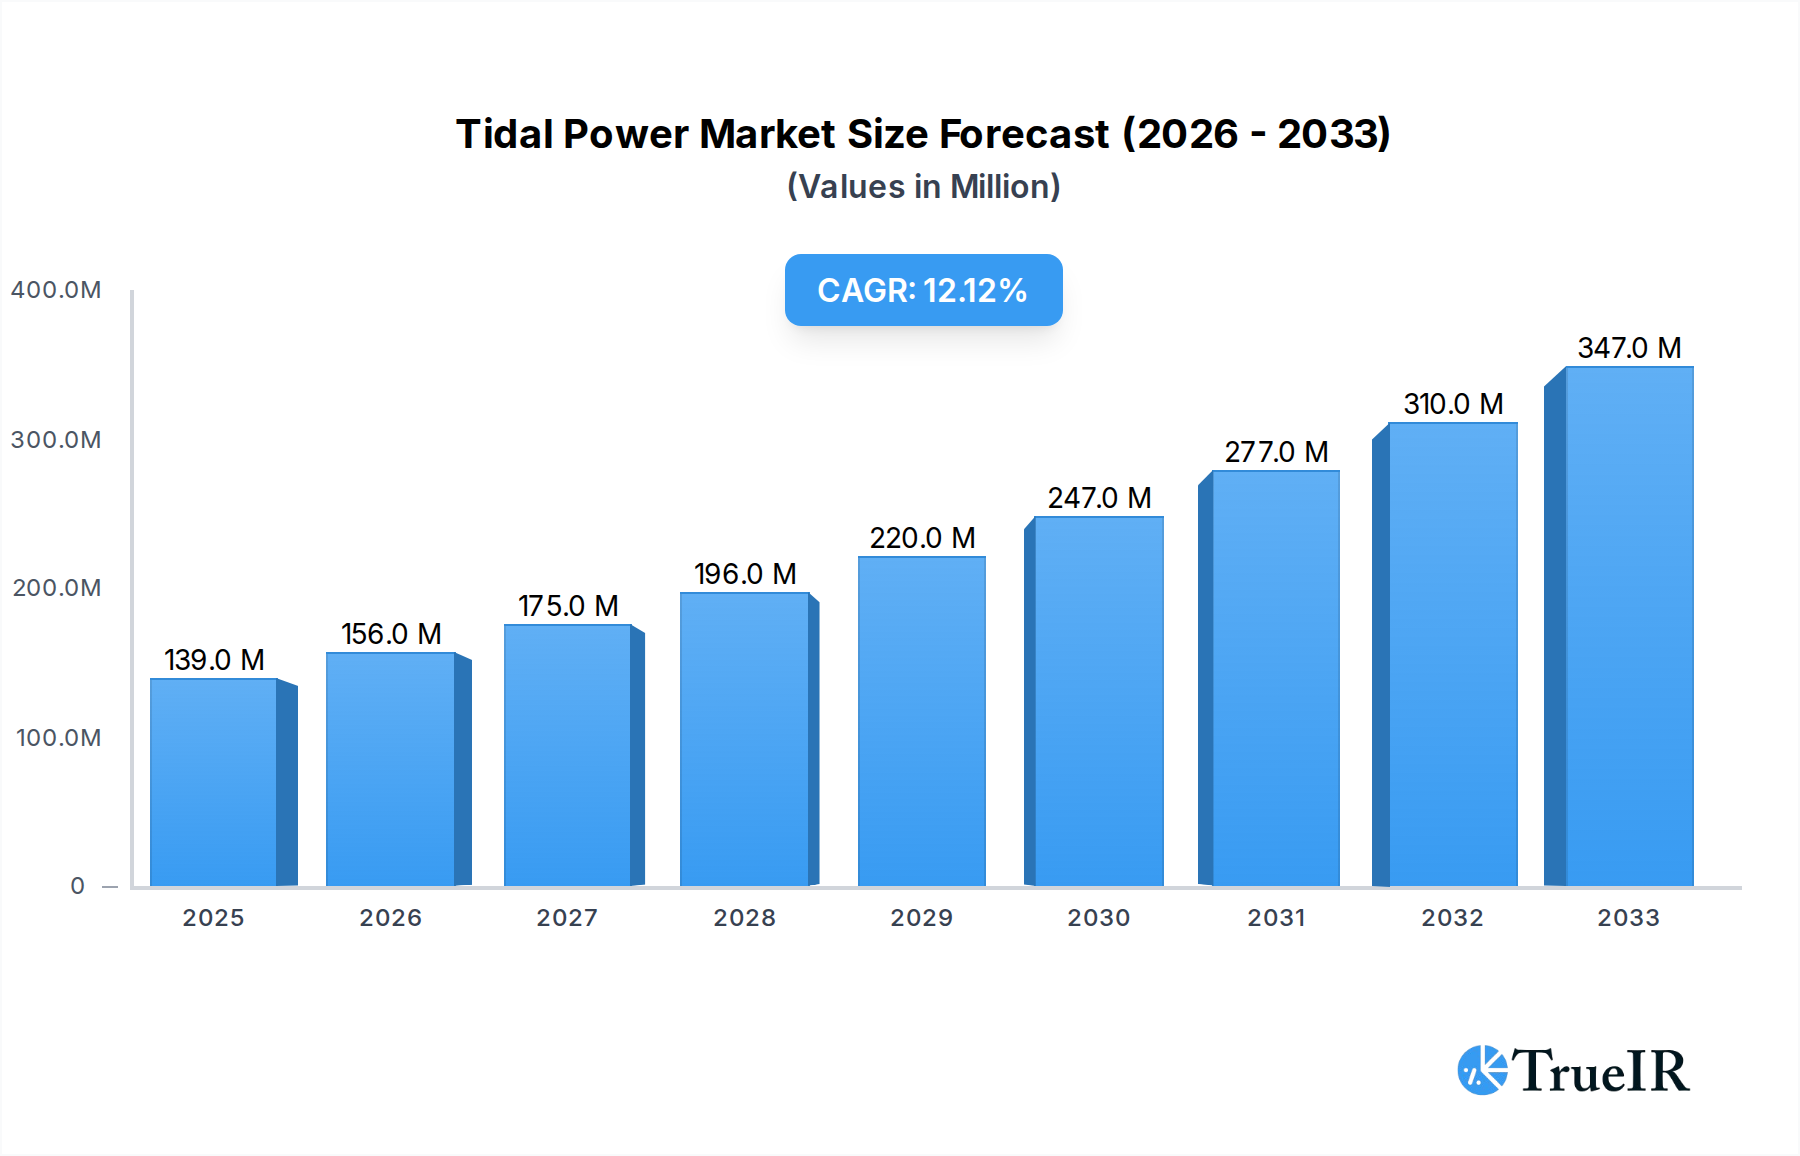
The global Tidal Power Market is poised for significant expansion, with an estimated market size of $139 million in 2025. This robust growth is fueled by an impressive Compound Annual Growth Rate (CAGR) of 11.3% projected over the forecast period, indicating a strong and sustained upward trajectory for tidal energy. This expansion is driven by an increasing global demand for renewable energy sources, advancements in tidal energy conversion technologies, and supportive government policies aimed at decarbonization and energy independence. The inherent reliability and predictability of tidal currents, compared to other renewable sources like solar and wind, present a compelling case for their widespread adoption. Key technological innovations, such as the development of more efficient tidal stream generators and floating platforms, are further reducing installation costs and improving the economic viability of tidal power projects.

Tidal Power Market Market Size (In Million)
While the market presents immense opportunities, certain challenges need to be addressed. High initial capital expenditure for tidal power infrastructure, coupled with the complexities of offshore installations and maintenance, represent significant restraints. Environmental concerns and the potential impact on marine ecosystems also require careful consideration and mitigation strategies. However, the continuous improvement in turbine design, material science, and project management is gradually overcoming these hurdles. Major players are actively investing in research and development to enhance efficiency and reduce the environmental footprint of tidal energy systems. The market is segmented by power generation method, including Tidal Barrage, Floating Tidal Power Platforms, and Tidal Stream Generation, with Tidal Stream Generation expected to see substantial growth due to its lower environmental impact and flexibility. Prominent companies like SIMEC Atlantis Energy Ltd, Nova Innovation Ltd, and Orbital Marine Power Ltd are at the forefront of this innovation, driving the market forward. Regionally, Europe, particularly the United Kingdom and Denmark, is leading the adoption of tidal power, followed by Asia Pacific and North America, as nations increasingly prioritize clean energy solutions.
Tidal Power Market Company Market Share
Tidal Power Market: Harnessing Ocean Energy for a Sustainable Future (2024-2033)
This comprehensive Tidal Power Market report offers an in-depth analysis of the global market dynamics, providing critical insights for stakeholders looking to capitalize on the burgeoning marine renewable energy sector. With a study period spanning from 2019 to 2033, and a base year of 2025, this report delivers a robust forecast of market growth, trends, and opportunities. We examine the market size, technological advancements, competitive landscape, and regulatory frameworks shaping the future of tidal energy generation. Discover the untapped potential of tidal power, a reliable and predictable source of clean energy, as the world transitions towards a low-carbon economy.
Tidal Power Market Market Structure & Competitive Landscape
The Tidal Power Market is characterized by a moderate to high level of market concentration, driven by significant capital investment requirements and the need for specialized technological expertise. Innovation is a key differentiator, with companies constantly investing in R&D to improve turbine efficiency, reduce installation costs, and enhance the environmental compatibility of tidal energy systems. Regulatory impacts are substantial, with government incentives, permitting processes, and grid connection policies playing a crucial role in project viability. Product substitutes, such as offshore wind and solar energy, exert competitive pressure, though tidal power's predictability offers a distinct advantage. End-user segmentation primarily revolves around utility-scale power generation and, to a lesser extent, off-grid and remote power solutions. Mergers and acquisitions (M&A) activity is on the rise as larger energy corporations seek to integrate tidal power into their renewable energy portfolios, aiming to achieve greater market share and leverage synergistic technologies. In the historical period (2019-2024), M&A activities have been estimated at over 500 million USD, with a projected increase in the forecast period.
Tidal Power Market Market Trends & Opportunities
The global Tidal Power Market is poised for substantial growth, projected to reach a market size of over 5,000 million USD by 2033. This expansion is fueled by the escalating demand for clean and renewable energy sources, driven by stringent environmental regulations and a global commitment to decarbonization. Technological advancements are at the forefront of this market evolution, with continuous improvements in the efficiency and cost-effectiveness of tidal energy converters (TECs). Floating tidal power platforms are gaining significant traction due to their reduced environmental impact and flexibility in deployment, offering a compelling alternative to fixed-foundation systems. Consumer preferences are increasingly shifting towards sustainable energy solutions, with a growing awareness of the benefits of tidal power's predictable generation patterns compared to intermittent renewable sources like solar and wind. The competitive dynamics are intensifying, with established players and innovative startups vying for market dominance through strategic partnerships, technological innovation, and project development. Opportunities abound in emerging markets with significant tidal resources, as well as in the retrofitting of existing infrastructure to incorporate tidal power generation. The market penetration rate for tidal power, while currently nascent, is expected to witness a Compound Annual Growth Rate (CAGR) of approximately 15% during the forecast period (2025-2033).
Dominant Markets & Segments in Tidal Power Market
The Floating Tidal Power Platform segment is emerging as the dominant force in the Tidal Power Market, driven by its inherent advantages in deployment flexibility, reduced environmental impact, and suitability for a wider range of seabed conditions. This segment is projected to witness the highest growth rates throughout the forecast period (2025–2033). Among the Tidal Energy Converters, the Horizontal Axis Turbine remains a leading technology due to its proven efficiency and established track record, though advancements in Vertical Axis Turbine designs are increasingly contributing to improved performance and reduced maintenance.
Key Growth Drivers for Floating Tidal Power Platforms:
- Technological Innovation: Continuous improvements in buoyancy, mooring systems, and power transmission are enhancing the reliability and cost-effectiveness of floating platforms.
- Environmental Considerations: Floating solutions minimize disruption to marine ecosystems and offer less intrusive installation processes compared to fixed structures.
- Deployment Versatility: Their ability to be deployed in deeper waters and locations with challenging seabed topography broadens the potential for tidal energy extraction.
- Reduced Infrastructure Costs: Compared to large-scale barrage systems, floating platforms often require less substantial and costly fixed infrastructure.
Regionally, Europe, particularly the United Kingdom and France, continues to lead in tidal power development and deployment, owing to supportive government policies, extensive research and development, and significant tidal resource availability. However, emerging markets in Asia-Pacific, such as Indonesia and Southeast Asia, are showing immense promise for future growth, driven by a growing need for diversified renewable energy sources and increasing investment in marine technologies. The Tidal Stream Generation method is also experiencing robust growth, propelled by advancements in turbine design and operational efficiency.
Tidal Power Market Product Analysis
The Tidal Power Market is witnessing a wave of product innovation focused on enhancing energy capture efficiency, reducing operational costs, and minimizing environmental impact. Key advancements include the development of more robust and efficient tidal turbines, with improved blade designs and advanced control systems. Floating tidal energy converters are gaining prominence, offering greater deployment flexibility and reduced seabed disturbance. The application of these technologies spans large-scale grid-connected power generation to smaller, localized energy solutions for remote communities. Competitive advantages are being carved out through superior durability, lower levelized cost of energy (LCOE), and innovative installation and maintenance techniques. The integration of artificial intelligence for predictive maintenance and optimized energy output is also a significant differentiating factor.
Key Drivers, Barriers & Challenges in Tidal Power Market
Key Drivers:
- Abundant & Predictable Energy Source: Tidal currents offer a consistent and highly predictable source of renewable energy, crucial for grid stability.
- Decarbonization Goals: Global and national commitments to reduce greenhouse gas emissions are driving the demand for clean energy alternatives.
- Technological Advancements: Continuous improvements in turbine efficiency, reliability, and cost-effectiveness are making tidal power more competitive.
- Government Support & Incentives: Favorable policies, feed-in tariffs, and research grants are accelerating market development.
Barriers & Challenges:
- High Initial Capital Costs: The upfront investment for tidal power projects remains a significant barrier, estimated at over 1,000 million USD per large-scale project.
- Environmental Concerns & Permitting: Potential impacts on marine life and ecosystems necessitate rigorous environmental assessments and lengthy permitting processes.
- Grid Connection & Infrastructure: Integrating tidal power into existing grids can require substantial upgrades and investments.
- Harsh Marine Environment: The corrosive nature of seawater and extreme tidal forces pose engineering challenges and increase maintenance requirements.
- Supply Chain Development: Establishing a robust and cost-effective supply chain for specialized components and services is ongoing.
Growth Drivers in the Tidal Power Market Market
The growth of the Tidal Power Market is primarily propelled by the global imperative to transition towards sustainable energy solutions and meet stringent decarbonization targets. Technological innovation is a significant catalyst, with ongoing research and development leading to more efficient, reliable, and cost-effective tidal energy converters (TECs). Advances in floating tidal platforms are expanding deployment possibilities to a wider range of locations. Economic drivers include the decreasing cost of renewable energy technologies and the potential for long-term energy security. Furthermore, supportive government policies, including subsidies, tax incentives, and favorable regulatory frameworks, are crucial in de-risking investments and encouraging project development. The predictable nature of tidal power, contrasting with the intermittency of solar and wind, also presents a unique selling proposition for grid stability.
Challenges Impacting Tidal Power Market Growth
Despite its promising outlook, the Tidal Power Market faces several significant challenges that impact its growth trajectory. The substantial upfront capital expenditure required for tidal energy projects remains a primary hurdle, with initial installations often costing upwards of 1,000 million USD. Regulatory complexities, including lengthy permitting processes and environmental impact assessments, can lead to project delays and increased costs. Supply chain limitations for specialized components and skilled labor can also constrain rapid expansion. Furthermore, competition from more established renewable energy sources like solar and wind, which often have lower Levelized Costs of Energy (LCOE) in current markets, presents a competitive pressure. Finally, the perception of environmental risks to marine ecosystems, although increasingly mitigated by technological advancements, can still influence public and regulatory acceptance.
Key Players Shaping the Tidal Power Market Market
- MAKO Turbines Pty Ltd
- SIMEC Atlantis Energy Ltd
- Nova Innovation Ltd
- Hydroquest SAS
- Lockheed Martin Corporation
- Orbital Marine Power Ltd
- Sustainable Marine Energy Ltd
- Andritz AG
Significant Tidal Power Market Industry Milestones
- March 2023: For the first time in Southeast Asia, a tidal-energy demonstration outside the grid in Singapore began generating power. NYK participated in this demonstration project, which is being run by Bluenergy Solutions, a marine renewable energy solutions developer, off Raffles Lighthouse on Satumu Island, some 14 kilometers off Singapore's main island. The project's goal is to commercialize tidal energy generation and supply.
- March 2023: Walton Marina helped BigMoon Power with its tidal energy project in Minas Basin. The company is set to use the facility to launch anchors for its floating machinery.
- September 2022: Sabella, a French company, formed a strategic cooperation with the state-owned Indonesian corporation PT PLN (Persero) and PT Meindo Elang Indah to conduct a feasibility study for the creation of the world's first tidal energy farm in the world's largest archipelagic state.
Future Outlook for Tidal Power Market Market
The future outlook for the Tidal Power Market is exceptionally bright, driven by an accelerating global demand for reliable, clean, and predictable energy sources. Strategic opportunities lie in the continued innovation of floating tidal technologies, which promise to unlock vast untapped tidal resources and reduce deployment costs. Increased collaboration between technology developers, energy utilities, and governments will be crucial for scaling up projects and driving down the Levelized Cost of Energy (LCOE) to competitive levels. The market potential is significant, with numerous coastal regions worldwide possessing substantial tidal energy resources that, when harnessed effectively, can contribute meaningfully to a sustainable energy future. Investments in grid infrastructure and the development of robust supply chains will further accelerate market penetration.
Tidal Power Market Segmentation
-
1. Power Generation Method
- 1.1. Tidal Barrage
- 1.2. Floating Tidal Power Platform
- 1.3. Tidal Stream Generation
- 1.4. Dynamic Tidal Power
-
2. Tidal Energy Converters
- 2.1. Horizontal Axis Turbine
- 2.2. Vertical Axis Turbine
- 2.3. Other Tidal Energy Converters
Tidal Power Market Segmentation By Geography
-
1. North America
- 1.1. United States
- 1.2. Canada
- 1.3. Rest of North America
-
2. Europe
- 2.1. United Kingdom
- 2.2. Denmark
- 2.3. France
- 2.4. Rest of the Europe
-
3. Asia Pacific
- 3.1. China
- 3.2. India
- 3.3. Japan
- 3.4. Rest of the Asia Pacific
-
4. South America
- 4.1. Brazil
- 4.2. Argentina
- 4.3. Rest of South America
-
5. Middle East and Africa
- 5.1. United Arab Emirates
- 5.2. South Africa
- 5.3. Saudi Arabia
- 5.4. Rest of Middle East and Africa
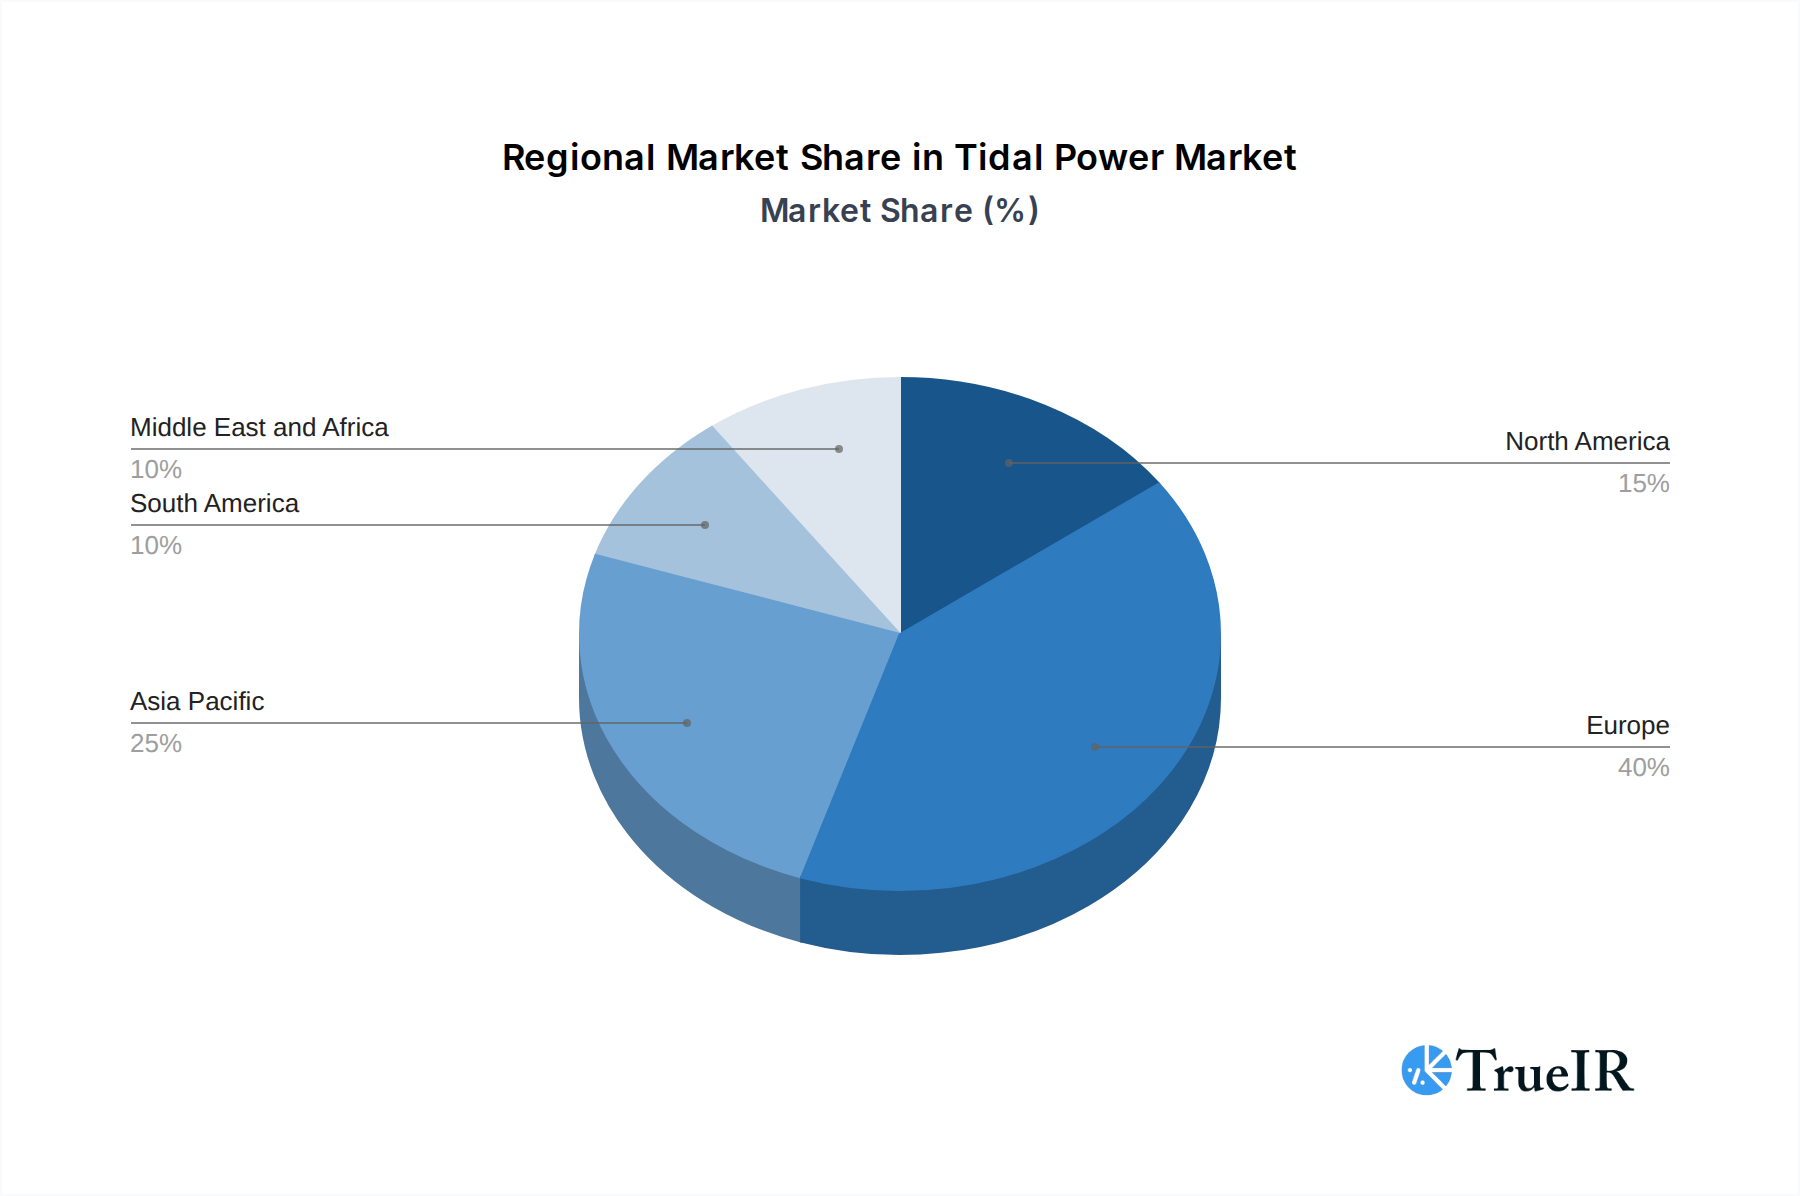
Tidal Power Market Regional Market Share
Geographic Coverage of Tidal Power Market
Tidal Power Market REPORT HIGHLIGHTS
| Aspects | Details |
|---|---|
| Study Period | 2020-2034 |
| Base Year | 2025 |
| Estimated Year | 2026 |
| Forecast Period | 2026-2034 |
| Historical Period | 2020-2025 |
| Growth Rate | CAGR of 28.6% from 2020-2034 |
| Segmentation |
|
Table of Contents
- 1. Introduction
- 1.1. Research Scope
- 1.2. Market Segmentation
- 1.3. Research Objective
- 1.4. Definitions and Assumptions
- 2. Executive Summary
- 2.1. Market Snapshot
- 3. Market Dynamics
- 3.1. Market Drivers
- 3.2. Market Restrains
- 3.3. Market Trends
- 3.4. Market Opportunities
- 4. Market Factor Analysis
- 4.1. Porters Five Forces
- 4.1.1. Bargaining Power of Suppliers
- 4.1.2. Bargaining Power of Buyers
- 4.1.3. Threat of New Entrants
- 4.1.4. Threat of Substitutes
- 4.1.5. Competitive Rivalry
- 4.2. PESTEL analysis
- 4.3. BCG Analysis
- 4.3.1. Stars (High Growth, High Market Share)
- 4.3.2. Cash Cows (Low Growth, High Market Share)
- 4.3.3. Question Mark (High Growth, Low Market Share)
- 4.3.4. Dogs (Low Growth, Low Market Share)
- 4.4. Ansoff Matrix Analysis
- 4.5. Supply Chain Analysis
- 4.6. Regulatory Landscape
- 4.7. Current Market Potential and Opportunity Assessment (TAM–SAM–SOM Framework)
- 4.8. TIR Analyst Note
- 4.1. Porters Five Forces
- 5. Market Analysis, Insights and Forecast 2021-2033
- 5.1. Market Analysis, Insights and Forecast - by Power Generation Method
- 5.1.1. Tidal Barrage
- 5.1.2. Floating Tidal Power Platform
- 5.1.3. Tidal Stream Generation
- 5.1.4. Dynamic Tidal Power
- 5.2. Market Analysis, Insights and Forecast - by Tidal Energy Converters
- 5.2.1. Horizontal Axis Turbine
- 5.2.2. Vertical Axis Turbine
- 5.2.3. Other Tidal Energy Converters
- 5.3. Market Analysis, Insights and Forecast - by Region
- 5.3.1. North America
- 5.3.2. Europe
- 5.3.3. Asia Pacific
- 5.3.4. South America
- 5.3.5. Middle East and Africa
- 5.1. Market Analysis, Insights and Forecast - by Power Generation Method
- 6. Global Tidal Power Market Analysis, Insights and Forecast, 2021-2033
- 6.1. Market Analysis, Insights and Forecast - by Power Generation Method
- 6.1.1. Tidal Barrage
- 6.1.2. Floating Tidal Power Platform
- 6.1.3. Tidal Stream Generation
- 6.1.4. Dynamic Tidal Power
- 6.2. Market Analysis, Insights and Forecast - by Tidal Energy Converters
- 6.2.1. Horizontal Axis Turbine
- 6.2.2. Vertical Axis Turbine
- 6.2.3. Other Tidal Energy Converters
- 6.1. Market Analysis, Insights and Forecast - by Power Generation Method
- 7. North America Tidal Power Market Analysis, Insights and Forecast, 2020-2032
- 7.1. Market Analysis, Insights and Forecast - by Power Generation Method
- 7.1.1. Tidal Barrage
- 7.1.2. Floating Tidal Power Platform
- 7.1.3. Tidal Stream Generation
- 7.1.4. Dynamic Tidal Power
- 7.2. Market Analysis, Insights and Forecast - by Tidal Energy Converters
- 7.2.1. Horizontal Axis Turbine
- 7.2.2. Vertical Axis Turbine
- 7.2.3. Other Tidal Energy Converters
- 7.1. Market Analysis, Insights and Forecast - by Power Generation Method
- 8. Europe Tidal Power Market Analysis, Insights and Forecast, 2020-2032
- 8.1. Market Analysis, Insights and Forecast - by Power Generation Method
- 8.1.1. Tidal Barrage
- 8.1.2. Floating Tidal Power Platform
- 8.1.3. Tidal Stream Generation
- 8.1.4. Dynamic Tidal Power
- 8.2. Market Analysis, Insights and Forecast - by Tidal Energy Converters
- 8.2.1. Horizontal Axis Turbine
- 8.2.2. Vertical Axis Turbine
- 8.2.3. Other Tidal Energy Converters
- 8.1. Market Analysis, Insights and Forecast - by Power Generation Method
- 9. Asia Pacific Tidal Power Market Analysis, Insights and Forecast, 2020-2032
- 9.1. Market Analysis, Insights and Forecast - by Power Generation Method
- 9.1.1. Tidal Barrage
- 9.1.2. Floating Tidal Power Platform
- 9.1.3. Tidal Stream Generation
- 9.1.4. Dynamic Tidal Power
- 9.2. Market Analysis, Insights and Forecast - by Tidal Energy Converters
- 9.2.1. Horizontal Axis Turbine
- 9.2.2. Vertical Axis Turbine
- 9.2.3. Other Tidal Energy Converters
- 9.1. Market Analysis, Insights and Forecast - by Power Generation Method
- 10. South America Tidal Power Market Analysis, Insights and Forecast, 2020-2032
- 10.1. Market Analysis, Insights and Forecast - by Power Generation Method
- 10.1.1. Tidal Barrage
- 10.1.2. Floating Tidal Power Platform
- 10.1.3. Tidal Stream Generation
- 10.1.4. Dynamic Tidal Power
- 10.2. Market Analysis, Insights and Forecast - by Tidal Energy Converters
- 10.2.1. Horizontal Axis Turbine
- 10.2.2. Vertical Axis Turbine
- 10.2.3. Other Tidal Energy Converters
- 10.1. Market Analysis, Insights and Forecast - by Power Generation Method
- 11. Middle East and Africa Tidal Power Market Analysis, Insights and Forecast, 2020-2032
- 11.1. Market Analysis, Insights and Forecast - by Power Generation Method
- 11.1.1. Tidal Barrage
- 11.1.2. Floating Tidal Power Platform
- 11.1.3. Tidal Stream Generation
- 11.1.4. Dynamic Tidal Power
- 11.2. Market Analysis, Insights and Forecast - by Tidal Energy Converters
- 11.2.1. Horizontal Axis Turbine
- 11.2.2. Vertical Axis Turbine
- 11.2.3. Other Tidal Energy Converters
- 11.1. Market Analysis, Insights and Forecast - by Power Generation Method
- 12. Competitive Analysis
- 12.1. Company Profiles
- 12.1.1 MAKO Turbines Pty Ltd
- 12.1.1.1. Company Overview
- 12.1.1.2. Products
- 12.1.1.3. Company Financials
- 12.1.1.4. SWOT Analysis
- 12.1.2 SIMEC Atlantis Energy Ltd
- 12.1.2.1. Company Overview
- 12.1.2.2. Products
- 12.1.2.3. Company Financials
- 12.1.2.4. SWOT Analysis
- 12.1.3 Nova Innovation Ltd
- 12.1.3.1. Company Overview
- 12.1.3.2. Products
- 12.1.3.3. Company Financials
- 12.1.3.4. SWOT Analysis
- 12.1.4 Hydroquest SAS
- 12.1.4.1. Company Overview
- 12.1.4.2. Products
- 12.1.4.3. Company Financials
- 12.1.4.4. SWOT Analysis
- 12.1.5 Lockheed Martin Corporation*List Not Exhaustive
- 12.1.5.1. Company Overview
- 12.1.5.2. Products
- 12.1.5.3. Company Financials
- 12.1.5.4. SWOT Analysis
- 12.1.6 Orbital Marine Power Ltd
- 12.1.6.1. Company Overview
- 12.1.6.2. Products
- 12.1.6.3. Company Financials
- 12.1.6.4. SWOT Analysis
- 12.1.7 Sustainable Marine Energy Ltd
- 12.1.7.1. Company Overview
- 12.1.7.2. Products
- 12.1.7.3. Company Financials
- 12.1.7.4. SWOT Analysis
- 12.1.8 Andritz AG
- 12.1.8.1. Company Overview
- 12.1.8.2. Products
- 12.1.8.3. Company Financials
- 12.1.8.4. SWOT Analysis
- 12.1.1 MAKO Turbines Pty Ltd
- 12.2. Market Entropy
- 12.2.1 Company's Key Areas Served
- 12.2.2 Recent Developments
- 12.3. Company Market Share Analysis 2025
- 12.3.1 Top 5 Companies Market Share Analysis
- 12.3.2 Top 3 Companies Market Share Analysis
- 12.4. List of Potential Customers
- 13. Research Methodology
List of Figures
- Figure 1: Global Tidal Power Market Revenue Breakdown (billion, %) by Region 2025 & 2033
- Figure 2: Global Tidal Power Market Volume Breakdown (gigawatt, %) by Region 2025 & 2033
- Figure 3: North America Tidal Power Market Revenue (billion), by Power Generation Method 2025 & 2033
- Figure 4: North America Tidal Power Market Volume (gigawatt), by Power Generation Method 2025 & 2033
- Figure 5: North America Tidal Power Market Revenue Share (%), by Power Generation Method 2025 & 2033
- Figure 6: North America Tidal Power Market Volume Share (%), by Power Generation Method 2025 & 2033
- Figure 7: North America Tidal Power Market Revenue (billion), by Tidal Energy Converters 2025 & 2033
- Figure 8: North America Tidal Power Market Volume (gigawatt), by Tidal Energy Converters 2025 & 2033
- Figure 9: North America Tidal Power Market Revenue Share (%), by Tidal Energy Converters 2025 & 2033
- Figure 10: North America Tidal Power Market Volume Share (%), by Tidal Energy Converters 2025 & 2033
- Figure 11: North America Tidal Power Market Revenue (billion), by Country 2025 & 2033
- Figure 12: North America Tidal Power Market Volume (gigawatt), by Country 2025 & 2033
- Figure 13: North America Tidal Power Market Revenue Share (%), by Country 2025 & 2033
- Figure 14: North America Tidal Power Market Volume Share (%), by Country 2025 & 2033
- Figure 15: Europe Tidal Power Market Revenue (billion), by Power Generation Method 2025 & 2033
- Figure 16: Europe Tidal Power Market Volume (gigawatt), by Power Generation Method 2025 & 2033
- Figure 17: Europe Tidal Power Market Revenue Share (%), by Power Generation Method 2025 & 2033
- Figure 18: Europe Tidal Power Market Volume Share (%), by Power Generation Method 2025 & 2033
- Figure 19: Europe Tidal Power Market Revenue (billion), by Tidal Energy Converters 2025 & 2033
- Figure 20: Europe Tidal Power Market Volume (gigawatt), by Tidal Energy Converters 2025 & 2033
- Figure 21: Europe Tidal Power Market Revenue Share (%), by Tidal Energy Converters 2025 & 2033
- Figure 22: Europe Tidal Power Market Volume Share (%), by Tidal Energy Converters 2025 & 2033
- Figure 23: Europe Tidal Power Market Revenue (billion), by Country 2025 & 2033
- Figure 24: Europe Tidal Power Market Volume (gigawatt), by Country 2025 & 2033
- Figure 25: Europe Tidal Power Market Revenue Share (%), by Country 2025 & 2033
- Figure 26: Europe Tidal Power Market Volume Share (%), by Country 2025 & 2033
- Figure 27: Asia Pacific Tidal Power Market Revenue (billion), by Power Generation Method 2025 & 2033
- Figure 28: Asia Pacific Tidal Power Market Volume (gigawatt), by Power Generation Method 2025 & 2033
- Figure 29: Asia Pacific Tidal Power Market Revenue Share (%), by Power Generation Method 2025 & 2033
- Figure 30: Asia Pacific Tidal Power Market Volume Share (%), by Power Generation Method 2025 & 2033
- Figure 31: Asia Pacific Tidal Power Market Revenue (billion), by Tidal Energy Converters 2025 & 2033
- Figure 32: Asia Pacific Tidal Power Market Volume (gigawatt), by Tidal Energy Converters 2025 & 2033
- Figure 33: Asia Pacific Tidal Power Market Revenue Share (%), by Tidal Energy Converters 2025 & 2033
- Figure 34: Asia Pacific Tidal Power Market Volume Share (%), by Tidal Energy Converters 2025 & 2033
- Figure 35: Asia Pacific Tidal Power Market Revenue (billion), by Country 2025 & 2033
- Figure 36: Asia Pacific Tidal Power Market Volume (gigawatt), by Country 2025 & 2033
- Figure 37: Asia Pacific Tidal Power Market Revenue Share (%), by Country 2025 & 2033
- Figure 38: Asia Pacific Tidal Power Market Volume Share (%), by Country 2025 & 2033
- Figure 39: South America Tidal Power Market Revenue (billion), by Power Generation Method 2025 & 2033
- Figure 40: South America Tidal Power Market Volume (gigawatt), by Power Generation Method 2025 & 2033
- Figure 41: South America Tidal Power Market Revenue Share (%), by Power Generation Method 2025 & 2033
- Figure 42: South America Tidal Power Market Volume Share (%), by Power Generation Method 2025 & 2033
- Figure 43: South America Tidal Power Market Revenue (billion), by Tidal Energy Converters 2025 & 2033
- Figure 44: South America Tidal Power Market Volume (gigawatt), by Tidal Energy Converters 2025 & 2033
- Figure 45: South America Tidal Power Market Revenue Share (%), by Tidal Energy Converters 2025 & 2033
- Figure 46: South America Tidal Power Market Volume Share (%), by Tidal Energy Converters 2025 & 2033
- Figure 47: South America Tidal Power Market Revenue (billion), by Country 2025 & 2033
- Figure 48: South America Tidal Power Market Volume (gigawatt), by Country 2025 & 2033
- Figure 49: South America Tidal Power Market Revenue Share (%), by Country 2025 & 2033
- Figure 50: South America Tidal Power Market Volume Share (%), by Country 2025 & 2033
- Figure 51: Middle East and Africa Tidal Power Market Revenue (billion), by Power Generation Method 2025 & 2033
- Figure 52: Middle East and Africa Tidal Power Market Volume (gigawatt), by Power Generation Method 2025 & 2033
- Figure 53: Middle East and Africa Tidal Power Market Revenue Share (%), by Power Generation Method 2025 & 2033
- Figure 54: Middle East and Africa Tidal Power Market Volume Share (%), by Power Generation Method 2025 & 2033
- Figure 55: Middle East and Africa Tidal Power Market Revenue (billion), by Tidal Energy Converters 2025 & 2033
- Figure 56: Middle East and Africa Tidal Power Market Volume (gigawatt), by Tidal Energy Converters 2025 & 2033
- Figure 57: Middle East and Africa Tidal Power Market Revenue Share (%), by Tidal Energy Converters 2025 & 2033
- Figure 58: Middle East and Africa Tidal Power Market Volume Share (%), by Tidal Energy Converters 2025 & 2033
- Figure 59: Middle East and Africa Tidal Power Market Revenue (billion), by Country 2025 & 2033
- Figure 60: Middle East and Africa Tidal Power Market Volume (gigawatt), by Country 2025 & 2033
- Figure 61: Middle East and Africa Tidal Power Market Revenue Share (%), by Country 2025 & 2033
- Figure 62: Middle East and Africa Tidal Power Market Volume Share (%), by Country 2025 & 2033
List of Tables
- Table 1: Global Tidal Power Market Revenue billion Forecast, by Power Generation Method 2020 & 2033
- Table 2: Global Tidal Power Market Volume gigawatt Forecast, by Power Generation Method 2020 & 2033
- Table 3: Global Tidal Power Market Revenue billion Forecast, by Tidal Energy Converters 2020 & 2033
- Table 4: Global Tidal Power Market Volume gigawatt Forecast, by Tidal Energy Converters 2020 & 2033
- Table 5: Global Tidal Power Market Revenue billion Forecast, by Region 2020 & 2033
- Table 6: Global Tidal Power Market Volume gigawatt Forecast, by Region 2020 & 2033
- Table 7: Global Tidal Power Market Revenue billion Forecast, by Power Generation Method 2020 & 2033
- Table 8: Global Tidal Power Market Volume gigawatt Forecast, by Power Generation Method 2020 & 2033
- Table 9: Global Tidal Power Market Revenue billion Forecast, by Tidal Energy Converters 2020 & 2033
- Table 10: Global Tidal Power Market Volume gigawatt Forecast, by Tidal Energy Converters 2020 & 2033
- Table 11: Global Tidal Power Market Revenue billion Forecast, by Country 2020 & 2033
- Table 12: Global Tidal Power Market Volume gigawatt Forecast, by Country 2020 & 2033
- Table 13: United States Tidal Power Market Revenue (billion) Forecast, by Application 2020 & 2033
- Table 14: United States Tidal Power Market Volume (gigawatt) Forecast, by Application 2020 & 2033
- Table 15: Canada Tidal Power Market Revenue (billion) Forecast, by Application 2020 & 2033
- Table 16: Canada Tidal Power Market Volume (gigawatt) Forecast, by Application 2020 & 2033
- Table 17: Rest of North America Tidal Power Market Revenue (billion) Forecast, by Application 2020 & 2033
- Table 18: Rest of North America Tidal Power Market Volume (gigawatt) Forecast, by Application 2020 & 2033
- Table 19: Global Tidal Power Market Revenue billion Forecast, by Power Generation Method 2020 & 2033
- Table 20: Global Tidal Power Market Volume gigawatt Forecast, by Power Generation Method 2020 & 2033
- Table 21: Global Tidal Power Market Revenue billion Forecast, by Tidal Energy Converters 2020 & 2033
- Table 22: Global Tidal Power Market Volume gigawatt Forecast, by Tidal Energy Converters 2020 & 2033
- Table 23: Global Tidal Power Market Revenue billion Forecast, by Country 2020 & 2033
- Table 24: Global Tidal Power Market Volume gigawatt Forecast, by Country 2020 & 2033
- Table 25: United Kingdom Tidal Power Market Revenue (billion) Forecast, by Application 2020 & 2033
- Table 26: United Kingdom Tidal Power Market Volume (gigawatt) Forecast, by Application 2020 & 2033
- Table 27: Denmark Tidal Power Market Revenue (billion) Forecast, by Application 2020 & 2033
- Table 28: Denmark Tidal Power Market Volume (gigawatt) Forecast, by Application 2020 & 2033
- Table 29: France Tidal Power Market Revenue (billion) Forecast, by Application 2020 & 2033
- Table 30: France Tidal Power Market Volume (gigawatt) Forecast, by Application 2020 & 2033
- Table 31: Rest of the Europe Tidal Power Market Revenue (billion) Forecast, by Application 2020 & 2033
- Table 32: Rest of the Europe Tidal Power Market Volume (gigawatt) Forecast, by Application 2020 & 2033
- Table 33: Global Tidal Power Market Revenue billion Forecast, by Power Generation Method 2020 & 2033
- Table 34: Global Tidal Power Market Volume gigawatt Forecast, by Power Generation Method 2020 & 2033
- Table 35: Global Tidal Power Market Revenue billion Forecast, by Tidal Energy Converters 2020 & 2033
- Table 36: Global Tidal Power Market Volume gigawatt Forecast, by Tidal Energy Converters 2020 & 2033
- Table 37: Global Tidal Power Market Revenue billion Forecast, by Country 2020 & 2033
- Table 38: Global Tidal Power Market Volume gigawatt Forecast, by Country 2020 & 2033
- Table 39: China Tidal Power Market Revenue (billion) Forecast, by Application 2020 & 2033
- Table 40: China Tidal Power Market Volume (gigawatt) Forecast, by Application 2020 & 2033
- Table 41: India Tidal Power Market Revenue (billion) Forecast, by Application 2020 & 2033
- Table 42: India Tidal Power Market Volume (gigawatt) Forecast, by Application 2020 & 2033
- Table 43: Japan Tidal Power Market Revenue (billion) Forecast, by Application 2020 & 2033
- Table 44: Japan Tidal Power Market Volume (gigawatt) Forecast, by Application 2020 & 2033
- Table 45: Rest of the Asia Pacific Tidal Power Market Revenue (billion) Forecast, by Application 2020 & 2033
- Table 46: Rest of the Asia Pacific Tidal Power Market Volume (gigawatt) Forecast, by Application 2020 & 2033
- Table 47: Global Tidal Power Market Revenue billion Forecast, by Power Generation Method 2020 & 2033
- Table 48: Global Tidal Power Market Volume gigawatt Forecast, by Power Generation Method 2020 & 2033
- Table 49: Global Tidal Power Market Revenue billion Forecast, by Tidal Energy Converters 2020 & 2033
- Table 50: Global Tidal Power Market Volume gigawatt Forecast, by Tidal Energy Converters 2020 & 2033
- Table 51: Global Tidal Power Market Revenue billion Forecast, by Country 2020 & 2033
- Table 52: Global Tidal Power Market Volume gigawatt Forecast, by Country 2020 & 2033
- Table 53: Brazil Tidal Power Market Revenue (billion) Forecast, by Application 2020 & 2033
- Table 54: Brazil Tidal Power Market Volume (gigawatt) Forecast, by Application 2020 & 2033
- Table 55: Argentina Tidal Power Market Revenue (billion) Forecast, by Application 2020 & 2033
- Table 56: Argentina Tidal Power Market Volume (gigawatt) Forecast, by Application 2020 & 2033
- Table 57: Rest of South America Tidal Power Market Revenue (billion) Forecast, by Application 2020 & 2033
- Table 58: Rest of South America Tidal Power Market Volume (gigawatt) Forecast, by Application 2020 & 2033
- Table 59: Global Tidal Power Market Revenue billion Forecast, by Power Generation Method 2020 & 2033
- Table 60: Global Tidal Power Market Volume gigawatt Forecast, by Power Generation Method 2020 & 2033
- Table 61: Global Tidal Power Market Revenue billion Forecast, by Tidal Energy Converters 2020 & 2033
- Table 62: Global Tidal Power Market Volume gigawatt Forecast, by Tidal Energy Converters 2020 & 2033
- Table 63: Global Tidal Power Market Revenue billion Forecast, by Country 2020 & 2033
- Table 64: Global Tidal Power Market Volume gigawatt Forecast, by Country 2020 & 2033
- Table 65: United Arab Emirates Tidal Power Market Revenue (billion) Forecast, by Application 2020 & 2033
- Table 66: United Arab Emirates Tidal Power Market Volume (gigawatt) Forecast, by Application 2020 & 2033
- Table 67: South Africa Tidal Power Market Revenue (billion) Forecast, by Application 2020 & 2033
- Table 68: South Africa Tidal Power Market Volume (gigawatt) Forecast, by Application 2020 & 2033
- Table 69: Saudi Arabia Tidal Power Market Revenue (billion) Forecast, by Application 2020 & 2033
- Table 70: Saudi Arabia Tidal Power Market Volume (gigawatt) Forecast, by Application 2020 & 2033
- Table 71: Rest of Middle East and Africa Tidal Power Market Revenue (billion) Forecast, by Application 2020 & 2033
- Table 72: Rest of Middle East and Africa Tidal Power Market Volume (gigawatt) Forecast, by Application 2020 & 2033
Frequently Asked Questions
1. What is the projected Compound Annual Growth Rate (CAGR) of the Tidal Power Market?
The projected CAGR is approximately 28.6%.
2. Which companies are prominent players in the Tidal Power Market?
Key companies in the market include MAKO Turbines Pty Ltd, SIMEC Atlantis Energy Ltd, Nova Innovation Ltd, Hydroquest SAS, Lockheed Martin Corporation*List Not Exhaustive, Orbital Marine Power Ltd, Sustainable Marine Energy Ltd, Andritz AG.
3. What are the main segments of the Tidal Power Market?
The market segments include Power Generation Method, Tidal Energy Converters.
4. Can you provide details about the market size?
The market size is estimated to be USD 1.35 billion as of 2022.
5. What are some drivers contributing to market growth?
4.; Global Energy Transition Toward Renewables4.; The Rollout of New Technologies in Many Developed Countries.
6. What are the notable trends driving market growth?
Floating Tidal Power Platform Expected to Witness Significant Growth.
7. Are there any restraints impacting market growth?
4.; The Technology's Exorbitant Costs and Environmental Impacts.
8. Can you provide examples of recent developments in the market?
March 2023, for the first time in Southeast Asia, a tidal-energy demonstration outside the grid in Singapore began generating power. NYK participated in this demonstration project, which is being run by Bluenergy Solutions, a marine renewable energy solutions developer, off Raffles Lighthouse on Satumu Island, some 14 kilometers off Singapore's main island. The project's goal is to commercialize tidal energy generation and supply.
9. What pricing options are available for accessing the report?
Pricing options include single-user, multi-user, and enterprise licenses priced at USD 4750, USD 5250, and USD 8750 respectively.
10. Is the market size provided in terms of value or volume?
The market size is provided in terms of value, measured in billion and volume, measured in gigawatt.
11. Are there any specific market keywords associated with the report?
Yes, the market keyword associated with the report is "Tidal Power Market," which aids in identifying and referencing the specific market segment covered.
12. How do I determine which pricing option suits my needs best?
The pricing options vary based on user requirements and access needs. Individual users may opt for single-user licenses, while businesses requiring broader access may choose multi-user or enterprise licenses for cost-effective access to the report.
13. Are there any additional resources or data provided in the Tidal Power Market report?
While the report offers comprehensive insights, it's advisable to review the specific contents or supplementary materials provided to ascertain if additional resources or data are available.
14. How can I stay updated on further developments or reports in the Tidal Power Market?
To stay informed about further developments, trends, and reports in the Tidal Power Market, consider subscribing to industry newsletters, following relevant companies and organizations, or regularly checking reputable industry news sources and publications.
Methodology
Step 1 - Identification of Relevant Samples Size from Population Database


Step 2 - Approaches for Defining Global Market Size (Value, Volume* & Price*)

Note*: In applicable scenarios
Step 3 - Data Sources
Primary Research
- Web Analytics
- Survey Reports
- Research Institute
- Latest Research Reports
- Opinion Leaders
Secondary Research
- Annual Reports
- White Paper
- Latest Press Release
- Industry Association
- Paid Database
- Investor Presentations

Step 4 - Data Triangulation
Involves using different sources of information in order to increase the validity of a study
These sources are likely to be stakeholders in a program - participants, other researchers, program staff, other community members, and so on.
Then we put all data in single framework & apply various statistical tools to find out the dynamic on the market.
During the analysis stage, feedback from the stakeholder groups would be compared to determine areas of agreement as well as areas of divergence