

Key Insights
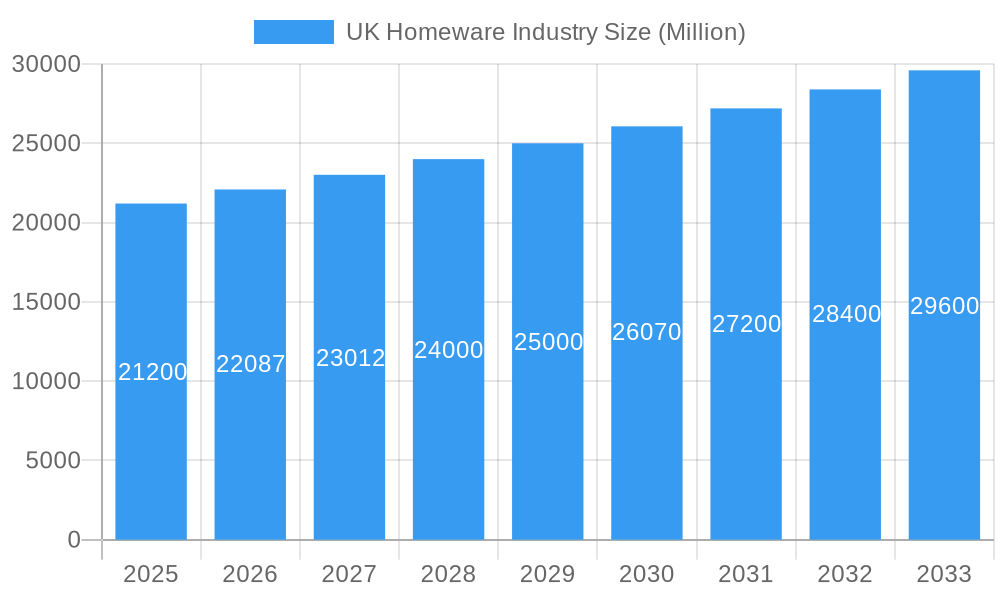
The UK homeware market, valued at £21.20 billion in 2025, is projected to experience steady growth, with a compound annual growth rate (CAGR) of 4.17% from 2025 to 2033. This growth is driven by several key factors. Firstly, a rising disposable income among UK households fuels increased spending on home improvements and furnishings. Secondly, the growing popularity of online shopping provides convenient access to a wider range of products, boosting sales across all segments. Furthermore, evolving consumer preferences towards sustainable and ethically sourced homeware contribute to market expansion. The home décor segment is anticipated to be a particularly strong performer, reflecting the increasing focus on personalization and creating aesthetically pleasing living spaces. Conversely, potential restraints include economic uncertainty and inflation, which may impact consumer spending on non-essential items. The market is segmented by product type (home furniture, textiles, appliances, floor coverings, décor, and others) and distribution channel (supermarkets, specialty stores, online, and others), reflecting diverse consumer preferences and purchasing behaviors. The competitive landscape includes both established international brands like IKEA and Bosch, and smaller, specialized retailers, indicating a mix of scale and niche players vying for market share.
UK Homeware Industry Market Size (In Billion)
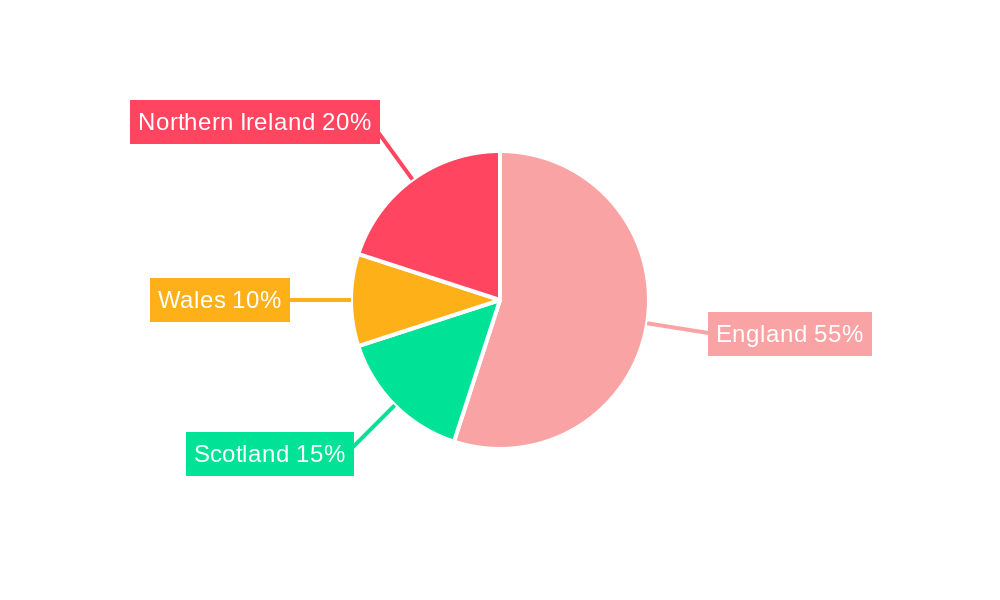
The geographical distribution of the market across England, Wales, Scotland, and Northern Ireland shows variations in spending patterns based on factors like population density, income levels, and regional preferences. London and other major urban areas likely account for a significant portion of market revenue, while smaller towns and rural regions may demonstrate different buying habits. The forecast period (2025-2033) anticipates continued market expansion, influenced by the sustained growth in online retail, innovative product development (e.g., smart home appliances), and a rising interest in home-related wellness and comfort. However, careful monitoring of macroeconomic conditions remains essential for accurately projecting future market performance. Understanding these diverse factors provides a comprehensive perspective on the dynamics of the UK homeware industry.
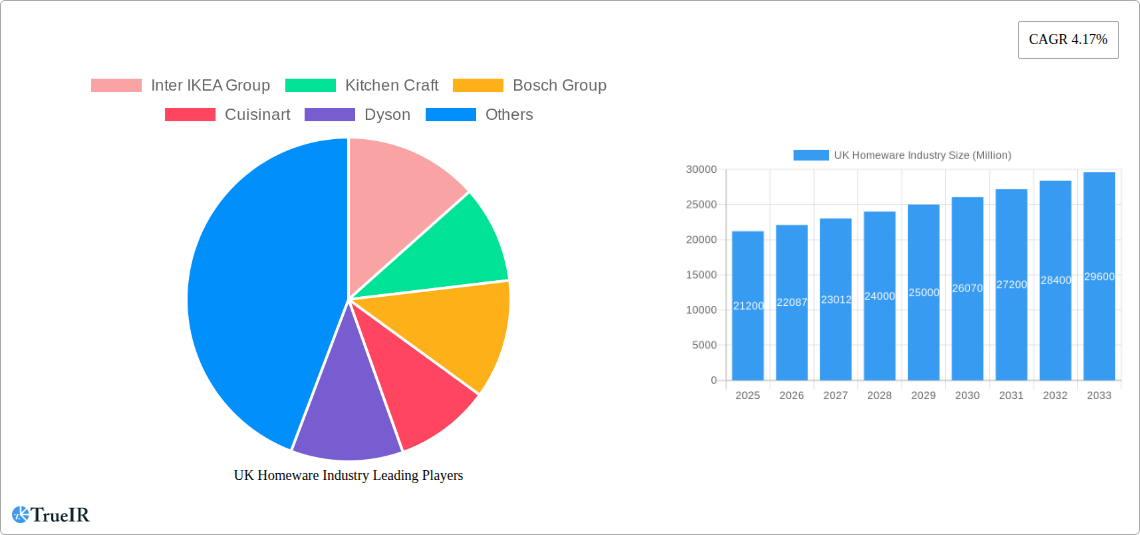
UK Homeware Industry Company Market Share
UK Homeware Industry Market Report: 2019-2033
This comprehensive report provides a detailed analysis of the UK homeware industry, offering invaluable insights for businesses, investors, and stakeholders seeking to navigate this dynamic market. Covering the period from 2019 to 2033, with a focus on 2025, this report projects a £XX Billion market by 2033, showcasing significant growth opportunities. The report leverages robust data and expert analysis to illuminate key trends, challenges, and future prospects.
UK Homeware Industry Market Structure & Competitive Landscape
The UK homeware market exhibits a moderately concentrated structure, with a few dominant players alongside numerous smaller businesses. The Herfindahl-Hirschman Index (HHI) for the industry is estimated at XX in 2025, indicating a competitive landscape with some consolidation. Innovation is a key driver, with companies investing heavily in new materials, designs, and smart home technologies. Regulatory impacts, such as those related to sustainability and product safety, are increasingly significant. Product substitutes, such as second-hand furniture and rental services, present growing competition. End-user segmentation is diverse, encompassing individual consumers, property developers, and the hospitality sector.
- Market Concentration: HHI estimated at XX in 2025.
- Innovation Drivers: Smart home technology integration, sustainable materials, and improved design aesthetics.
- Regulatory Impacts: Emphasis on sustainability, safety standards, and fair trading practices.
- Product Substitutes: Second-hand markets, rental platforms, and DIY options.
- End-User Segmentation: Individual consumers, property developers, hospitality, and commercial sectors.
- M&A Trends: A moderate level of mergers and acquisitions, with a notable increase in activity in 2022, demonstrated by Victoria PLC’s acquisitions. The total value of M&A transactions between 2019 and 2024 is estimated at £XX Billion.
UK Homeware Industry Market Trends & Opportunities
The UK homeware market is experiencing robust and consistent growth, propelled by a confluence of influential factors. The market's value has seen substantial expansion, projected to grow from an estimated £XX Billion in 2019 to £XX Billion by 2025, reflecting a compound annual growth rate (CAGR) of XX%. This expansion is significantly shaped by technological advancements, most notably the ever-increasing dominance of online retail channels and the burgeoning interest in smart home devices, which are fundamentally reshaping how consumers interact with and purchase homeware. Concurrently, consumer expectations are undergoing a transformation, with a heightened emphasis on sustainability, value for money, and bespoke, personalized products. The competitive landscape remains dynamic and fiercely contested, with both long-standing industry leaders and agile new entrants actively pursuing market share. The penetration of online sales within the homeware sector is anticipated to reach an impressive XX% by 2033, heralding substantial growth prospects for e-commerce platforms. Furthermore, a persistent surge in demand for home improvement and renovation projects, amplified by evolving post-pandemic lifestyle priorities, is a key contributor to this ongoing market expansion.
Dominant Markets & Segments in UK Homeware Industry
The London region currently dominates the UK homeware market, driven by high population density, affluence, and a strong demand for high-quality home furnishings. Among product segments, Home Furniture and Home Appliances are the largest, accounting for approximately XX% and XX% of market share, respectively. Online distribution channels are showing the fastest growth, fueled by changing consumer behavior and technological advancements.
- Leading Region: London
- Leading Product Segments: Home Furniture, Home Appliances
- Fastest Growing Distribution Channel: Online Distribution Channels
Key Growth Drivers:
- Increased Disposable Incomes: Rising disposable incomes, particularly in the affluent regions of the UK, are boosting demand for higher-end homeware products.
- Home Improvement Trends: The post-pandemic increase in home improvements and renovations has significantly increased the demand for homeware products.
- E-commerce Expansion: The rapid growth of e-commerce platforms and online marketplaces is creating greater accessibility to homeware products, driving market expansion.
- Government Initiatives: Government initiatives promoting sustainable building practices and energy efficiency are indirectly contributing to increased demand for eco-friendly and energy-efficient homeware.
UK Homeware Industry Product Analysis
Innovation within the UK homeware sector is intrinsically linked to the rapid pace of technological evolution and the shifting tides of consumer desires. The integration of smart home technology is a prominent trend, with products now offering sophisticated functionalities and unparalleled convenience. Ethical considerations are also at the forefront, with a significant increase in the demand for products crafted from sustainable and responsibly sourced materials, a direct reflection of heightened consumer environmental consciousness. To carve out a competitive edge, businesses are actively pursuing innovative design aesthetics and delivering highly personalized customer experiences. Moreover, the market is witnessing a pronounced shift towards versatile, multi-functional items and space-saving solutions, specifically designed to address the needs of contemporary living in more compact domestic environments.
Key Drivers, Barriers & Challenges in UK Homeware Industry
Key Drivers:
The primary catalysts propelling the UK homeware industry include transformative technological advancements, such as the widespread adoption of smart home devices, a general increase in consumer disposable incomes, and a sustained and growing interest in enhancing and renovating domestic spaces.
Key Challenges and Restraints:
Significant obstacles to growth include ongoing supply chain disruptions, which contribute to escalating costs and delivery delays. Brexit-related uncertainties continue to pose challenges, alongside intensely competitive market conditions. The collective impact of these factors is estimated to temper annual market growth by approximately XX% over the next five years.
Growth Drivers in the UK Homeware Industry Market
Rising disposable incomes, changing lifestyle preferences (favouring home-centric activities), and technological advancements are key growth drivers. Government policies promoting home improvements and sustainable living also contribute positively.
Challenges Impacting UK Homeware Industry Growth
The sustained growth trajectory of the UK homeware industry faces considerable headwinds. Key challenges include the inherent vulnerabilities within global supply chains, the volatility of raw material prices, intensified competition from agile online retailers, and the potential adverse effects of economic downturns.
Key Players Shaping the UK Homeware Industry Market
- Inter IKEA Group
- Kitchen Craft
- Bosch Group
- Cuisinart
- Dyson
- Milliken
- Bed Bath and Beyond UK
- DFS Furniture PLC
- Koninklijke Philips NV
- Villeroy and Boch
- Victoria PLC
- Wayfair UK
- Gerflor
Significant UK Homeware Industry Industry Milestones
- October 2022: Victoria PLC acquired International Wholesale Tile LLC (IWT), expanding its presence in the US flooring market.
- February 2022: Victoria PLC acquired B3 Ceramics Danismanlik (Graniser), strengthening its position in the ceramic tile sector.
Future Outlook for UK Homeware Industry Market
The UK homeware industry is poised for continued growth, driven by sustained consumer demand, technological innovation, and expanding e-commerce channels. Strategic opportunities lie in personalized products, sustainable materials, and smart home integrations. The market is expected to see a sustained CAGR of XX% during the forecast period (2025-2033), reaching a projected value of £XX Billion by 2033.
UK Homeware Industry Segmentation
-
1. Product
- 1.1. Home Furniture
- 1.2. Home Textiles
- 1.3. Home Appliances
- 1.4. Floor Covering Products
- 1.5. Home Décor Products
- 1.6. Other Pr
-
2. Distribution Channel
- 2.1. Supermarket and Hypermarkets
- 2.2. Specialty Stores
- 2.3. Online Distribution Channels
- 2.4. Other Distribution Channels
UK Homeware Industry Segmentation By Geography
-
1. North America
- 1.1. United States
- 1.2. Canada
- 1.3. Mexico
-
2. South America
- 2.1. Brazil
- 2.2. Argentina
- 2.3. Rest of South America
-
3. Europe
- 3.1. United Kingdom
- 3.2. Germany
- 3.3. France
- 3.4. Italy
- 3.5. Spain
- 3.6. Russia
- 3.7. Benelux
- 3.8. Nordics
- 3.9. Rest of Europe
-
4. Middle East & Africa
- 4.1. Turkey
- 4.2. Israel
- 4.3. GCC
- 4.4. North Africa
- 4.5. South Africa
- 4.6. Rest of Middle East & Africa
-
5. Asia Pacific
- 5.1. China
- 5.2. India
- 5.3. Japan
- 5.4. South Korea
- 5.5. ASEAN
- 5.6. Oceania
- 5.7. Rest of Asia Pacific
UK Homeware Industry Regional Market Share
Geographic Coverage of UK Homeware Industry
UK Homeware Industry REPORT HIGHLIGHTS
| Aspects | Details |
|---|---|
| Study Period | 2020-2034 |
| Base Year | 2025 |
| Estimated Year | 2026 |
| Forecast Period | 2026-2034 |
| Historical Period | 2020-2025 |
| Growth Rate | CAGR of 4.17% from 2020-2034 |
| Segmentation |
|
Table of Contents
- 1. Introduction
- 1.1. Research Scope
- 1.2. Market Segmentation
- 1.3. Research Objective
- 1.4. Definitions and Assumptions
- 2. Executive Summary
- 2.1. Market Snapshot
- 3. Market Dynamics
- 3.1. Market Drivers
- 3.2. Market Restrains
- 3.3. Market Trends
- 3.4. Market Opportunities
- 4. Market Factor Analysis
- 4.1. Porters Five Forces
- 4.1.1. Bargaining Power of Suppliers
- 4.1.2. Bargaining Power of Buyers
- 4.1.3. Threat of New Entrants
- 4.1.4. Threat of Substitutes
- 4.1.5. Competitive Rivalry
- 4.2. PESTEL analysis
- 4.3. BCG Analysis
- 4.3.1. Stars (High Growth, High Market Share)
- 4.3.2. Cash Cows (Low Growth, High Market Share)
- 4.3.3. Question Mark (High Growth, Low Market Share)
- 4.3.4. Dogs (Low Growth, Low Market Share)
- 4.4. Ansoff Matrix Analysis
- 4.5. Supply Chain Analysis
- 4.6. Regulatory Landscape
- 4.7. Current Market Potential and Opportunity Assessment (TAM–SAM–SOM Framework)
- 4.8. TIR Analyst Note
- 4.1. Porters Five Forces
- 5. Market Analysis, Insights and Forecast 2021-2033
- 5.1. Market Analysis, Insights and Forecast - by Product
- 5.1.1. Home Furniture
- 5.1.2. Home Textiles
- 5.1.3. Home Appliances
- 5.1.4. Floor Covering Products
- 5.1.5. Home Décor Products
- 5.1.6. Other Pr
- 5.2. Market Analysis, Insights and Forecast - by Distribution Channel
- 5.2.1. Supermarket and Hypermarkets
- 5.2.2. Specialty Stores
- 5.2.3. Online Distribution Channels
- 5.2.4. Other Distribution Channels
- 5.3. Market Analysis, Insights and Forecast - by Region
- 5.3.1. North America
- 5.3.2. South America
- 5.3.3. Europe
- 5.3.4. Middle East & Africa
- 5.3.5. Asia Pacific
- 5.1. Market Analysis, Insights and Forecast - by Product
- 6. Global UK Homeware Industry Analysis, Insights and Forecast, 2021-2033
- 6.1. Market Analysis, Insights and Forecast - by Product
- 6.1.1. Home Furniture
- 6.1.2. Home Textiles
- 6.1.3. Home Appliances
- 6.1.4. Floor Covering Products
- 6.1.5. Home Décor Products
- 6.1.6. Other Pr
- 6.2. Market Analysis, Insights and Forecast - by Distribution Channel
- 6.2.1. Supermarket and Hypermarkets
- 6.2.2. Specialty Stores
- 6.2.3. Online Distribution Channels
- 6.2.4. Other Distribution Channels
- 6.1. Market Analysis, Insights and Forecast - by Product
- 7. North America UK Homeware Industry Analysis, Insights and Forecast, 2020-2032
- 7.1. Market Analysis, Insights and Forecast - by Product
- 7.1.1. Home Furniture
- 7.1.2. Home Textiles
- 7.1.3. Home Appliances
- 7.1.4. Floor Covering Products
- 7.1.5. Home Décor Products
- 7.1.6. Other Pr
- 7.2. Market Analysis, Insights and Forecast - by Distribution Channel
- 7.2.1. Supermarket and Hypermarkets
- 7.2.2. Specialty Stores
- 7.2.3. Online Distribution Channels
- 7.2.4. Other Distribution Channels
- 7.1. Market Analysis, Insights and Forecast - by Product
- 8. South America UK Homeware Industry Analysis, Insights and Forecast, 2020-2032
- 8.1. Market Analysis, Insights and Forecast - by Product
- 8.1.1. Home Furniture
- 8.1.2. Home Textiles
- 8.1.3. Home Appliances
- 8.1.4. Floor Covering Products
- 8.1.5. Home Décor Products
- 8.1.6. Other Pr
- 8.2. Market Analysis, Insights and Forecast - by Distribution Channel
- 8.2.1. Supermarket and Hypermarkets
- 8.2.2. Specialty Stores
- 8.2.3. Online Distribution Channels
- 8.2.4. Other Distribution Channels
- 8.1. Market Analysis, Insights and Forecast - by Product
- 9. Europe UK Homeware Industry Analysis, Insights and Forecast, 2020-2032
- 9.1. Market Analysis, Insights and Forecast - by Product
- 9.1.1. Home Furniture
- 9.1.2. Home Textiles
- 9.1.3. Home Appliances
- 9.1.4. Floor Covering Products
- 9.1.5. Home Décor Products
- 9.1.6. Other Pr
- 9.2. Market Analysis, Insights and Forecast - by Distribution Channel
- 9.2.1. Supermarket and Hypermarkets
- 9.2.2. Specialty Stores
- 9.2.3. Online Distribution Channels
- 9.2.4. Other Distribution Channels
- 9.1. Market Analysis, Insights and Forecast - by Product
- 10. Middle East & Africa UK Homeware Industry Analysis, Insights and Forecast, 2020-2032
- 10.1. Market Analysis, Insights and Forecast - by Product
- 10.1.1. Home Furniture
- 10.1.2. Home Textiles
- 10.1.3. Home Appliances
- 10.1.4. Floor Covering Products
- 10.1.5. Home Décor Products
- 10.1.6. Other Pr
- 10.2. Market Analysis, Insights and Forecast - by Distribution Channel
- 10.2.1. Supermarket and Hypermarkets
- 10.2.2. Specialty Stores
- 10.2.3. Online Distribution Channels
- 10.2.4. Other Distribution Channels
- 10.1. Market Analysis, Insights and Forecast - by Product
- 11. Asia Pacific UK Homeware Industry Analysis, Insights and Forecast, 2020-2032
- 11.1. Market Analysis, Insights and Forecast - by Product
- 11.1.1. Home Furniture
- 11.1.2. Home Textiles
- 11.1.3. Home Appliances
- 11.1.4. Floor Covering Products
- 11.1.5. Home Décor Products
- 11.1.6. Other Pr
- 11.2. Market Analysis, Insights and Forecast - by Distribution Channel
- 11.2.1. Supermarket and Hypermarkets
- 11.2.2. Specialty Stores
- 11.2.3. Online Distribution Channels
- 11.2.4. Other Distribution Channels
- 11.1. Market Analysis, Insights and Forecast - by Product
- 12. Competitive Analysis
- 12.1. Company Profiles
- 12.1.1 Inter IKEA Group
- 12.1.1.1. Company Overview
- 12.1.1.2. Products
- 12.1.1.3. Company Financials
- 12.1.1.4. SWOT Analysis
- 12.1.2 Kitchen Craft
- 12.1.2.1. Company Overview
- 12.1.2.2. Products
- 12.1.2.3. Company Financials
- 12.1.2.4. SWOT Analysis
- 12.1.3 Bosch Group
- 12.1.3.1. Company Overview
- 12.1.3.2. Products
- 12.1.3.3. Company Financials
- 12.1.3.4. SWOT Analysis
- 12.1.4 Cuisinart
- 12.1.4.1. Company Overview
- 12.1.4.2. Products
- 12.1.4.3. Company Financials
- 12.1.4.4. SWOT Analysis
- 12.1.5 Dyson
- 12.1.5.1. Company Overview
- 12.1.5.2. Products
- 12.1.5.3. Company Financials
- 12.1.5.4. SWOT Analysis
- 12.1.6 Milliken
- 12.1.6.1. Company Overview
- 12.1.6.2. Products
- 12.1.6.3. Company Financials
- 12.1.6.4. SWOT Analysis
- 12.1.7 Bed Bath and Beyond UK
- 12.1.7.1. Company Overview
- 12.1.7.2. Products
- 12.1.7.3. Company Financials
- 12.1.7.4. SWOT Analysis
- 12.1.8 DFS Furniture PLC
- 12.1.8.1. Company Overview
- 12.1.8.2. Products
- 12.1.8.3. Company Financials
- 12.1.8.4. SWOT Analysis
- 12.1.9 Koninklijke Philips NV
- 12.1.9.1. Company Overview
- 12.1.9.2. Products
- 12.1.9.3. Company Financials
- 12.1.9.4. SWOT Analysis
- 12.1.10 Villeroy and Boch
- 12.1.10.1. Company Overview
- 12.1.10.2. Products
- 12.1.10.3. Company Financials
- 12.1.10.4. SWOT Analysis
- 12.1.11 Victoria PLC
- 12.1.11.1. Company Overview
- 12.1.11.2. Products
- 12.1.11.3. Company Financials
- 12.1.11.4. SWOT Analysis
- 12.1.12 Way Fair UK
- 12.1.12.1. Company Overview
- 12.1.12.2. Products
- 12.1.12.3. Company Financials
- 12.1.12.4. SWOT Analysis
- 12.1.13 Victoria PLC
- 12.1.13.1. Company Overview
- 12.1.13.2. Products
- 12.1.13.3. Company Financials
- 12.1.13.4. SWOT Analysis
- 12.1.14 Gerflor
- 12.1.14.1. Company Overview
- 12.1.14.2. Products
- 12.1.14.3. Company Financials
- 12.1.14.4. SWOT Analysis
- 12.1.1 Inter IKEA Group
- 12.2. Market Entropy
- 12.2.1 Company's Key Areas Served
- 12.2.2 Recent Developments
- 12.3. Company Market Share Analysis 2025
- 12.3.1 Top 5 Companies Market Share Analysis
- 12.3.2 Top 3 Companies Market Share Analysis
- 12.4. List of Potential Customers
- 13. Research Methodology
List of Figures
- Figure 1: Global UK Homeware Industry Revenue Breakdown (Million, %) by Region 2025 & 2033
- Figure 2: Global UK Homeware Industry Volume Breakdown (K Unit, %) by Region 2025 & 2033
- Figure 3: North America UK Homeware Industry Revenue (Million), by Product 2025 & 2033
- Figure 4: North America UK Homeware Industry Volume (K Unit), by Product 2025 & 2033
- Figure 5: North America UK Homeware Industry Revenue Share (%), by Product 2025 & 2033
- Figure 6: North America UK Homeware Industry Volume Share (%), by Product 2025 & 2033
- Figure 7: North America UK Homeware Industry Revenue (Million), by Distribution Channel 2025 & 2033
- Figure 8: North America UK Homeware Industry Volume (K Unit), by Distribution Channel 2025 & 2033
- Figure 9: North America UK Homeware Industry Revenue Share (%), by Distribution Channel 2025 & 2033
- Figure 10: North America UK Homeware Industry Volume Share (%), by Distribution Channel 2025 & 2033
- Figure 11: North America UK Homeware Industry Revenue (Million), by Country 2025 & 2033
- Figure 12: North America UK Homeware Industry Volume (K Unit), by Country 2025 & 2033
- Figure 13: North America UK Homeware Industry Revenue Share (%), by Country 2025 & 2033
- Figure 14: North America UK Homeware Industry Volume Share (%), by Country 2025 & 2033
- Figure 15: South America UK Homeware Industry Revenue (Million), by Product 2025 & 2033
- Figure 16: South America UK Homeware Industry Volume (K Unit), by Product 2025 & 2033
- Figure 17: South America UK Homeware Industry Revenue Share (%), by Product 2025 & 2033
- Figure 18: South America UK Homeware Industry Volume Share (%), by Product 2025 & 2033
- Figure 19: South America UK Homeware Industry Revenue (Million), by Distribution Channel 2025 & 2033
- Figure 20: South America UK Homeware Industry Volume (K Unit), by Distribution Channel 2025 & 2033
- Figure 21: South America UK Homeware Industry Revenue Share (%), by Distribution Channel 2025 & 2033
- Figure 22: South America UK Homeware Industry Volume Share (%), by Distribution Channel 2025 & 2033
- Figure 23: South America UK Homeware Industry Revenue (Million), by Country 2025 & 2033
- Figure 24: South America UK Homeware Industry Volume (K Unit), by Country 2025 & 2033
- Figure 25: South America UK Homeware Industry Revenue Share (%), by Country 2025 & 2033
- Figure 26: South America UK Homeware Industry Volume Share (%), by Country 2025 & 2033
- Figure 27: Europe UK Homeware Industry Revenue (Million), by Product 2025 & 2033
- Figure 28: Europe UK Homeware Industry Volume (K Unit), by Product 2025 & 2033
- Figure 29: Europe UK Homeware Industry Revenue Share (%), by Product 2025 & 2033
- Figure 30: Europe UK Homeware Industry Volume Share (%), by Product 2025 & 2033
- Figure 31: Europe UK Homeware Industry Revenue (Million), by Distribution Channel 2025 & 2033
- Figure 32: Europe UK Homeware Industry Volume (K Unit), by Distribution Channel 2025 & 2033
- Figure 33: Europe UK Homeware Industry Revenue Share (%), by Distribution Channel 2025 & 2033
- Figure 34: Europe UK Homeware Industry Volume Share (%), by Distribution Channel 2025 & 2033
- Figure 35: Europe UK Homeware Industry Revenue (Million), by Country 2025 & 2033
- Figure 36: Europe UK Homeware Industry Volume (K Unit), by Country 2025 & 2033
- Figure 37: Europe UK Homeware Industry Revenue Share (%), by Country 2025 & 2033
- Figure 38: Europe UK Homeware Industry Volume Share (%), by Country 2025 & 2033
- Figure 39: Middle East & Africa UK Homeware Industry Revenue (Million), by Product 2025 & 2033
- Figure 40: Middle East & Africa UK Homeware Industry Volume (K Unit), by Product 2025 & 2033
- Figure 41: Middle East & Africa UK Homeware Industry Revenue Share (%), by Product 2025 & 2033
- Figure 42: Middle East & Africa UK Homeware Industry Volume Share (%), by Product 2025 & 2033
- Figure 43: Middle East & Africa UK Homeware Industry Revenue (Million), by Distribution Channel 2025 & 2033
- Figure 44: Middle East & Africa UK Homeware Industry Volume (K Unit), by Distribution Channel 2025 & 2033
- Figure 45: Middle East & Africa UK Homeware Industry Revenue Share (%), by Distribution Channel 2025 & 2033
- Figure 46: Middle East & Africa UK Homeware Industry Volume Share (%), by Distribution Channel 2025 & 2033
- Figure 47: Middle East & Africa UK Homeware Industry Revenue (Million), by Country 2025 & 2033
- Figure 48: Middle East & Africa UK Homeware Industry Volume (K Unit), by Country 2025 & 2033
- Figure 49: Middle East & Africa UK Homeware Industry Revenue Share (%), by Country 2025 & 2033
- Figure 50: Middle East & Africa UK Homeware Industry Volume Share (%), by Country 2025 & 2033
- Figure 51: Asia Pacific UK Homeware Industry Revenue (Million), by Product 2025 & 2033
- Figure 52: Asia Pacific UK Homeware Industry Volume (K Unit), by Product 2025 & 2033
- Figure 53: Asia Pacific UK Homeware Industry Revenue Share (%), by Product 2025 & 2033
- Figure 54: Asia Pacific UK Homeware Industry Volume Share (%), by Product 2025 & 2033
- Figure 55: Asia Pacific UK Homeware Industry Revenue (Million), by Distribution Channel 2025 & 2033
- Figure 56: Asia Pacific UK Homeware Industry Volume (K Unit), by Distribution Channel 2025 & 2033
- Figure 57: Asia Pacific UK Homeware Industry Revenue Share (%), by Distribution Channel 2025 & 2033
- Figure 58: Asia Pacific UK Homeware Industry Volume Share (%), by Distribution Channel 2025 & 2033
- Figure 59: Asia Pacific UK Homeware Industry Revenue (Million), by Country 2025 & 2033
- Figure 60: Asia Pacific UK Homeware Industry Volume (K Unit), by Country 2025 & 2033
- Figure 61: Asia Pacific UK Homeware Industry Revenue Share (%), by Country 2025 & 2033
- Figure 62: Asia Pacific UK Homeware Industry Volume Share (%), by Country 2025 & 2033
List of Tables
- Table 1: Global UK Homeware Industry Revenue Million Forecast, by Product 2020 & 2033
- Table 2: Global UK Homeware Industry Volume K Unit Forecast, by Product 2020 & 2033
- Table 3: Global UK Homeware Industry Revenue Million Forecast, by Distribution Channel 2020 & 2033
- Table 4: Global UK Homeware Industry Volume K Unit Forecast, by Distribution Channel 2020 & 2033
- Table 5: Global UK Homeware Industry Revenue Million Forecast, by Region 2020 & 2033
- Table 6: Global UK Homeware Industry Volume K Unit Forecast, by Region 2020 & 2033
- Table 7: Global UK Homeware Industry Revenue Million Forecast, by Product 2020 & 2033
- Table 8: Global UK Homeware Industry Volume K Unit Forecast, by Product 2020 & 2033
- Table 9: Global UK Homeware Industry Revenue Million Forecast, by Distribution Channel 2020 & 2033
- Table 10: Global UK Homeware Industry Volume K Unit Forecast, by Distribution Channel 2020 & 2033
- Table 11: Global UK Homeware Industry Revenue Million Forecast, by Country 2020 & 2033
- Table 12: Global UK Homeware Industry Volume K Unit Forecast, by Country 2020 & 2033
- Table 13: United States UK Homeware Industry Revenue (Million) Forecast, by Application 2020 & 2033
- Table 14: United States UK Homeware Industry Volume (K Unit) Forecast, by Application 2020 & 2033
- Table 15: Canada UK Homeware Industry Revenue (Million) Forecast, by Application 2020 & 2033
- Table 16: Canada UK Homeware Industry Volume (K Unit) Forecast, by Application 2020 & 2033
- Table 17: Mexico UK Homeware Industry Revenue (Million) Forecast, by Application 2020 & 2033
- Table 18: Mexico UK Homeware Industry Volume (K Unit) Forecast, by Application 2020 & 2033
- Table 19: Global UK Homeware Industry Revenue Million Forecast, by Product 2020 & 2033
- Table 20: Global UK Homeware Industry Volume K Unit Forecast, by Product 2020 & 2033
- Table 21: Global UK Homeware Industry Revenue Million Forecast, by Distribution Channel 2020 & 2033
- Table 22: Global UK Homeware Industry Volume K Unit Forecast, by Distribution Channel 2020 & 2033
- Table 23: Global UK Homeware Industry Revenue Million Forecast, by Country 2020 & 2033
- Table 24: Global UK Homeware Industry Volume K Unit Forecast, by Country 2020 & 2033
- Table 25: Brazil UK Homeware Industry Revenue (Million) Forecast, by Application 2020 & 2033
- Table 26: Brazil UK Homeware Industry Volume (K Unit) Forecast, by Application 2020 & 2033
- Table 27: Argentina UK Homeware Industry Revenue (Million) Forecast, by Application 2020 & 2033
- Table 28: Argentina UK Homeware Industry Volume (K Unit) Forecast, by Application 2020 & 2033
- Table 29: Rest of South America UK Homeware Industry Revenue (Million) Forecast, by Application 2020 & 2033
- Table 30: Rest of South America UK Homeware Industry Volume (K Unit) Forecast, by Application 2020 & 2033
- Table 31: Global UK Homeware Industry Revenue Million Forecast, by Product 2020 & 2033
- Table 32: Global UK Homeware Industry Volume K Unit Forecast, by Product 2020 & 2033
- Table 33: Global UK Homeware Industry Revenue Million Forecast, by Distribution Channel 2020 & 2033
- Table 34: Global UK Homeware Industry Volume K Unit Forecast, by Distribution Channel 2020 & 2033
- Table 35: Global UK Homeware Industry Revenue Million Forecast, by Country 2020 & 2033
- Table 36: Global UK Homeware Industry Volume K Unit Forecast, by Country 2020 & 2033
- Table 37: United Kingdom UK Homeware Industry Revenue (Million) Forecast, by Application 2020 & 2033
- Table 38: United Kingdom UK Homeware Industry Volume (K Unit) Forecast, by Application 2020 & 2033
- Table 39: Germany UK Homeware Industry Revenue (Million) Forecast, by Application 2020 & 2033
- Table 40: Germany UK Homeware Industry Volume (K Unit) Forecast, by Application 2020 & 2033
- Table 41: France UK Homeware Industry Revenue (Million) Forecast, by Application 2020 & 2033
- Table 42: France UK Homeware Industry Volume (K Unit) Forecast, by Application 2020 & 2033
- Table 43: Italy UK Homeware Industry Revenue (Million) Forecast, by Application 2020 & 2033
- Table 44: Italy UK Homeware Industry Volume (K Unit) Forecast, by Application 2020 & 2033
- Table 45: Spain UK Homeware Industry Revenue (Million) Forecast, by Application 2020 & 2033
- Table 46: Spain UK Homeware Industry Volume (K Unit) Forecast, by Application 2020 & 2033
- Table 47: Russia UK Homeware Industry Revenue (Million) Forecast, by Application 2020 & 2033
- Table 48: Russia UK Homeware Industry Volume (K Unit) Forecast, by Application 2020 & 2033
- Table 49: Benelux UK Homeware Industry Revenue (Million) Forecast, by Application 2020 & 2033
- Table 50: Benelux UK Homeware Industry Volume (K Unit) Forecast, by Application 2020 & 2033
- Table 51: Nordics UK Homeware Industry Revenue (Million) Forecast, by Application 2020 & 2033
- Table 52: Nordics UK Homeware Industry Volume (K Unit) Forecast, by Application 2020 & 2033
- Table 53: Rest of Europe UK Homeware Industry Revenue (Million) Forecast, by Application 2020 & 2033
- Table 54: Rest of Europe UK Homeware Industry Volume (K Unit) Forecast, by Application 2020 & 2033
- Table 55: Global UK Homeware Industry Revenue Million Forecast, by Product 2020 & 2033
- Table 56: Global UK Homeware Industry Volume K Unit Forecast, by Product 2020 & 2033
- Table 57: Global UK Homeware Industry Revenue Million Forecast, by Distribution Channel 2020 & 2033
- Table 58: Global UK Homeware Industry Volume K Unit Forecast, by Distribution Channel 2020 & 2033
- Table 59: Global UK Homeware Industry Revenue Million Forecast, by Country 2020 & 2033
- Table 60: Global UK Homeware Industry Volume K Unit Forecast, by Country 2020 & 2033
- Table 61: Turkey UK Homeware Industry Revenue (Million) Forecast, by Application 2020 & 2033
- Table 62: Turkey UK Homeware Industry Volume (K Unit) Forecast, by Application 2020 & 2033
- Table 63: Israel UK Homeware Industry Revenue (Million) Forecast, by Application 2020 & 2033
- Table 64: Israel UK Homeware Industry Volume (K Unit) Forecast, by Application 2020 & 2033
- Table 65: GCC UK Homeware Industry Revenue (Million) Forecast, by Application 2020 & 2033
- Table 66: GCC UK Homeware Industry Volume (K Unit) Forecast, by Application 2020 & 2033
- Table 67: North Africa UK Homeware Industry Revenue (Million) Forecast, by Application 2020 & 2033
- Table 68: North Africa UK Homeware Industry Volume (K Unit) Forecast, by Application 2020 & 2033
- Table 69: South Africa UK Homeware Industry Revenue (Million) Forecast, by Application 2020 & 2033
- Table 70: South Africa UK Homeware Industry Volume (K Unit) Forecast, by Application 2020 & 2033
- Table 71: Rest of Middle East & Africa UK Homeware Industry Revenue (Million) Forecast, by Application 2020 & 2033
- Table 72: Rest of Middle East & Africa UK Homeware Industry Volume (K Unit) Forecast, by Application 2020 & 2033
- Table 73: Global UK Homeware Industry Revenue Million Forecast, by Product 2020 & 2033
- Table 74: Global UK Homeware Industry Volume K Unit Forecast, by Product 2020 & 2033
- Table 75: Global UK Homeware Industry Revenue Million Forecast, by Distribution Channel 2020 & 2033
- Table 76: Global UK Homeware Industry Volume K Unit Forecast, by Distribution Channel 2020 & 2033
- Table 77: Global UK Homeware Industry Revenue Million Forecast, by Country 2020 & 2033
- Table 78: Global UK Homeware Industry Volume K Unit Forecast, by Country 2020 & 2033
- Table 79: China UK Homeware Industry Revenue (Million) Forecast, by Application 2020 & 2033
- Table 80: China UK Homeware Industry Volume (K Unit) Forecast, by Application 2020 & 2033
- Table 81: India UK Homeware Industry Revenue (Million) Forecast, by Application 2020 & 2033
- Table 82: India UK Homeware Industry Volume (K Unit) Forecast, by Application 2020 & 2033
- Table 83: Japan UK Homeware Industry Revenue (Million) Forecast, by Application 2020 & 2033
- Table 84: Japan UK Homeware Industry Volume (K Unit) Forecast, by Application 2020 & 2033
- Table 85: South Korea UK Homeware Industry Revenue (Million) Forecast, by Application 2020 & 2033
- Table 86: South Korea UK Homeware Industry Volume (K Unit) Forecast, by Application 2020 & 2033
- Table 87: ASEAN UK Homeware Industry Revenue (Million) Forecast, by Application 2020 & 2033
- Table 88: ASEAN UK Homeware Industry Volume (K Unit) Forecast, by Application 2020 & 2033
- Table 89: Oceania UK Homeware Industry Revenue (Million) Forecast, by Application 2020 & 2033
- Table 90: Oceania UK Homeware Industry Volume (K Unit) Forecast, by Application 2020 & 2033
- Table 91: Rest of Asia Pacific UK Homeware Industry Revenue (Million) Forecast, by Application 2020 & 2033
- Table 92: Rest of Asia Pacific UK Homeware Industry Volume (K Unit) Forecast, by Application 2020 & 2033
Frequently Asked Questions
1. What is the projected Compound Annual Growth Rate (CAGR) of the UK Homeware Industry?
The projected CAGR is approximately 4.17%.
2. Which companies are prominent players in the UK Homeware Industry?
Key companies in the market include Inter IKEA Group, Kitchen Craft, Bosch Group, Cuisinart, Dyson, Milliken, Bed Bath and Beyond UK, DFS Furniture PLC, Koninklijke Philips NV, Villeroy and Boch, Victoria PLC, Way Fair UK, Victoria PLC, Gerflor.
3. What are the main segments of the UK Homeware Industry?
The market segments include Product, Distribution Channel.
4. Can you provide details about the market size?
The market size is estimated to be USD 21.20 Million as of 2022.
5. What are some drivers contributing to market growth?
Increase in Restaurants and Food Chains globally; Rise in the share of people opting for vegan and vegetarian foods.
6. What are the notable trends driving market growth?
Increased Spending on Furniture and Appliances is Driving the Market's Growth.
7. Are there any restraints impacting market growth?
Rise in price of electric appliances globally; Rising inflation decreasing the purchasing power.
8. Can you provide examples of recent developments in the market?
October 2022: Victoria PLC, the United Kingdom-based flooring designer, manufacturer, and distributor, announced the acquisition of Florida-based International Wholesale Tile LLC (IWT).
9. What pricing options are available for accessing the report?
Pricing options include single-user, multi-user, and enterprise licenses priced at USD 3800, USD 4500, and USD 5800 respectively.
10. Is the market size provided in terms of value or volume?
The market size is provided in terms of value, measured in Million and volume, measured in K Unit.
11. Are there any specific market keywords associated with the report?
Yes, the market keyword associated with the report is "UK Homeware Industry," which aids in identifying and referencing the specific market segment covered.
12. How do I determine which pricing option suits my needs best?
The pricing options vary based on user requirements and access needs. Individual users may opt for single-user licenses, while businesses requiring broader access may choose multi-user or enterprise licenses for cost-effective access to the report.
13. Are there any additional resources or data provided in the UK Homeware Industry report?
While the report offers comprehensive insights, it's advisable to review the specific contents or supplementary materials provided to ascertain if additional resources or data are available.
14. How can I stay updated on further developments or reports in the UK Homeware Industry?
To stay informed about further developments, trends, and reports in the UK Homeware Industry, consider subscribing to industry newsletters, following relevant companies and organizations, or regularly checking reputable industry news sources and publications.
Methodology
Step 1 - Identification of Relevant Samples Size from Population Database


Step 2 - Approaches for Defining Global Market Size (Value, Volume* & Price*)

Note*: In applicable scenarios
Step 3 - Data Sources
Primary Research
- Web Analytics
- Survey Reports
- Research Institute
- Latest Research Reports
- Opinion Leaders
Secondary Research
- Annual Reports
- White Paper
- Latest Press Release
- Industry Association
- Paid Database
- Investor Presentations

Step 4 - Data Triangulation
Involves using different sources of information in order to increase the validity of a study
These sources are likely to be stakeholders in a program - participants, other researchers, program staff, other community members, and so on.
Then we put all data in single framework & apply various statistical tools to find out the dynamic on the market.
During the analysis stage, feedback from the stakeholder groups would be compared to determine areas of agreement as well as areas of divergence