

Key Insights
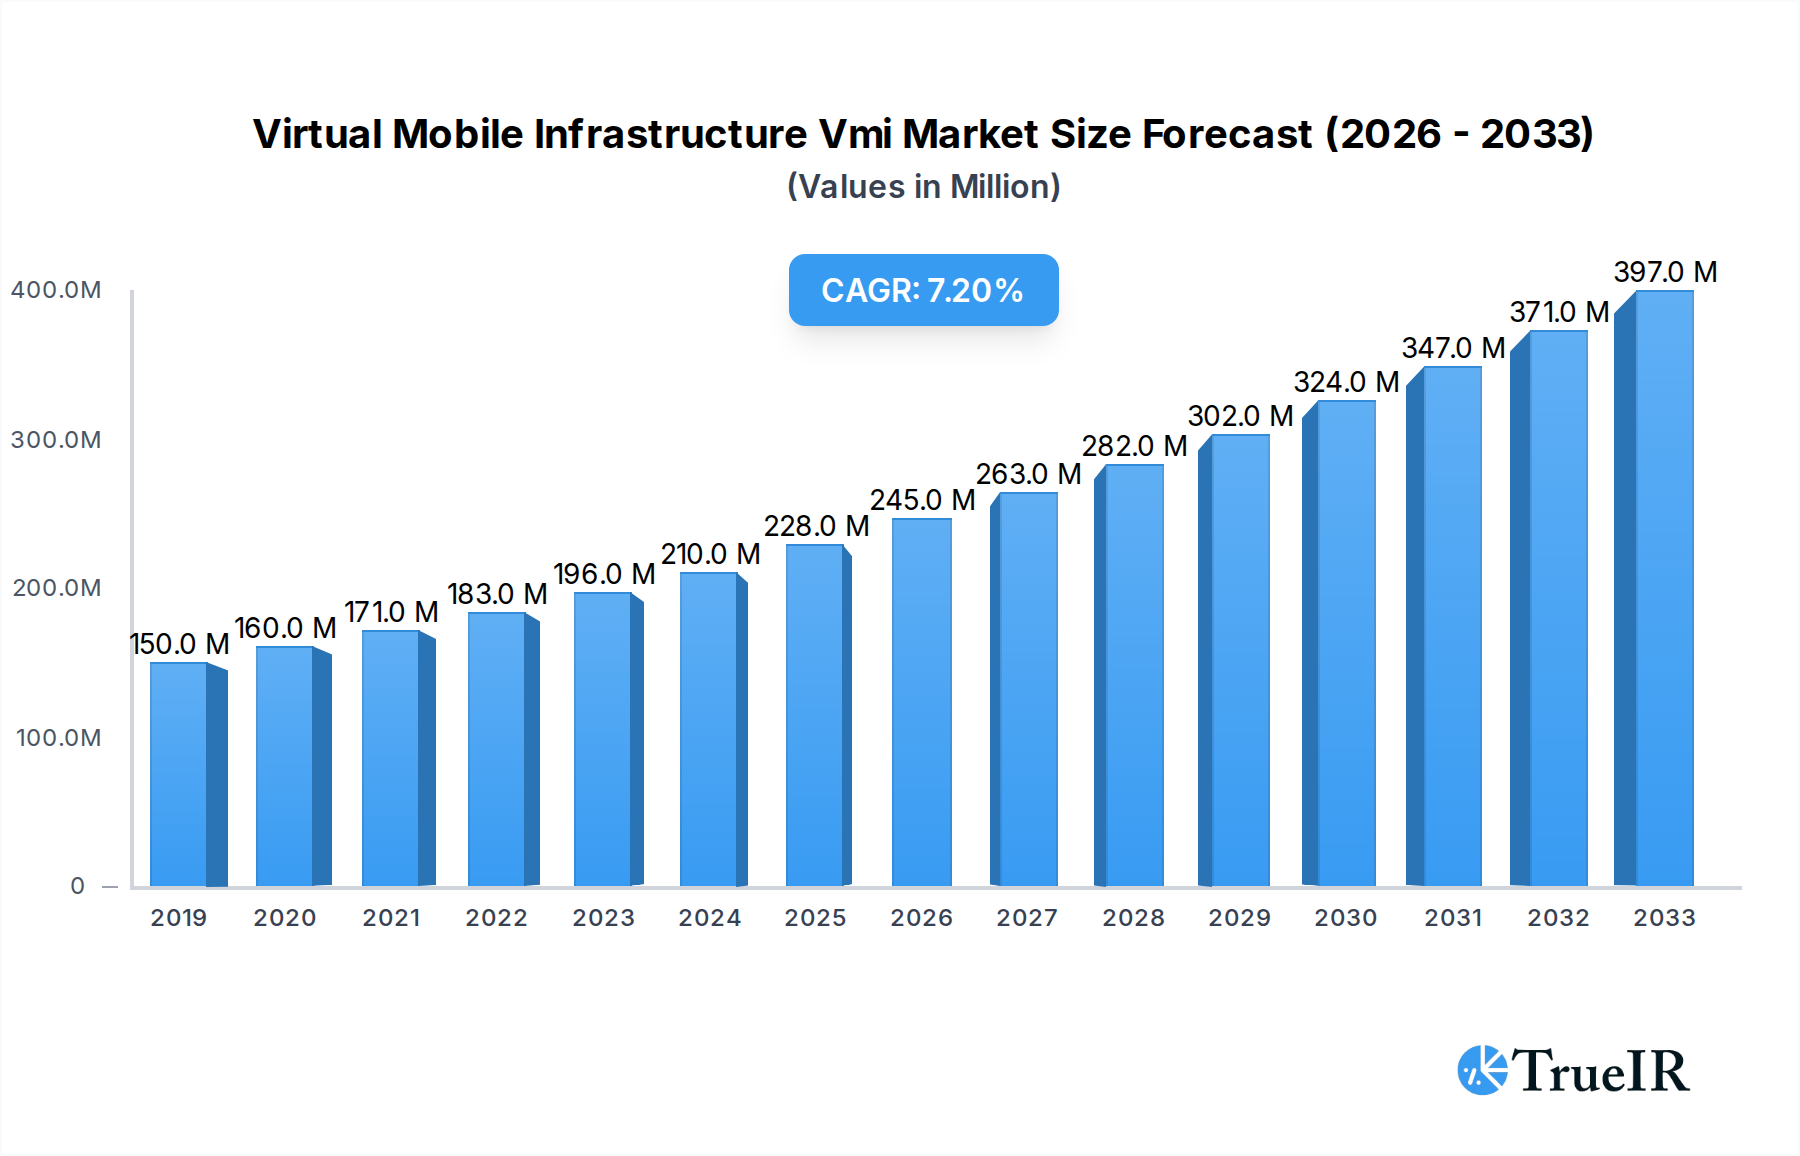
The Virtual Mobile Infrastructure (VMI) market is poised for substantial growth, with a current market size of USD 228 million and a projected Compound Annual Growth Rate (CAGR) of 6.6%. This upward trajectory is fueled by several key drivers. The increasing demand for secure and centralized mobile device management across enterprises, particularly in sectors like BFSI and Healthcare, is a primary catalyst. Furthermore, the burgeoning adoption of Bring Your Own Device (BYOD) and Choose Your Own Device (CYOD) policies necessitates robust VMI solutions to maintain data security and compliance. The IT and Telecom sector's continuous innovation and the government's focus on digital transformation initiatives are also significant contributors. The shift towards cloud-based VMI solutions is a dominant trend, offering scalability, flexibility, and reduced upfront investment, attracting a wider range of businesses. This trend is further supported by the growing need for remote work enablement and the proliferation of mobile applications, both of which demand a more agile and secure mobile environment.

Virtual Mobile Infrastructure Vmi Market Size (In Million)
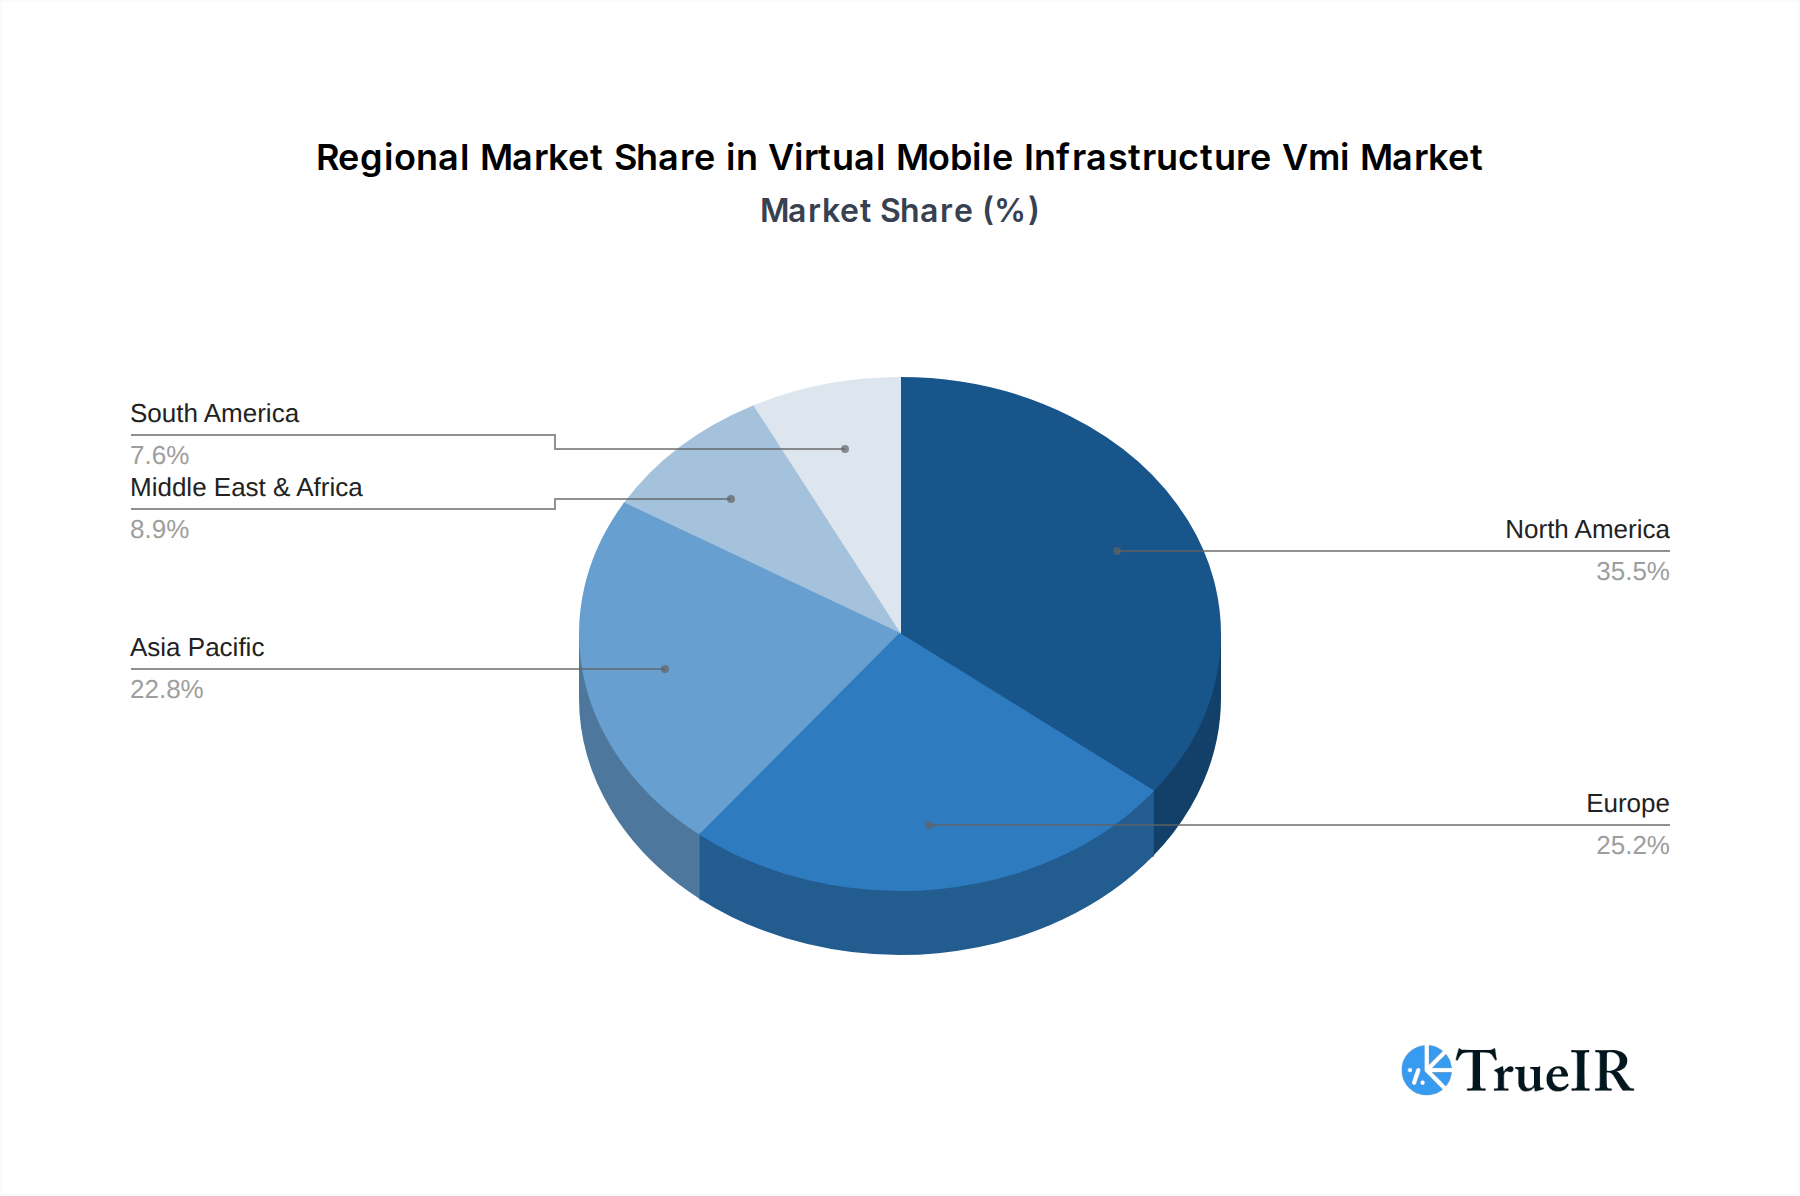
However, the market also faces certain restraints that could influence its growth trajectory. The initial implementation costs and the complexity associated with integrating VMI solutions into existing IT infrastructures can pose challenges for smaller organizations. Moreover, concerns regarding data privacy and regulatory compliance, although drivers for VMI, can also be perceived as hurdles if not addressed effectively by VMI providers. Despite these challenges, the VMI market is expected to witness robust expansion across various applications, including BFSI, Healthcare, Manufacturing, IT and Telecom, and Government. The market is bifurcated into cloud and on-premises deployment types, with cloud solutions gaining significant traction due to their inherent advantages. Geographically, North America is anticipated to lead the market, followed closely by Asia Pacific, driven by rapid digitalization and the presence of major technology hubs.
Virtual Mobile Infrastructure Vmi Company Market Share
Virtual Mobile Infrastructure VMI Market Structure & Competitive Landscape
The global Virtual Mobile Infrastructure (VMI) market exhibits a moderately concentrated structure, driven by a select number of innovative companies and evolving technological landscapes. Key innovation drivers include the escalating demand for secure mobile application access, the proliferation of BYOD (Bring Your Own Device) policies, and the increasing need for robust data protection across diverse enterprise segments. Regulatory impacts are also significant, particularly in sectors like BFSI and Healthcare, where stringent data privacy laws necessitate compliant VMI solutions. Product substitutes, while emerging, are largely focused on niche functionalities rather than comprehensive VMI offerings. End-user segmentation is diverse, with BFSI, IT and Telecom, and Government sectors representing the largest consumers of VMI solutions. Mergers and acquisitions (M&A) are a prevalent trend, with companies strategically acquiring smaller players to expand their technological capabilities or market reach. The concentration ratio is estimated to be between 45-55%, indicating that the top five players account for a substantial portion of the market share. M&A volumes have seen a steady increase, with an estimated XX significant transactions in the historical period.
Virtual Mobile Infrastructure VMI Market Trends & Opportunities
The Virtual Mobile Infrastructure (VMI) market is poised for substantial growth, projected to expand at a Compound Annual Growth Rate (CAGR) of approximately 18.2% from 2025 to 2033. This impressive expansion is fueled by a confluence of transformative technological shifts and evolving consumer preferences. The market size, valued at over X million in the base year 2025, is expected to reach over Y million by the end of the forecast period in 2033. Technological advancements in cloud computing, containerization, and advanced security protocols are making VMI solutions more scalable, accessible, and cost-effective. Enterprises are increasingly recognizing the inherent security risks associated with traditional mobile device management and are actively seeking VMI to create isolated, secure mobile environments. This allows employees to access sensitive corporate data and applications on personal devices without compromising organizational security.
Consumer preferences are also playing a pivotal role. The demand for seamless and secure access to corporate resources from any device, anywhere, is at an all-time high. Remote work trends, which have been further accelerated in recent years, have amplified this demand, making VMI a critical component of modern business operations. The competitive dynamics within the VMI market are intensifying, with established cybersecurity firms and specialized VMI providers vying for market share. This competition is driving innovation, leading to the development of more sophisticated features, enhanced user experiences, and tailored solutions for specific industry needs.
Furthermore, the growing adoption of mobile-first strategies across industries, coupled with the increasing complexity of mobile applications and the need for centralized management, presents significant opportunities for VMI providers. The market penetration rate for VMI solutions, while still relatively nascent in some sectors, is projected to see a significant uptick as organizations prioritize mobile security and productivity. The trend towards hybrid work models further solidifies the need for flexible and secure mobile access solutions like VMI. The evolution of 5G technology also contributes to the market's growth by enabling faster mobile connectivity, which enhances the performance and user experience of VMI. The increasing volume of sensitive data being processed and stored on mobile devices necessitates robust security measures, making VMI an indispensable solution.
Dominant Markets & Segments in Virtual Mobile Infrastructure VMI
The global Virtual Mobile Infrastructure (VMI) market is characterized by distinct regional and segment dominance, driven by specific industry needs and policy frameworks.
Leading Region:
- North America currently leads the VMI market, driven by its advanced technological infrastructure, high adoption rates of enterprise mobility solutions, and the presence of a significant number of major enterprises across various sectors. The region's proactive approach to cybersecurity and data protection regulations further bolsters VMI adoption. The United States, in particular, represents a substantial portion of this dominance, fueled by its extensive BFSI and IT and Telecom industries.
Dominant Application Segments:
- BFSI (Banking, Financial Services, and Insurance): This sector is a primary driver of VMI adoption due to the highly sensitive nature of financial data. Stringent regulatory requirements, such as GDPR and CCPA, necessitate robust security measures for mobile access, making VMI crucial for protecting customer information and preventing fraud. Key growth drivers include the need for secure remote banking, mobile trading platforms, and compliance with evolving financial regulations. Infrastructure investments in secure mobile solutions and government policies encouraging digital transformation within the financial sector further amplify growth. The market size for VMI in BFSI is estimated to be over X million.
- IT and Telecom: This segment is a natural early adopter of VMI, leveraging it for secure development, testing, and deployment of mobile applications. The constant need for innovation and the management of a vast number of devices within these organizations make VMI an efficient solution for centralized control and security. Growth is propelled by the demand for secure access to cloud-based services, application development platforms, and robust network management tools. Policies promoting digital infrastructure development and significant private sector investment in mobile technologies contribute to sustained growth.
- Government: Governments worldwide are increasingly adopting VMI to secure sensitive citizen data and ensure the continuity of critical services, especially in the face of evolving cyber threats. The need for secure communication, access to government applications, and compliance with national security directives are key drivers. Growth in this segment is fueled by initiatives focused on e-governance, national cybersecurity strategies, and the deployment of secure mobile devices for public officials.
Dominant Type Segments:
- Cloud: The cloud-based VMI segment is experiencing the most rapid growth. Its scalability, flexibility, cost-effectiveness, and ease of deployment make it highly attractive to businesses of all sizes. Cloud VMI enables organizations to access sophisticated mobile infrastructure without significant upfront capital expenditure on hardware. Growth drivers include the widespread adoption of cloud computing, the increasing demand for remote work solutions, and the continuous innovation in cloud-based security services. This segment is expected to account for over 70% of the total market share by 2033.
- On-premises: While cloud solutions are gaining traction, on-premises VMI remains relevant for organizations with strict data residency requirements or those operating in highly regulated industries that prefer complete control over their infrastructure. Growth in this segment is driven by specific enterprise needs for enhanced customization and security adherence to stringent internal policies.
Virtual Mobile Infrastructure VMI Product Analysis
Virtual Mobile Infrastructure (VMI) products are evolving rapidly, focusing on enhanced security, improved user experience, and broader platform compatibility. Key innovations include the development of containerized VMI solutions that offer greater isolation and efficiency, advanced AI-powered threat detection capabilities for proactive security, and seamless integration with existing enterprise IT ecosystems. Competitive advantages lie in offering end-to-end mobile security, enabling BYOD policies with strong data protection, and providing a centralized platform for managing a diverse range of mobile applications and devices. The market fit is strong for organizations seeking to bridge the gap between the convenience of mobile devices and the imperative for enterprise-grade security.
Key Drivers, Barriers & Challenges in Virtual Mobile Infrastructure VMI
Key Drivers:
- Escalating Cybersecurity Threats: The relentless rise in mobile-based cyberattacks, including malware, phishing, and ransomware, is a primary driver for VMI adoption.
- Growth of BYOD and Remote Work: The widespread acceptance of Bring Your Own Device policies and the surge in remote work scenarios necessitate secure mobile access to corporate resources.
- Stringent Regulatory Compliance: Industries like BFSI and Healthcare face rigorous data privacy regulations, driving the need for compliant VMI solutions to protect sensitive information.
- Demand for Enhanced Mobile Productivity: VMI enables employees to access applications and data efficiently and securely on their mobile devices, boosting overall productivity.
- Technological Advancements: Innovations in cloud computing, virtualization, and AI enhance the capabilities and scalability of VMI solutions.
Barriers & Challenges:
- Initial Implementation Costs: The upfront investment in VMI solutions can be a barrier for some small and medium-sized enterprises.
- Complexity of Integration: Integrating VMI with existing legacy IT infrastructure can be complex and time-consuming.
- User Adoption and Training: Ensuring seamless user adoption and providing adequate training on VMI usage can pose challenges.
- Vendor Lock-in Concerns: Organizations may be concerned about potential vendor lock-in with specific VMI providers.
- Evolving Threat Landscape: The constant evolution of cyber threats requires continuous updates and adaptation of VMI solutions.
- Lack of Standardization: A lack of universal standards across different VMI platforms can create interoperability issues.
Growth Drivers in the Virtual Mobile Infrastructure VMI Market
The Virtual Mobile Infrastructure (VMI) market is propelled by several interconnected growth drivers. The escalating sophistication of mobile cyber threats is compelling organizations to invest in advanced security measures, making VMI a critical defense mechanism. The widespread adoption of Bring Your Own Device (BYOD) policies and the persistent trend of remote and hybrid work environments are fueling the demand for secure, centralized mobile access. Furthermore, stringent government regulations and industry-specific compliance mandates, particularly within the BFSI and Healthcare sectors, are compelling businesses to adopt robust VMI solutions to safeguard sensitive data. Technological advancements in cloud computing and virtualization are also playing a crucial role by enhancing the scalability, accessibility, and cost-effectiveness of VMI offerings, thus making them more attractive to a broader range of businesses.
Challenges Impacting Virtual Mobile Infrastructure VMI Growth
Despite robust growth potential, the Virtual Mobile Infrastructure (VMI) market faces several impactful challenges. The initial implementation cost of VMI solutions can be a significant barrier, especially for small and medium-sized enterprises with limited IT budgets. Integrating VMI seamlessly with existing legacy IT infrastructure often presents technical complexities and can lead to extended deployment timelines. Ensuring widespread user adoption and providing adequate training on new VMI platforms can also be a hurdle. Furthermore, organizations may harbor concerns about potential vendor lock-in, which can limit their flexibility in the long term. The ever-evolving nature of cyber threats necessitates continuous updates and adaptations of VMI solutions, adding to ongoing operational costs and management overhead.
Key Players Shaping the Virtual Mobile Infrastructure VMI Market
- Trend Micro
- Avast Software
- Sierraware
- Raytheon
- Prescient Solutions
- Fortinet
- Genymobile
- Nubo
- Intelligent Waves
- Pulse Secure
Significant Virtual Mobile Infrastructure VMI Industry Milestones
- 2019: Emergence of advanced containerization techniques for VMI, improving resource isolation and efficiency.
- 2020: Increased adoption of VMI driven by the surge in remote work due to global events.
- 2021: Integration of AI and machine learning for enhanced threat detection and anomaly analysis in VMI solutions.
- 2022: Significant investments in VMI by BFSI and Healthcare sectors to meet regulatory compliance and data security needs.
- 2023: Introduction of enhanced BYOD management capabilities within VMI platforms, offering greater flexibility for users.
- 2024: Growing focus on cloud-native VMI solutions for improved scalability and accessibility.
Future Outlook for Virtual Mobile Infrastructure VMI Market
The future outlook for the Virtual Mobile Infrastructure (VMI) market is exceptionally bright, characterized by continued robust growth and widespread adoption across diverse industries. Key growth catalysts include the persistent evolution of mobile security threats, the ongoing expansion of remote and hybrid work models, and the increasing demand for secure access to enterprise data. Strategic opportunities lie in the development of more integrated VMI solutions that offer end-to-end security, from device management to application access, and the expansion of VMI into emerging markets with growing mobile penetration. The market potential is significant, as organizations globally recognize VMI as an indispensable component of their modern digital infrastructure, enabling secure productivity and mitigating pervasive cyber risks. The market is expected to reach over X million by 2033.
Virtual Mobile Infrastructure Vmi Segmentation
-
1. Application
- 1.1. BFSI
- 1.2. Healthcare
- 1.3. Manufacturing
- 1.4. IT and Telecom
- 1.5. Government
- 1.6. Others
-
2. Type
- 2.1. Cloud
- 2.2. On-premises
Virtual Mobile Infrastructure Vmi Segmentation By Geography
-
1. North America
- 1.1. United States
- 1.2. Canada
- 1.3. Mexico
-
2. South America
- 2.1. Brazil
- 2.2. Argentina
- 2.3. Rest of South America
-
3. Europe
- 3.1. United Kingdom
- 3.2. Germany
- 3.3. France
- 3.4. Italy
- 3.5. Spain
- 3.6. Russia
- 3.7. Benelux
- 3.8. Nordics
- 3.9. Rest of Europe
-
4. Middle East & Africa
- 4.1. Turkey
- 4.2. Israel
- 4.3. GCC
- 4.4. North Africa
- 4.5. South Africa
- 4.6. Rest of Middle East & Africa
-
5. Asia Pacific
- 5.1. China
- 5.2. India
- 5.3. Japan
- 5.4. South Korea
- 5.5. ASEAN
- 5.6. Oceania
- 5.7. Rest of Asia Pacific
Virtual Mobile Infrastructure Vmi Regional Market Share
Geographic Coverage of Virtual Mobile Infrastructure Vmi
Virtual Mobile Infrastructure Vmi REPORT HIGHLIGHTS
| Aspects | Details |
|---|---|
| Study Period | 2020-2034 |
| Base Year | 2025 |
| Estimated Year | 2026 |
| Forecast Period | 2026-2034 |
| Historical Period | 2020-2025 |
| Growth Rate | CAGR of 6.6% from 2020-2034 |
| Segmentation |
|
Table of Contents
- 1. Introduction
- 1.1. Research Scope
- 1.2. Market Segmentation
- 1.3. Research Methodology
- 1.4. Definitions and Assumptions
- 2. Executive Summary
- 2.1. Introduction
- 3. Market Dynamics
- 3.1. Introduction
- 3.2. Market Drivers
- 3.3. Market Restrains
- 3.4. Market Trends
- 4. Market Factor Analysis
- 4.1. Porters Five Forces
- 4.2. Supply/Value Chain
- 4.3. PESTEL analysis
- 4.4. Market Entropy
- 4.5. Patent/Trademark Analysis
- 5. Global Virtual Mobile Infrastructure Vmi Analysis, Insights and Forecast, 2020-2032
- 5.1. Market Analysis, Insights and Forecast - by Application
- 5.1.1. BFSI
- 5.1.2. Healthcare
- 5.1.3. Manufacturing
- 5.1.4. IT and Telecom
- 5.1.5. Government
- 5.1.6. Others
- 5.2. Market Analysis, Insights and Forecast - by Type
- 5.2.1. Cloud
- 5.2.2. On-premises
- 5.3. Market Analysis, Insights and Forecast - by Region
- 5.3.1. North America
- 5.3.2. South America
- 5.3.3. Europe
- 5.3.4. Middle East & Africa
- 5.3.5. Asia Pacific
- 5.1. Market Analysis, Insights and Forecast - by Application
- 6. North America Virtual Mobile Infrastructure Vmi Analysis, Insights and Forecast, 2020-2032
- 6.1. Market Analysis, Insights and Forecast - by Application
- 6.1.1. BFSI
- 6.1.2. Healthcare
- 6.1.3. Manufacturing
- 6.1.4. IT and Telecom
- 6.1.5. Government
- 6.1.6. Others
- 6.2. Market Analysis, Insights and Forecast - by Type
- 6.2.1. Cloud
- 6.2.2. On-premises
- 6.1. Market Analysis, Insights and Forecast - by Application
- 7. South America Virtual Mobile Infrastructure Vmi Analysis, Insights and Forecast, 2020-2032
- 7.1. Market Analysis, Insights and Forecast - by Application
- 7.1.1. BFSI
- 7.1.2. Healthcare
- 7.1.3. Manufacturing
- 7.1.4. IT and Telecom
- 7.1.5. Government
- 7.1.6. Others
- 7.2. Market Analysis, Insights and Forecast - by Type
- 7.2.1. Cloud
- 7.2.2. On-premises
- 7.1. Market Analysis, Insights and Forecast - by Application
- 8. Europe Virtual Mobile Infrastructure Vmi Analysis, Insights and Forecast, 2020-2032
- 8.1. Market Analysis, Insights and Forecast - by Application
- 8.1.1. BFSI
- 8.1.2. Healthcare
- 8.1.3. Manufacturing
- 8.1.4. IT and Telecom
- 8.1.5. Government
- 8.1.6. Others
- 8.2. Market Analysis, Insights and Forecast - by Type
- 8.2.1. Cloud
- 8.2.2. On-premises
- 8.1. Market Analysis, Insights and Forecast - by Application
- 9. Middle East & Africa Virtual Mobile Infrastructure Vmi Analysis, Insights and Forecast, 2020-2032
- 9.1. Market Analysis, Insights and Forecast - by Application
- 9.1.1. BFSI
- 9.1.2. Healthcare
- 9.1.3. Manufacturing
- 9.1.4. IT and Telecom
- 9.1.5. Government
- 9.1.6. Others
- 9.2. Market Analysis, Insights and Forecast - by Type
- 9.2.1. Cloud
- 9.2.2. On-premises
- 9.1. Market Analysis, Insights and Forecast - by Application
- 10. Asia Pacific Virtual Mobile Infrastructure Vmi Analysis, Insights and Forecast, 2020-2032
- 10.1. Market Analysis, Insights and Forecast - by Application
- 10.1.1. BFSI
- 10.1.2. Healthcare
- 10.1.3. Manufacturing
- 10.1.4. IT and Telecom
- 10.1.5. Government
- 10.1.6. Others
- 10.2. Market Analysis, Insights and Forecast - by Type
- 10.2.1. Cloud
- 10.2.2. On-premises
- 10.1. Market Analysis, Insights and Forecast - by Application
- 11. Competitive Analysis
- 11.1. Global Market Share Analysis 2025
- 11.2. Company Profiles
- 11.2.1 Trend Micro
- 11.2.1.1. Overview
- 11.2.1.2. Products
- 11.2.1.3. SWOT Analysis
- 11.2.1.4. Recent Developments
- 11.2.1.5. Financials (Based on Availability)
- 11.2.2 Avast Software
- 11.2.2.1. Overview
- 11.2.2.2. Products
- 11.2.2.3. SWOT Analysis
- 11.2.2.4. Recent Developments
- 11.2.2.5. Financials (Based on Availability)
- 11.2.3 Sierraware
- 11.2.3.1. Overview
- 11.2.3.2. Products
- 11.2.3.3. SWOT Analysis
- 11.2.3.4. Recent Developments
- 11.2.3.5. Financials (Based on Availability)
- 11.2.4 Raytheon
- 11.2.4.1. Overview
- 11.2.4.2. Products
- 11.2.4.3. SWOT Analysis
- 11.2.4.4. Recent Developments
- 11.2.4.5. Financials (Based on Availability)
- 11.2.5 Prescient Solutions
- 11.2.5.1. Overview
- 11.2.5.2. Products
- 11.2.5.3. SWOT Analysis
- 11.2.5.4. Recent Developments
- 11.2.5.5. Financials (Based on Availability)
- 11.2.6 Fortinet
- 11.2.6.1. Overview
- 11.2.6.2. Products
- 11.2.6.3. SWOT Analysis
- 11.2.6.4. Recent Developments
- 11.2.6.5. Financials (Based on Availability)
- 11.2.7 Genymobile
- 11.2.7.1. Overview
- 11.2.7.2. Products
- 11.2.7.3. SWOT Analysis
- 11.2.7.4. Recent Developments
- 11.2.7.5. Financials (Based on Availability)
- 11.2.8 Nubo
- 11.2.8.1. Overview
- 11.2.8.2. Products
- 11.2.8.3. SWOT Analysis
- 11.2.8.4. Recent Developments
- 11.2.8.5. Financials (Based on Availability)
- 11.2.9 Intelligent Waves
- 11.2.9.1. Overview
- 11.2.9.2. Products
- 11.2.9.3. SWOT Analysis
- 11.2.9.4. Recent Developments
- 11.2.9.5. Financials (Based on Availability)
- 11.2.10 Pulse Secure
- 11.2.10.1. Overview
- 11.2.10.2. Products
- 11.2.10.3. SWOT Analysis
- 11.2.10.4. Recent Developments
- 11.2.10.5. Financials (Based on Availability)
- 11.2.1 Trend Micro
List of Figures
- Figure 1: Global Virtual Mobile Infrastructure Vmi Revenue Breakdown (million, %) by Region 2025 & 2033
- Figure 2: North America Virtual Mobile Infrastructure Vmi Revenue (million), by Application 2025 & 2033
- Figure 3: North America Virtual Mobile Infrastructure Vmi Revenue Share (%), by Application 2025 & 2033
- Figure 4: North America Virtual Mobile Infrastructure Vmi Revenue (million), by Type 2025 & 2033
- Figure 5: North America Virtual Mobile Infrastructure Vmi Revenue Share (%), by Type 2025 & 2033
- Figure 6: North America Virtual Mobile Infrastructure Vmi Revenue (million), by Country 2025 & 2033
- Figure 7: North America Virtual Mobile Infrastructure Vmi Revenue Share (%), by Country 2025 & 2033
- Figure 8: South America Virtual Mobile Infrastructure Vmi Revenue (million), by Application 2025 & 2033
- Figure 9: South America Virtual Mobile Infrastructure Vmi Revenue Share (%), by Application 2025 & 2033
- Figure 10: South America Virtual Mobile Infrastructure Vmi Revenue (million), by Type 2025 & 2033
- Figure 11: South America Virtual Mobile Infrastructure Vmi Revenue Share (%), by Type 2025 & 2033
- Figure 12: South America Virtual Mobile Infrastructure Vmi Revenue (million), by Country 2025 & 2033
- Figure 13: South America Virtual Mobile Infrastructure Vmi Revenue Share (%), by Country 2025 & 2033
- Figure 14: Europe Virtual Mobile Infrastructure Vmi Revenue (million), by Application 2025 & 2033
- Figure 15: Europe Virtual Mobile Infrastructure Vmi Revenue Share (%), by Application 2025 & 2033
- Figure 16: Europe Virtual Mobile Infrastructure Vmi Revenue (million), by Type 2025 & 2033
- Figure 17: Europe Virtual Mobile Infrastructure Vmi Revenue Share (%), by Type 2025 & 2033
- Figure 18: Europe Virtual Mobile Infrastructure Vmi Revenue (million), by Country 2025 & 2033
- Figure 19: Europe Virtual Mobile Infrastructure Vmi Revenue Share (%), by Country 2025 & 2033
- Figure 20: Middle East & Africa Virtual Mobile Infrastructure Vmi Revenue (million), by Application 2025 & 2033
- Figure 21: Middle East & Africa Virtual Mobile Infrastructure Vmi Revenue Share (%), by Application 2025 & 2033
- Figure 22: Middle East & Africa Virtual Mobile Infrastructure Vmi Revenue (million), by Type 2025 & 2033
- Figure 23: Middle East & Africa Virtual Mobile Infrastructure Vmi Revenue Share (%), by Type 2025 & 2033
- Figure 24: Middle East & Africa Virtual Mobile Infrastructure Vmi Revenue (million), by Country 2025 & 2033
- Figure 25: Middle East & Africa Virtual Mobile Infrastructure Vmi Revenue Share (%), by Country 2025 & 2033
- Figure 26: Asia Pacific Virtual Mobile Infrastructure Vmi Revenue (million), by Application 2025 & 2033
- Figure 27: Asia Pacific Virtual Mobile Infrastructure Vmi Revenue Share (%), by Application 2025 & 2033
- Figure 28: Asia Pacific Virtual Mobile Infrastructure Vmi Revenue (million), by Type 2025 & 2033
- Figure 29: Asia Pacific Virtual Mobile Infrastructure Vmi Revenue Share (%), by Type 2025 & 2033
- Figure 30: Asia Pacific Virtual Mobile Infrastructure Vmi Revenue (million), by Country 2025 & 2033
- Figure 31: Asia Pacific Virtual Mobile Infrastructure Vmi Revenue Share (%), by Country 2025 & 2033
List of Tables
- Table 1: Global Virtual Mobile Infrastructure Vmi Revenue million Forecast, by Application 2020 & 2033
- Table 2: Global Virtual Mobile Infrastructure Vmi Revenue million Forecast, by Type 2020 & 2033
- Table 3: Global Virtual Mobile Infrastructure Vmi Revenue million Forecast, by Region 2020 & 2033
- Table 4: Global Virtual Mobile Infrastructure Vmi Revenue million Forecast, by Application 2020 & 2033
- Table 5: Global Virtual Mobile Infrastructure Vmi Revenue million Forecast, by Type 2020 & 2033
- Table 6: Global Virtual Mobile Infrastructure Vmi Revenue million Forecast, by Country 2020 & 2033
- Table 7: United States Virtual Mobile Infrastructure Vmi Revenue (million) Forecast, by Application 2020 & 2033
- Table 8: Canada Virtual Mobile Infrastructure Vmi Revenue (million) Forecast, by Application 2020 & 2033
- Table 9: Mexico Virtual Mobile Infrastructure Vmi Revenue (million) Forecast, by Application 2020 & 2033
- Table 10: Global Virtual Mobile Infrastructure Vmi Revenue million Forecast, by Application 2020 & 2033
- Table 11: Global Virtual Mobile Infrastructure Vmi Revenue million Forecast, by Type 2020 & 2033
- Table 12: Global Virtual Mobile Infrastructure Vmi Revenue million Forecast, by Country 2020 & 2033
- Table 13: Brazil Virtual Mobile Infrastructure Vmi Revenue (million) Forecast, by Application 2020 & 2033
- Table 14: Argentina Virtual Mobile Infrastructure Vmi Revenue (million) Forecast, by Application 2020 & 2033
- Table 15: Rest of South America Virtual Mobile Infrastructure Vmi Revenue (million) Forecast, by Application 2020 & 2033
- Table 16: Global Virtual Mobile Infrastructure Vmi Revenue million Forecast, by Application 2020 & 2033
- Table 17: Global Virtual Mobile Infrastructure Vmi Revenue million Forecast, by Type 2020 & 2033
- Table 18: Global Virtual Mobile Infrastructure Vmi Revenue million Forecast, by Country 2020 & 2033
- Table 19: United Kingdom Virtual Mobile Infrastructure Vmi Revenue (million) Forecast, by Application 2020 & 2033
- Table 20: Germany Virtual Mobile Infrastructure Vmi Revenue (million) Forecast, by Application 2020 & 2033
- Table 21: France Virtual Mobile Infrastructure Vmi Revenue (million) Forecast, by Application 2020 & 2033
- Table 22: Italy Virtual Mobile Infrastructure Vmi Revenue (million) Forecast, by Application 2020 & 2033
- Table 23: Spain Virtual Mobile Infrastructure Vmi Revenue (million) Forecast, by Application 2020 & 2033
- Table 24: Russia Virtual Mobile Infrastructure Vmi Revenue (million) Forecast, by Application 2020 & 2033
- Table 25: Benelux Virtual Mobile Infrastructure Vmi Revenue (million) Forecast, by Application 2020 & 2033
- Table 26: Nordics Virtual Mobile Infrastructure Vmi Revenue (million) Forecast, by Application 2020 & 2033
- Table 27: Rest of Europe Virtual Mobile Infrastructure Vmi Revenue (million) Forecast, by Application 2020 & 2033
- Table 28: Global Virtual Mobile Infrastructure Vmi Revenue million Forecast, by Application 2020 & 2033
- Table 29: Global Virtual Mobile Infrastructure Vmi Revenue million Forecast, by Type 2020 & 2033
- Table 30: Global Virtual Mobile Infrastructure Vmi Revenue million Forecast, by Country 2020 & 2033
- Table 31: Turkey Virtual Mobile Infrastructure Vmi Revenue (million) Forecast, by Application 2020 & 2033
- Table 32: Israel Virtual Mobile Infrastructure Vmi Revenue (million) Forecast, by Application 2020 & 2033
- Table 33: GCC Virtual Mobile Infrastructure Vmi Revenue (million) Forecast, by Application 2020 & 2033
- Table 34: North Africa Virtual Mobile Infrastructure Vmi Revenue (million) Forecast, by Application 2020 & 2033
- Table 35: South Africa Virtual Mobile Infrastructure Vmi Revenue (million) Forecast, by Application 2020 & 2033
- Table 36: Rest of Middle East & Africa Virtual Mobile Infrastructure Vmi Revenue (million) Forecast, by Application 2020 & 2033
- Table 37: Global Virtual Mobile Infrastructure Vmi Revenue million Forecast, by Application 2020 & 2033
- Table 38: Global Virtual Mobile Infrastructure Vmi Revenue million Forecast, by Type 2020 & 2033
- Table 39: Global Virtual Mobile Infrastructure Vmi Revenue million Forecast, by Country 2020 & 2033
- Table 40: China Virtual Mobile Infrastructure Vmi Revenue (million) Forecast, by Application 2020 & 2033
- Table 41: India Virtual Mobile Infrastructure Vmi Revenue (million) Forecast, by Application 2020 & 2033
- Table 42: Japan Virtual Mobile Infrastructure Vmi Revenue (million) Forecast, by Application 2020 & 2033
- Table 43: South Korea Virtual Mobile Infrastructure Vmi Revenue (million) Forecast, by Application 2020 & 2033
- Table 44: ASEAN Virtual Mobile Infrastructure Vmi Revenue (million) Forecast, by Application 2020 & 2033
- Table 45: Oceania Virtual Mobile Infrastructure Vmi Revenue (million) Forecast, by Application 2020 & 2033
- Table 46: Rest of Asia Pacific Virtual Mobile Infrastructure Vmi Revenue (million) Forecast, by Application 2020 & 2033
Frequently Asked Questions
1. What is the projected Compound Annual Growth Rate (CAGR) of the Virtual Mobile Infrastructure Vmi?
The projected CAGR is approximately 6.6%.
2. Which companies are prominent players in the Virtual Mobile Infrastructure Vmi?
Key companies in the market include Trend Micro, Avast Software, Sierraware, Raytheon, Prescient Solutions, Fortinet, Genymobile, Nubo, Intelligent Waves, Pulse Secure.
3. What are the main segments of the Virtual Mobile Infrastructure Vmi?
The market segments include Application, Type.
4. Can you provide details about the market size?
The market size is estimated to be USD 228 million as of 2022.
5. What are some drivers contributing to market growth?
N/A
6. What are the notable trends driving market growth?
N/A
7. Are there any restraints impacting market growth?
N/A
8. Can you provide examples of recent developments in the market?
N/A
9. What pricing options are available for accessing the report?
Pricing options include single-user, multi-user, and enterprise licenses priced at USD 3950.00, USD 5925.00, and USD 7900.00 respectively.
10. Is the market size provided in terms of value or volume?
The market size is provided in terms of value, measured in million.
11. Are there any specific market keywords associated with the report?
Yes, the market keyword associated with the report is "Virtual Mobile Infrastructure Vmi," which aids in identifying and referencing the specific market segment covered.
12. How do I determine which pricing option suits my needs best?
The pricing options vary based on user requirements and access needs. Individual users may opt for single-user licenses, while businesses requiring broader access may choose multi-user or enterprise licenses for cost-effective access to the report.
13. Are there any additional resources or data provided in the Virtual Mobile Infrastructure Vmi report?
While the report offers comprehensive insights, it's advisable to review the specific contents or supplementary materials provided to ascertain if additional resources or data are available.
14. How can I stay updated on further developments or reports in the Virtual Mobile Infrastructure Vmi?
To stay informed about further developments, trends, and reports in the Virtual Mobile Infrastructure Vmi, consider subscribing to industry newsletters, following relevant companies and organizations, or regularly checking reputable industry news sources and publications.
Methodology
Step 1 - Identification of Relevant Samples Size from Population Database


Step 2 - Approaches for Defining Global Market Size (Value, Volume* & Price*)

Note*: In applicable scenarios
Step 3 - Data Sources
Primary Research
- Web Analytics
- Survey Reports
- Research Institute
- Latest Research Reports
- Opinion Leaders
Secondary Research
- Annual Reports
- White Paper
- Latest Press Release
- Industry Association
- Paid Database
- Investor Presentations

Step 4 - Data Triangulation
Involves using different sources of information in order to increase the validity of a study
These sources are likely to be stakeholders in a program - participants, other researchers, program staff, other community members, and so on.
Then we put all data in single framework & apply various statistical tools to find out the dynamic on the market.
During the analysis stage, feedback from the stakeholder groups would be compared to determine areas of agreement as well as areas of divergence