

Key Insights
The Web-services Toxicity Estimation Software Tool market is poised for significant expansion, with a projected market size of $635.8 million in 2025, driven by an impressive Compound Annual Growth Rate (CAGR) of 8.7%. This robust growth is fueled by an increasing demand for rapid and reliable toxicity assessments across various industries, particularly in pharmaceutical research and development, chemical safety, and consumer product testing. The need to accelerate drug discovery pipelines and comply with stringent regulatory requirements for product safety are primary drivers. Furthermore, advancements in artificial intelligence and machine learning are enhancing the predictive capabilities of these software tools, offering more accurate and cost-effective alternatives to traditional in-vivo testing methods. The adoption of cloud-based solutions is also on the rise, providing greater accessibility, scalability, and flexibility for users, further bolstering market expansion.

Web-services Toxicity Estimation Software Tool Market Size (In Million)
The market is segmented by application into Research Institutes and Enterprises, with both segments exhibiting strong growth potential. Research institutes leverage these tools for early-stage drug candidate screening and academic research, while enterprises utilize them for product safety evaluations, regulatory submissions, and risk management. The increasing complexity of chemical compounds and novel therapeutic modalities necessitates sophisticated toxicity prediction tools. Key players like Instem, Lhasa, MultiCASE, Inotiv, Simulations Plus, Schrodinger, Aclaris, Evogene, Deciphex, and Exscientia are actively innovating, offering advanced features and expanding their service portfolios to cater to the evolving needs of the market. The forecast period, from 2025 to 2033, is expected to witness continuous innovation and market penetration, solidifying the critical role of web-services toxicity estimation software in modern scientific endeavors.

Web-services Toxicity Estimation Software Tool Company Market Share
Web-services Toxicity Estimation Software Tool Market Structure & Competitive Landscape
The web-services toxicity estimation software tool market exhibits a dynamic yet somewhat concentrated competitive landscape, driven by significant investments in drug discovery and chemical safety. Key innovation drivers include advancements in artificial intelligence and machine learning, enabling more accurate and predictive toxicity assessments. Regulatory impacts, particularly from agencies like the FDA and EMA, are pivotal, mandating robust safety evaluations and thus fueling demand for sophisticated tools. Product substitutes, such as traditional in-vitro and in-vivo testing, are gradually being augmented and, in some cases, replaced by computational approaches, indicating a clear technological shift.
The end-user segmentation primarily comprises:
- Research Institutes: Seeking cost-effective and rapid screening of potential drug candidates and chemical compounds.
- Enterprises: Large pharmaceutical, biotechnology, and chemical companies requiring integrated platforms for comprehensive toxicity profiling throughout their R&D pipelines.
Mergers and acquisitions (M&A) are a notable trend, consolidating market share and expanding technological capabilities. For instance, the acquisition of smaller AI-driven companies by larger players seeking to bolster their in-silico toxicology portfolios is a recurring theme, contributing to an estimated xx million in M&A deal value over the historical period. The concentration ratio for the top five players is estimated to be around xx%, indicating a moderate level of market concentration.
Web-services Toxicity Estimation Software Tool Market Trends & Opportunities
The global Web-services Toxicity Estimation Software Tool market is poised for substantial growth, projected to reach a valuation of xx million by 2033, expanding from an estimated xx million in 2025. This impressive expansion is underpinned by a compound annual growth rate (CAGR) of xx% during the forecast period of 2025–2033. The historical period from 2019–2024 saw consistent, albeit more moderate, growth, establishing a strong foundation for future expansion. Several interconnected trends are driving this upward trajectory.
Technological advancements are at the forefront, with the integration of sophisticated artificial intelligence (AI) and machine learning (ML) algorithms revolutionizing the accuracy and efficiency of toxicity predictions. These AI-powered tools can analyze vast datasets of chemical structures and biological responses, identifying potential toxic liabilities much earlier in the drug discovery and chemical development processes. This not only accelerates R&D timelines but also significantly reduces the costs associated with traditional, labor-intensive testing methods. The increasing adoption of cloud-based solutions further democratizes access to these powerful tools, enabling smaller research institutions and enterprises to leverage cutting-edge toxicity estimation capabilities without substantial upfront infrastructure investment.
Consumer preferences, or rather end-user demands within the scientific community, are increasingly leaning towards predictive and non-animal testing methods. Growing ethical concerns and regulatory pressures to reduce animal testing are compelling organizations to invest in in-silico alternatives. This shift is creating immense opportunities for web-services toxicity estimation tools that offer reliable, reproducible, and regulatory-accepted predictions. Furthermore, the growing complexity of novel drug molecules and chemicals necessitates sophisticated tools capable of handling intricate biological interactions and predicting a wider range of toxicological endpoints.
Competitive dynamics within the market are characterized by both established software providers and emerging AI-focused startups. Companies are differentiating themselves through the comprehensiveness of their prediction models, the integration of diverse toxicological datasets, user-friendly interfaces, and robust validation strategies. The market penetration rate for advanced toxicity estimation software is steadily increasing, moving beyond early adopters to mainstream adoption across pharmaceutical, biotechnology, and chemical industries. The ongoing convergence of computational chemistry, toxicology, and data science continues to drive innovation, creating a fertile ground for new applications and enhanced predictive capabilities.
Dominant Markets & Segments in Web-services Toxicity Estimation Software Tool
The web-services toxicity estimation software tool market exhibits distinct dominance across various segments, driven by unique infrastructural advantages, supportive policy environments, and specific industry needs.
Application: Research Institute
Research institutes represent a significant and rapidly growing segment within the toxicity estimation software market. The primary growth drivers here include:
- Cost-Effectiveness: Research institutes, often operating with constrained budgets, find web-based toxicity estimation tools to be a cost-effective alternative to extensive in-vitro and in-vivo testing. The pay-as-you-go or subscription models offered by cloud-based solutions minimize upfront capital expenditure.
- Speed and Efficiency: The ability to rapidly screen numerous compounds for potential toxicity is paramount in early-stage research. Web-services tools enable faster identification of promising candidates and quicker elimination of problematic ones, accelerating the research lifecycle.
- Access to Advanced Technologies: Many research institutes may lack the internal expertise or resources to develop and maintain sophisticated AI/ML models for toxicity prediction. Web-services offer direct access to these advanced capabilities, leveling the playing field.
- Collaboration and Data Sharing: Cloud-based platforms facilitate seamless collaboration among researchers and secure data sharing, which is crucial for multidisciplinary projects common in academic settings.
The adoption of these tools by research institutes is further bolstered by government grants and funding initiatives that encourage the use of innovative technologies in scientific research.
Application: Enterprise
Enterprises, particularly large pharmaceutical, biotechnology, and chemical companies, form the largest and most influential segment. Key growth drivers for enterprises include:
- Regulatory Compliance: Large enterprises face stringent regulatory requirements for drug and chemical safety. Web-services toxicity estimation tools are crucial for generating the robust data needed for regulatory submissions and ensuring compliance with evolving guidelines. The estimated market size for enterprise adoption is in the xx million range.
- Risk Mitigation: Early identification of potential toxicity significantly reduces the risk of late-stage failures in drug development, a notoriously expensive and time-consuming endeavor. This proactive risk mitigation is a primary driver for enterprise investment, with an estimated xx million invested annually in such tools.
- Integrated R&D Pipelines: Enterprises are increasingly integrating toxicity estimation tools into their entire R&D pipeline, from initial compound design to preclinical development. This holistic approach streamlines workflows and enhances decision-making.
- Global Operations and Scalability: Web-services offer the scalability and accessibility required for global operations, allowing geographically dispersed R&D teams to access and utilize the same advanced toxicity assessment tools.
The presence of established players like Instem, Lhasa, MultiCASE, Inotiv, Simulations Plus, Schrodinger, Aclaris, Evogene, Deciphex, and Exscientia, among others, caters to the complex needs of enterprise clients, offering customized solutions and comprehensive support, contributing an estimated xx million to the market.
Types: Cloud-based
Cloud-based solutions are the dominant and fastest-growing type of web-services toxicity estimation software. The key growth drivers are:
- Accessibility and Flexibility: Users can access these tools from any internet-connected device, offering unparalleled flexibility for remote work and collaborative environments.
- Scalability: Cloud infrastructure allows for easy scaling of computational resources based on demand, accommodating projects of varying sizes and complexities without the need for hardware upgrades.
- Reduced IT Overhead: Enterprises and research institutes can significantly reduce their IT infrastructure costs and maintenance burdens by leveraging cloud-based services.
- Automatic Updates and Maintenance: Software updates, maintenance, and security patches are managed by the service provider, ensuring users always have access to the latest features and robust security.
The market share for cloud-based solutions is estimated to be xx%, with an expected continued upward trend.
Types: On-premises
While cloud-based solutions are gaining traction, on-premises deployments still hold a significant share, particularly among large enterprises with highly sensitive data or specific IT infrastructure requirements.
- Data Security and Control: Organizations with stringent data privacy policies or regulatory mandates may prefer on-premises solutions to maintain complete control over their proprietary data.
- Integration with Existing Systems: For some enterprises, on-premises solutions offer seamless integration with their existing legacy IT systems and workflows.
- Predictable Costs: While initial investment can be higher, on-premises solutions can offer more predictable long-term operational costs for very large deployments.
The market share for on-premises solutions is estimated to be xx%, with its growth rate being slower compared to cloud-based alternatives.
Web-services Toxicity Estimation Software Tool Product Analysis
The web-services toxicity estimation software tool market is characterized by a rapid evolution of product offerings, emphasizing predictive accuracy and user-centric design. These tools leverage advanced computational methodologies, including quantitative structure-activity relationships (QSAR), read-across, and increasingly, sophisticated AI/ML algorithms, to predict a wide spectrum of toxicological endpoints such as carcinogenicity, mutagenicity, reproductive toxicity, and organ-specific toxicities. Key competitive advantages lie in their ability to integrate diverse datasets, offer transparent prediction models, and provide actionable insights for drug discovery and chemical risk assessment. Innovations focus on improving prediction accuracy, expanding the range of predicted toxicities, and enhancing the user experience through intuitive interfaces and seamless integration with existing R&D workflows, contributing an estimated xx million to product development investment.
Key Drivers, Barriers & Challenges in Web-services Toxicity Estimation Software Tool
Key Drivers:
- Technological Advancements: The continuous evolution of AI, ML, and computational toxicology fuels the development of more accurate and comprehensive prediction models.
- Regulatory Mandates: Increasing pressure from regulatory bodies worldwide to reduce animal testing and adopt in-silico methods drives adoption.
- Cost and Time Savings: Predictive tools offer significant cost reductions and accelerate R&D timelines compared to traditional testing methods.
- Drug Discovery Pipeline Acceleration: Early identification of toxic liabilities streamlines the drug discovery process, leading to faster market entry for promising candidates.
- Growing Complexity of Chemicals and Drugs: The development of novel and complex chemical entities necessitates advanced predictive tools for safety assessments.
Key Barriers & Challenges:
- Data Quality and Availability: The accuracy of predictions heavily relies on the quality and comprehensiveness of training data, which can be a bottleneck. The estimated impact of poor data quality can lead to xx% reduction in prediction accuracy.
- Regulatory Acceptance and Validation: While gaining traction, regulatory bodies still require rigorous validation and robust evidence for the acceptance of in-silico predictions in decision-making, a process that can cost an estimated xx million per validation study.
- Model Interpretability and Trust: The "black box" nature of some AI/ML models can hinder user trust and understanding, requiring efforts towards greater model interpretability.
- Integration Complexity: Integrating new software tools into existing, complex enterprise IT infrastructures can be challenging and time-consuming, with integration costs estimated at xx million for large deployments.
- Skilled Workforce Shortage: A lack of personnel with expertise in computational toxicology and data science can limit the effective utilization of these advanced tools.
Growth Drivers in the Web-services Toxicity Estimation Software Tool Market
The growth of the web-services toxicity estimation software tool market is propelled by several key factors. Technologically, the relentless progress in AI and machine learning is enabling the development of increasingly sophisticated and accurate predictive models. Economically, the significant cost savings and accelerated timelines offered by these tools are highly attractive to pharmaceutical, biotechnology, and chemical companies, particularly in light of escalating R&D expenses. Regulatory drivers, such as the global push to reduce animal testing and the increasing emphasis on data-driven safety assessments, are creating a favorable environment for in-silico toxicology solutions. For instance, regulatory bodies are actively encouraging the use of validated computational methods, further bolstering market expansion.
Challenges Impacting Web-services Toxicity Estimation Software Tool Growth
Several challenges can impede the growth of the web-services toxicity estimation software tool market. Regulatory complexities remain a significant hurdle; while acceptance is growing, comprehensive validation and clear guidelines for specific applications are still evolving, potentially costing xx million per drug submission in extended review times due to data gaps. Supply chain issues are less directly applicable but can indirectly impact the market through delays in the availability of specialized hardware or cloud computing resources if demand surges unexpectedly. Competitive pressures are also intense, with numerous players vying for market share, leading to pricing pressures and the constant need for innovation, estimated at xx million in annual R&D investment by leading companies.
Key Players Shaping the Web-services Toxicity Estimation Software Tool Market
- Instem
- Lhasa
- MultiCASE
- Inotiv
- Simulations Plus
- Schrodinger
- Aclaris
- Evogene
- Deciphex
- Exscientia
Significant Web-services Toxicity Estimation Software Tool Industry Milestones
- 2019: Increased adoption of AI and ML in QSAR modeling, enhancing prediction accuracy.
- 2020: Growing regulatory acceptance of in-silico methods for specific toxicity endpoints.
- 2021: Launch of several cloud-based platforms offering integrated toxicity assessment workflows.
- 2022: Focus on explainable AI (XAI) in toxicity prediction models to improve user trust.
- 2023: Expansion of prediction capabilities to include novel endpoints and complex chemical structures.
- 2024: Mergers and acquisitions in the sector to consolidate expertise and market share.
- 2025: Projected increase in the use of these tools for early-stage drug discovery screening, with an estimated xx million worth of deals.
- 2026: Further development of integrated platforms combining in-silico with in-vitro data.
- 2027: Potential emergence of standardized validation frameworks for AI-driven toxicity predictions.
- 2028: Increased market penetration in emerging economies.
- 2029: Advancements in predicting ADMET properties through unified models.
- 2030: Greater emphasis on personalized medicine applications through advanced toxicity profiling.
- 2031: Integration of blockchain technology for secure and transparent data management in toxicity prediction.
- 2032: Continued refinement of AI algorithms for higher predictive accuracy across broader chemical spaces.
- 2033: Anticipated widespread adoption as a primary tool in chemical and pharmaceutical safety assessments.
Future Outlook for Web-services Toxicity Estimation Software Tool Market
The future outlook for the web-services toxicity estimation software tool market is exceptionally promising, driven by a confluence of technological advancements, regulatory imperatives, and economic efficiencies. Strategic opportunities lie in the continued integration of advanced AI and ML, the expansion of prediction capabilities to cover a wider array of toxicological endpoints, and the development of more interpretable and transparent models. The market potential is substantial, fueled by the ever-increasing demand for safer chemicals and more effective drugs, with projected market growth in the xx million range by 2033. As regulatory bodies worldwide increasingly embrace and advocate for in-silico approaches, the adoption of these tools is set to become a standard practice across the chemical and pharmaceutical industries.
Web-services Toxicity Estimation Software Tool Segmentation
-
1. Application
- 1.1. Research Institute
- 1.2. Enterprise
-
2. Types
- 2.1. Cloud-based
- 2.2. On-premises
Web-services Toxicity Estimation Software Tool Segmentation By Geography
-
1. North America
- 1.1. United States
- 1.2. Canada
- 1.3. Mexico
-
2. South America
- 2.1. Brazil
- 2.2. Argentina
- 2.3. Rest of South America
-
3. Europe
- 3.1. United Kingdom
- 3.2. Germany
- 3.3. France
- 3.4. Italy
- 3.5. Spain
- 3.6. Russia
- 3.7. Benelux
- 3.8. Nordics
- 3.9. Rest of Europe
-
4. Middle East & Africa
- 4.1. Turkey
- 4.2. Israel
- 4.3. GCC
- 4.4. North Africa
- 4.5. South Africa
- 4.6. Rest of Middle East & Africa
-
5. Asia Pacific
- 5.1. China
- 5.2. India
- 5.3. Japan
- 5.4. South Korea
- 5.5. ASEAN
- 5.6. Oceania
- 5.7. Rest of Asia Pacific
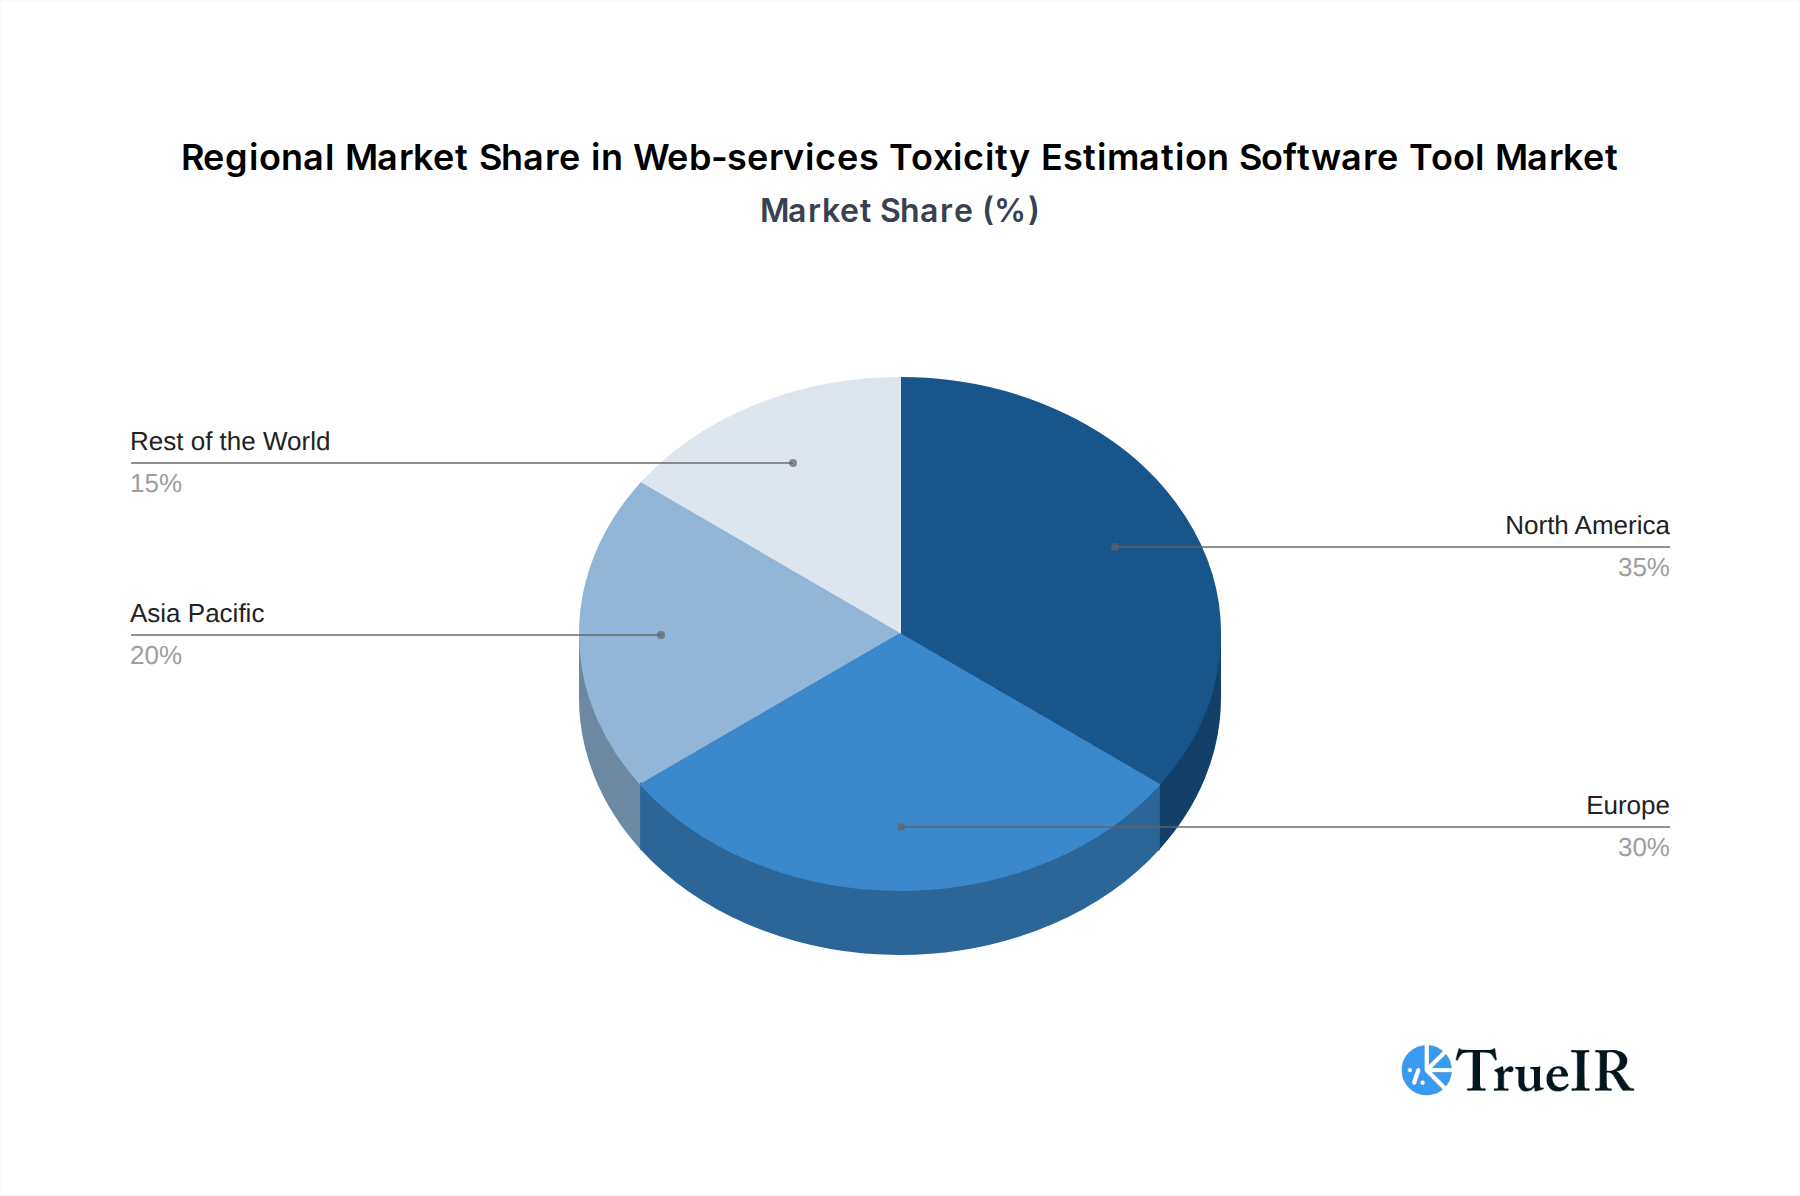
Web-services Toxicity Estimation Software Tool Regional Market Share
Geographic Coverage of Web-services Toxicity Estimation Software Tool
Web-services Toxicity Estimation Software Tool REPORT HIGHLIGHTS
| Aspects | Details |
|---|---|
| Study Period | 2020-2034 |
| Base Year | 2025 |
| Estimated Year | 2026 |
| Forecast Period | 2026-2034 |
| Historical Period | 2020-2025 |
| Growth Rate | CAGR of 10.6% from 2020-2034 |
| Segmentation |
|
Table of Contents
- 1. Introduction
- 1.1. Research Scope
- 1.2. Market Segmentation
- 1.3. Research Methodology
- 1.4. Definitions and Assumptions
- 2. Executive Summary
- 2.1. Introduction
- 3. Market Dynamics
- 3.1. Introduction
- 3.2. Market Drivers
- 3.3. Market Restrains
- 3.4. Market Trends
- 4. Market Factor Analysis
- 4.1. Porters Five Forces
- 4.2. Supply/Value Chain
- 4.3. PESTEL analysis
- 4.4. Market Entropy
- 4.5. Patent/Trademark Analysis
- 5. Global Web-services Toxicity Estimation Software Tool Analysis, Insights and Forecast, 2020-2032
- 5.1. Market Analysis, Insights and Forecast - by Application
- 5.1.1. Research Institute
- 5.1.2. Enterprise
- 5.2. Market Analysis, Insights and Forecast - by Types
- 5.2.1. Cloud-based
- 5.2.2. On-premises
- 5.3. Market Analysis, Insights and Forecast - by Region
- 5.3.1. North America
- 5.3.2. South America
- 5.3.3. Europe
- 5.3.4. Middle East & Africa
- 5.3.5. Asia Pacific
- 5.1. Market Analysis, Insights and Forecast - by Application
- 6. North America Web-services Toxicity Estimation Software Tool Analysis, Insights and Forecast, 2020-2032
- 6.1. Market Analysis, Insights and Forecast - by Application
- 6.1.1. Research Institute
- 6.1.2. Enterprise
- 6.2. Market Analysis, Insights and Forecast - by Types
- 6.2.1. Cloud-based
- 6.2.2. On-premises
- 6.1. Market Analysis, Insights and Forecast - by Application
- 7. South America Web-services Toxicity Estimation Software Tool Analysis, Insights and Forecast, 2020-2032
- 7.1. Market Analysis, Insights and Forecast - by Application
- 7.1.1. Research Institute
- 7.1.2. Enterprise
- 7.2. Market Analysis, Insights and Forecast - by Types
- 7.2.1. Cloud-based
- 7.2.2. On-premises
- 7.1. Market Analysis, Insights and Forecast - by Application
- 8. Europe Web-services Toxicity Estimation Software Tool Analysis, Insights and Forecast, 2020-2032
- 8.1. Market Analysis, Insights and Forecast - by Application
- 8.1.1. Research Institute
- 8.1.2. Enterprise
- 8.2. Market Analysis, Insights and Forecast - by Types
- 8.2.1. Cloud-based
- 8.2.2. On-premises
- 8.1. Market Analysis, Insights and Forecast - by Application
- 9. Middle East & Africa Web-services Toxicity Estimation Software Tool Analysis, Insights and Forecast, 2020-2032
- 9.1. Market Analysis, Insights and Forecast - by Application
- 9.1.1. Research Institute
- 9.1.2. Enterprise
- 9.2. Market Analysis, Insights and Forecast - by Types
- 9.2.1. Cloud-based
- 9.2.2. On-premises
- 9.1. Market Analysis, Insights and Forecast - by Application
- 10. Asia Pacific Web-services Toxicity Estimation Software Tool Analysis, Insights and Forecast, 2020-2032
- 10.1. Market Analysis, Insights and Forecast - by Application
- 10.1.1. Research Institute
- 10.1.2. Enterprise
- 10.2. Market Analysis, Insights and Forecast - by Types
- 10.2.1. Cloud-based
- 10.2.2. On-premises
- 10.1. Market Analysis, Insights and Forecast - by Application
- 11. Competitive Analysis
- 11.1. Global Market Share Analysis 2025
- 11.2. Company Profiles
- 11.2.1 Instem
- 11.2.1.1. Overview
- 11.2.1.2. Products
- 11.2.1.3. SWOT Analysis
- 11.2.1.4. Recent Developments
- 11.2.1.5. Financials (Based on Availability)
- 11.2.2 Lhasa
- 11.2.2.1. Overview
- 11.2.2.2. Products
- 11.2.2.3. SWOT Analysis
- 11.2.2.4. Recent Developments
- 11.2.2.5. Financials (Based on Availability)
- 11.2.3 MultiCASE
- 11.2.3.1. Overview
- 11.2.3.2. Products
- 11.2.3.3. SWOT Analysis
- 11.2.3.4. Recent Developments
- 11.2.3.5. Financials (Based on Availability)
- 11.2.4 Inotiv
- 11.2.4.1. Overview
- 11.2.4.2. Products
- 11.2.4.3. SWOT Analysis
- 11.2.4.4. Recent Developments
- 11.2.4.5. Financials (Based on Availability)
- 11.2.5 Simulations Plus
- 11.2.5.1. Overview
- 11.2.5.2. Products
- 11.2.5.3. SWOT Analysis
- 11.2.5.4. Recent Developments
- 11.2.5.5. Financials (Based on Availability)
- 11.2.6 Schrodinger
- 11.2.6.1. Overview
- 11.2.6.2. Products
- 11.2.6.3. SWOT Analysis
- 11.2.6.4. Recent Developments
- 11.2.6.5. Financials (Based on Availability)
- 11.2.7 Aclaris
- 11.2.7.1. Overview
- 11.2.7.2. Products
- 11.2.7.3. SWOT Analysis
- 11.2.7.4. Recent Developments
- 11.2.7.5. Financials (Based on Availability)
- 11.2.8 Evogene
- 11.2.8.1. Overview
- 11.2.8.2. Products
- 11.2.8.3. SWOT Analysis
- 11.2.8.4. Recent Developments
- 11.2.8.5. Financials (Based on Availability)
- 11.2.9 Deciphex
- 11.2.9.1. Overview
- 11.2.9.2. Products
- 11.2.9.3. SWOT Analysis
- 11.2.9.4. Recent Developments
- 11.2.9.5. Financials (Based on Availability)
- 11.2.10 Exscientia
- 11.2.10.1. Overview
- 11.2.10.2. Products
- 11.2.10.3. SWOT Analysis
- 11.2.10.4. Recent Developments
- 11.2.10.5. Financials (Based on Availability)
- 11.2.1 Instem
List of Figures
- Figure 1: Global Web-services Toxicity Estimation Software Tool Revenue Breakdown (undefined, %) by Region 2025 & 2033
- Figure 2: North America Web-services Toxicity Estimation Software Tool Revenue (undefined), by Application 2025 & 2033
- Figure 3: North America Web-services Toxicity Estimation Software Tool Revenue Share (%), by Application 2025 & 2033
- Figure 4: North America Web-services Toxicity Estimation Software Tool Revenue (undefined), by Types 2025 & 2033
- Figure 5: North America Web-services Toxicity Estimation Software Tool Revenue Share (%), by Types 2025 & 2033
- Figure 6: North America Web-services Toxicity Estimation Software Tool Revenue (undefined), by Country 2025 & 2033
- Figure 7: North America Web-services Toxicity Estimation Software Tool Revenue Share (%), by Country 2025 & 2033
- Figure 8: South America Web-services Toxicity Estimation Software Tool Revenue (undefined), by Application 2025 & 2033
- Figure 9: South America Web-services Toxicity Estimation Software Tool Revenue Share (%), by Application 2025 & 2033
- Figure 10: South America Web-services Toxicity Estimation Software Tool Revenue (undefined), by Types 2025 & 2033
- Figure 11: South America Web-services Toxicity Estimation Software Tool Revenue Share (%), by Types 2025 & 2033
- Figure 12: South America Web-services Toxicity Estimation Software Tool Revenue (undefined), by Country 2025 & 2033
- Figure 13: South America Web-services Toxicity Estimation Software Tool Revenue Share (%), by Country 2025 & 2033
- Figure 14: Europe Web-services Toxicity Estimation Software Tool Revenue (undefined), by Application 2025 & 2033
- Figure 15: Europe Web-services Toxicity Estimation Software Tool Revenue Share (%), by Application 2025 & 2033
- Figure 16: Europe Web-services Toxicity Estimation Software Tool Revenue (undefined), by Types 2025 & 2033
- Figure 17: Europe Web-services Toxicity Estimation Software Tool Revenue Share (%), by Types 2025 & 2033
- Figure 18: Europe Web-services Toxicity Estimation Software Tool Revenue (undefined), by Country 2025 & 2033
- Figure 19: Europe Web-services Toxicity Estimation Software Tool Revenue Share (%), by Country 2025 & 2033
- Figure 20: Middle East & Africa Web-services Toxicity Estimation Software Tool Revenue (undefined), by Application 2025 & 2033
- Figure 21: Middle East & Africa Web-services Toxicity Estimation Software Tool Revenue Share (%), by Application 2025 & 2033
- Figure 22: Middle East & Africa Web-services Toxicity Estimation Software Tool Revenue (undefined), by Types 2025 & 2033
- Figure 23: Middle East & Africa Web-services Toxicity Estimation Software Tool Revenue Share (%), by Types 2025 & 2033
- Figure 24: Middle East & Africa Web-services Toxicity Estimation Software Tool Revenue (undefined), by Country 2025 & 2033
- Figure 25: Middle East & Africa Web-services Toxicity Estimation Software Tool Revenue Share (%), by Country 2025 & 2033
- Figure 26: Asia Pacific Web-services Toxicity Estimation Software Tool Revenue (undefined), by Application 2025 & 2033
- Figure 27: Asia Pacific Web-services Toxicity Estimation Software Tool Revenue Share (%), by Application 2025 & 2033
- Figure 28: Asia Pacific Web-services Toxicity Estimation Software Tool Revenue (undefined), by Types 2025 & 2033
- Figure 29: Asia Pacific Web-services Toxicity Estimation Software Tool Revenue Share (%), by Types 2025 & 2033
- Figure 30: Asia Pacific Web-services Toxicity Estimation Software Tool Revenue (undefined), by Country 2025 & 2033
- Figure 31: Asia Pacific Web-services Toxicity Estimation Software Tool Revenue Share (%), by Country 2025 & 2033
List of Tables
- Table 1: Global Web-services Toxicity Estimation Software Tool Revenue undefined Forecast, by Application 2020 & 2033
- Table 2: Global Web-services Toxicity Estimation Software Tool Revenue undefined Forecast, by Types 2020 & 2033
- Table 3: Global Web-services Toxicity Estimation Software Tool Revenue undefined Forecast, by Region 2020 & 2033
- Table 4: Global Web-services Toxicity Estimation Software Tool Revenue undefined Forecast, by Application 2020 & 2033
- Table 5: Global Web-services Toxicity Estimation Software Tool Revenue undefined Forecast, by Types 2020 & 2033
- Table 6: Global Web-services Toxicity Estimation Software Tool Revenue undefined Forecast, by Country 2020 & 2033
- Table 7: United States Web-services Toxicity Estimation Software Tool Revenue (undefined) Forecast, by Application 2020 & 2033
- Table 8: Canada Web-services Toxicity Estimation Software Tool Revenue (undefined) Forecast, by Application 2020 & 2033
- Table 9: Mexico Web-services Toxicity Estimation Software Tool Revenue (undefined) Forecast, by Application 2020 & 2033
- Table 10: Global Web-services Toxicity Estimation Software Tool Revenue undefined Forecast, by Application 2020 & 2033
- Table 11: Global Web-services Toxicity Estimation Software Tool Revenue undefined Forecast, by Types 2020 & 2033
- Table 12: Global Web-services Toxicity Estimation Software Tool Revenue undefined Forecast, by Country 2020 & 2033
- Table 13: Brazil Web-services Toxicity Estimation Software Tool Revenue (undefined) Forecast, by Application 2020 & 2033
- Table 14: Argentina Web-services Toxicity Estimation Software Tool Revenue (undefined) Forecast, by Application 2020 & 2033
- Table 15: Rest of South America Web-services Toxicity Estimation Software Tool Revenue (undefined) Forecast, by Application 2020 & 2033
- Table 16: Global Web-services Toxicity Estimation Software Tool Revenue undefined Forecast, by Application 2020 & 2033
- Table 17: Global Web-services Toxicity Estimation Software Tool Revenue undefined Forecast, by Types 2020 & 2033
- Table 18: Global Web-services Toxicity Estimation Software Tool Revenue undefined Forecast, by Country 2020 & 2033
- Table 19: United Kingdom Web-services Toxicity Estimation Software Tool Revenue (undefined) Forecast, by Application 2020 & 2033
- Table 20: Germany Web-services Toxicity Estimation Software Tool Revenue (undefined) Forecast, by Application 2020 & 2033
- Table 21: France Web-services Toxicity Estimation Software Tool Revenue (undefined) Forecast, by Application 2020 & 2033
- Table 22: Italy Web-services Toxicity Estimation Software Tool Revenue (undefined) Forecast, by Application 2020 & 2033
- Table 23: Spain Web-services Toxicity Estimation Software Tool Revenue (undefined) Forecast, by Application 2020 & 2033
- Table 24: Russia Web-services Toxicity Estimation Software Tool Revenue (undefined) Forecast, by Application 2020 & 2033
- Table 25: Benelux Web-services Toxicity Estimation Software Tool Revenue (undefined) Forecast, by Application 2020 & 2033
- Table 26: Nordics Web-services Toxicity Estimation Software Tool Revenue (undefined) Forecast, by Application 2020 & 2033
- Table 27: Rest of Europe Web-services Toxicity Estimation Software Tool Revenue (undefined) Forecast, by Application 2020 & 2033
- Table 28: Global Web-services Toxicity Estimation Software Tool Revenue undefined Forecast, by Application 2020 & 2033
- Table 29: Global Web-services Toxicity Estimation Software Tool Revenue undefined Forecast, by Types 2020 & 2033
- Table 30: Global Web-services Toxicity Estimation Software Tool Revenue undefined Forecast, by Country 2020 & 2033
- Table 31: Turkey Web-services Toxicity Estimation Software Tool Revenue (undefined) Forecast, by Application 2020 & 2033
- Table 32: Israel Web-services Toxicity Estimation Software Tool Revenue (undefined) Forecast, by Application 2020 & 2033
- Table 33: GCC Web-services Toxicity Estimation Software Tool Revenue (undefined) Forecast, by Application 2020 & 2033
- Table 34: North Africa Web-services Toxicity Estimation Software Tool Revenue (undefined) Forecast, by Application 2020 & 2033
- Table 35: South Africa Web-services Toxicity Estimation Software Tool Revenue (undefined) Forecast, by Application 2020 & 2033
- Table 36: Rest of Middle East & Africa Web-services Toxicity Estimation Software Tool Revenue (undefined) Forecast, by Application 2020 & 2033
- Table 37: Global Web-services Toxicity Estimation Software Tool Revenue undefined Forecast, by Application 2020 & 2033
- Table 38: Global Web-services Toxicity Estimation Software Tool Revenue undefined Forecast, by Types 2020 & 2033
- Table 39: Global Web-services Toxicity Estimation Software Tool Revenue undefined Forecast, by Country 2020 & 2033
- Table 40: China Web-services Toxicity Estimation Software Tool Revenue (undefined) Forecast, by Application 2020 & 2033
- Table 41: India Web-services Toxicity Estimation Software Tool Revenue (undefined) Forecast, by Application 2020 & 2033
- Table 42: Japan Web-services Toxicity Estimation Software Tool Revenue (undefined) Forecast, by Application 2020 & 2033
- Table 43: South Korea Web-services Toxicity Estimation Software Tool Revenue (undefined) Forecast, by Application 2020 & 2033
- Table 44: ASEAN Web-services Toxicity Estimation Software Tool Revenue (undefined) Forecast, by Application 2020 & 2033
- Table 45: Oceania Web-services Toxicity Estimation Software Tool Revenue (undefined) Forecast, by Application 2020 & 2033
- Table 46: Rest of Asia Pacific Web-services Toxicity Estimation Software Tool Revenue (undefined) Forecast, by Application 2020 & 2033
Frequently Asked Questions
1. What is the projected Compound Annual Growth Rate (CAGR) of the Web-services Toxicity Estimation Software Tool?
The projected CAGR is approximately 10.6%.
2. Which companies are prominent players in the Web-services Toxicity Estimation Software Tool?
Key companies in the market include Instem, Lhasa, MultiCASE, Inotiv, Simulations Plus, Schrodinger, Aclaris, Evogene, Deciphex, Exscientia.
3. What are the main segments of the Web-services Toxicity Estimation Software Tool?
The market segments include Application, Types.
4. Can you provide details about the market size?
The market size is estimated to be USD XXX N/A as of 2022.
5. What are some drivers contributing to market growth?
N/A
6. What are the notable trends driving market growth?
N/A
7. Are there any restraints impacting market growth?
N/A
8. Can you provide examples of recent developments in the market?
N/A
9. What pricing options are available for accessing the report?
Pricing options include single-user, multi-user, and enterprise licenses priced at USD 4900.00, USD 7350.00, and USD 9800.00 respectively.
10. Is the market size provided in terms of value or volume?
The market size is provided in terms of value, measured in N/A.
11. Are there any specific market keywords associated with the report?
Yes, the market keyword associated with the report is "Web-services Toxicity Estimation Software Tool," which aids in identifying and referencing the specific market segment covered.
12. How do I determine which pricing option suits my needs best?
The pricing options vary based on user requirements and access needs. Individual users may opt for single-user licenses, while businesses requiring broader access may choose multi-user or enterprise licenses for cost-effective access to the report.
13. Are there any additional resources or data provided in the Web-services Toxicity Estimation Software Tool report?
While the report offers comprehensive insights, it's advisable to review the specific contents or supplementary materials provided to ascertain if additional resources or data are available.
14. How can I stay updated on further developments or reports in the Web-services Toxicity Estimation Software Tool?
To stay informed about further developments, trends, and reports in the Web-services Toxicity Estimation Software Tool, consider subscribing to industry newsletters, following relevant companies and organizations, or regularly checking reputable industry news sources and publications.
Methodology
Step 1 - Identification of Relevant Samples Size from Population Database


Step 2 - Approaches for Defining Global Market Size (Value, Volume* & Price*)

Note*: In applicable scenarios
Step 3 - Data Sources
Primary Research
- Web Analytics
- Survey Reports
- Research Institute
- Latest Research Reports
- Opinion Leaders
Secondary Research
- Annual Reports
- White Paper
- Latest Press Release
- Industry Association
- Paid Database
- Investor Presentations

Step 4 - Data Triangulation
Involves using different sources of information in order to increase the validity of a study
These sources are likely to be stakeholders in a program - participants, other researchers, program staff, other community members, and so on.
Then we put all data in single framework & apply various statistical tools to find out the dynamic on the market.
During the analysis stage, feedback from the stakeholder groups would be compared to determine areas of agreement as well as areas of divergence