

Key Insights
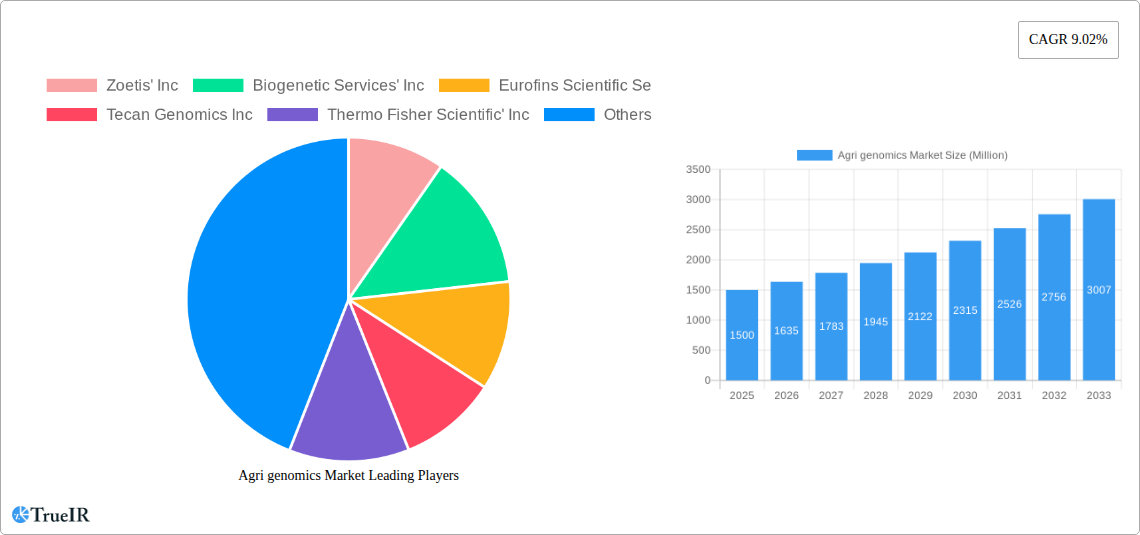
The Agri-genomics market is experiencing robust growth, driven by the increasing demand for higher crop yields, improved livestock productivity, and enhanced food security globally. A compound annual growth rate (CAGR) of 9.02% from 2019 to 2024 suggests a significant market expansion. This growth is fueled by several factors. Technological advancements in areas like Next-Generation Sequencing (NGS) and Real-Time PCR (qPCR) are enabling faster, more accurate, and cost-effective genetic analysis. Furthermore, the rising adoption of precision agriculture techniques, coupled with increasing government initiatives supporting agricultural biotechnology, is further stimulating market expansion. The key application segments – crops and livestock – are witnessing significant investments in genomic research to improve disease resistance, enhance nutritional value, and optimize breeding strategies. Genotyping and DNA fingerprinting services are particularly in high demand, offering valuable insights into genetic diversity and purity. While challenges remain, such as the high cost of advanced technologies and the need for skilled professionals, the overall market outlook remains positive, projected to continue its upward trajectory through 2033.
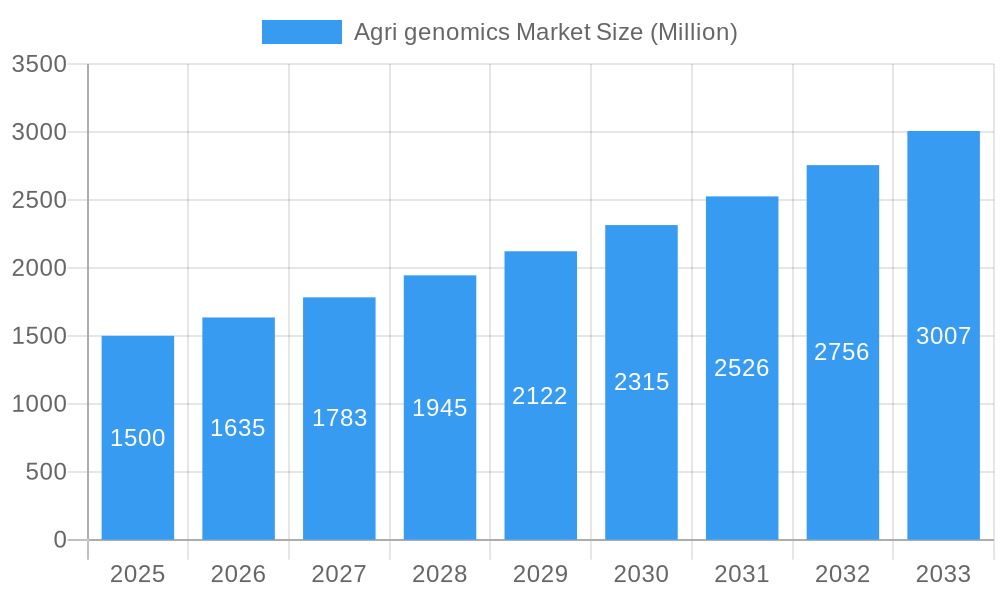
Agri genomics Market Market Size (In Billion)
The market is segmented by technology (Real-Time PCR (qPCR), Microarrays, Next Generation Sequencing, Capillary Electrophoresis, and Other Technologies), application (Crops and Livestock), and service offerings (Genotyping, DNA Fingerprinting, Assessment of Genetic Purity, Trait Purity Assessment, Gene Expression Analysis, and Other Service Offerings). North America and Europe currently hold significant market shares, driven by established research infrastructure and advanced technological adoption. However, the Asia-Pacific region is anticipated to exhibit the fastest growth rate in the coming years, fueled by increasing agricultural investments and a growing demand for improved food production in rapidly developing economies. Companies like Zoetis, Biogenetic Services, Eurofins Scientific, and Illumina are key players, shaping market dynamics through innovation and strategic partnerships. The future of Agri-genomics is bright, promising further advancements in genomic technologies and their applications to address global food security challenges and enhance agricultural sustainability.
Agri genomics Market Company Market Share
Agri genomics Market: A Comprehensive Market Analysis Report (2019-2033)
This dynamic report provides a deep dive into the Agri genomics Market, offering invaluable insights for stakeholders across the agricultural biotechnology landscape. Covering the period from 2019 to 2033, with a focus on 2025, this study analyzes market structure, competitive dynamics, technological advancements, and future growth potential. The report leverages extensive data analysis and expert insights to provide a comprehensive overview of this rapidly evolving market, projected to reach xx Million by 2033.
Agri genomics Market Market Structure & Competitive Landscape
The Agri genomics Market exhibits a moderately concentrated structure, with key players such as Illumina, Thermo Fisher Scientific, and Zoetis holding significant market share. However, the market is also characterized by a considerable number of smaller players, particularly in specialized service offerings. Innovation is a crucial driver, with continuous advancements in sequencing technologies and bioinformatics analysis fueling market growth. Regulatory landscapes vary across different geographies, influencing market access and adoption rates. Product substitution is limited, given the specialized nature of agri-genomics technologies. The end-user segment is broadly categorized into crops and livestock, each with unique technological and application requirements. M&A activity has been relatively modest in recent years, with a total estimated volume of xx Million in deals during the historical period (2019-2024). The Herfindahl-Hirschman Index (HHI) is estimated at xx, indicating a moderately concentrated market.
- Market Concentration: Moderately concentrated, with a few dominant players and numerous smaller firms.
- Innovation Drivers: Advancements in NGS, bioinformatics, and data analytics.
- Regulatory Impacts: Varying regulations across regions impacting market entry and product approvals.
- Product Substitutes: Limited direct substitutes due to the specialized nature of technologies.
- End-User Segmentation: Primarily crops and livestock, each having specific genomic needs.
- M&A Trends: Moderate activity in recent years, xx Million in total deal value (2019-2024).
Agri genomics Market Market Trends & Opportunities
The Agri genomics Market is experiencing robust growth, driven by increasing demand for high-yielding, disease-resistant, and climate-resilient crops and livestock. The market size is estimated at xx Million in 2025, exhibiting a CAGR of xx% during the forecast period (2025-2033). Technological advancements, particularly in next-generation sequencing (NGS), are significantly enhancing the speed, accuracy, and affordability of genomic analysis. Consumer preferences are increasingly shifting towards sustainably produced food, creating a demand for precision breeding technologies offered by agri-genomics. The competitive landscape is dynamic, with both established players and emerging companies vying for market share through innovation and strategic partnerships. Market penetration rates for NGS technology in agriculture are steadily increasing, currently at approximately xx%, indicating significant growth potential.
Dominant Markets & Segments in Agri genomics Market
The North American region currently holds the largest market share in Agri genomics, followed by Europe and Asia-Pacific. Within the technology segment, Next-Generation Sequencing (NGS) is the fastest-growing and dominant technology due to its high throughput and cost-effectiveness. The application segment shows a near-even split between crops and livestock, with both witnessing significant growth. Genotyping is the leading service offering within the market.
Key Growth Drivers:
- North America: Strong R&D investment, advanced agricultural infrastructure, and early adoption of new technologies.
- Europe: Growing focus on sustainable agriculture and stringent regulations driving adoption of precision breeding techniques.
- Asia-Pacific: Rapid economic growth, increasing agricultural production, and government support for technological advancements.
Market Dominance Analysis:
- Technology: NGS is dominant due to cost-effectiveness and high throughput capabilities.
- Application: Crops and livestock sectors show comparable growth, driven by demand for improved yields and disease resistance.
- Service Offerings: Genotyping holds a significant market share, owing to its broad applications in crop and livestock improvement.
Agri genomics Market Product Analysis
Product innovation in Agri genomics is primarily focused on enhancing the speed, accuracy, and cost-effectiveness of genomic analysis. NGS-based platforms are at the forefront of these advancements, offering high throughput and detailed genomic information. Microarray technology remains relevant for specific applications, while real-time PCR continues to be valuable for targeted gene expression analysis. The competitive advantage lies in offering comprehensive solutions encompassing advanced technologies, data analytics, and specialized services.
Key Drivers, Barriers & Challenges in Agri genomics Market
Key Drivers:
- Technological advancements in sequencing and bioinformatics are lowering costs and increasing the accessibility of agri-genomics technologies.
- Growing consumer demand for sustainable and high-quality agricultural products drives the need for improved crop and livestock varieties.
- Government regulations and policies in many countries promote the adoption of precision agriculture techniques.
Key Challenges and Restraints:
- High initial investment costs for implementing agri-genomics technologies can be a barrier for smaller agricultural businesses.
- Regulatory hurdles and complex approval processes for genetically modified organisms (GMOs) can hinder market growth.
- Intense competition amongst established players and emerging companies creates pressures on pricing and profitability.
Growth Drivers in the Agri genomics Market Market
The Agri genomics market is propelled by technological advancements, particularly in NGS and bioinformatics. Increasing demand for improved crop yields and disease resistance, coupled with government support for precision agriculture, further fuels growth. The rising consumer awareness of sustainable food production practices creates a positive market dynamic.
Challenges Impacting Agri genomics Market Growth
High initial investment costs, regulatory complexities surrounding GMOs, and intense competition among established and emerging players pose significant challenges. Supply chain disruptions and a skilled labor shortage also impede market growth.
Key Players Shaping the Agri genomics Market Market
- Zoetis' Inc
- Biogenetic Services' Inc
- Eurofins Scientific Se
- Tecan Genomics Inc
- Thermo Fisher Scientific' Inc
- Galseq Srl Via Italia
- Arbor Biosciences
- Agrigenomics' Inc
- Neogen Corporation
- Illumina' Inc
Significant Agri genomics Market Industry Milestones
- February 2023: Tecan Genomics Inc. collaborated with Singular Genomics to integrate its MagicPrep NGS system with Singular’s G4 sequencing platform, streamlining library preparation. This collaboration significantly improves the efficiency of NGS workflows.
- February 2021: Thermo Fisher Scientific Inc. acquired cell sorting technology from Propel Labs, strengthening its position in cell analysis and cell therapy research, indirectly bolstering its capabilities in agri-genomics.
Future Outlook for Agri genomics Market Market
The Agri genomics Market is poised for significant growth, driven by continued technological advancements, increasing demand for sustainable food production, and supportive government policies. Strategic partnerships and collaborations among key players will further accelerate innovation and market expansion. The market is projected to witness robust growth, creating numerous opportunities for players across the value chain.
Agri genomics Market Segmentation
- 1. Production Analysis
- 2. Consumption Analysis
- 3. Import Market Analysis (Value & Volume)
- 4. Export Market Analysis (Value & Volume)
- 5. Price Trend Analysis
Agri genomics Market Segmentation By Geography
-
1. North America
- 1.1. United States
- 1.2. Canada
- 1.3. Mexico
-
2. South America
- 2.1. Brazil
- 2.2. Argentina
- 2.3. Rest of South America
-
3. Europe
- 3.1. United Kingdom
- 3.2. Germany
- 3.3. France
- 3.4. Italy
- 3.5. Spain
- 3.6. Russia
- 3.7. Benelux
- 3.8. Nordics
- 3.9. Rest of Europe
-
4. Middle East & Africa
- 4.1. Turkey
- 4.2. Israel
- 4.3. GCC
- 4.4. North Africa
- 4.5. South Africa
- 4.6. Rest of Middle East & Africa
-
5. Asia Pacific
- 5.1. China
- 5.2. India
- 5.3. Japan
- 5.4. South Korea
- 5.5. ASEAN
- 5.6. Oceania
- 5.7. Rest of Asia Pacific
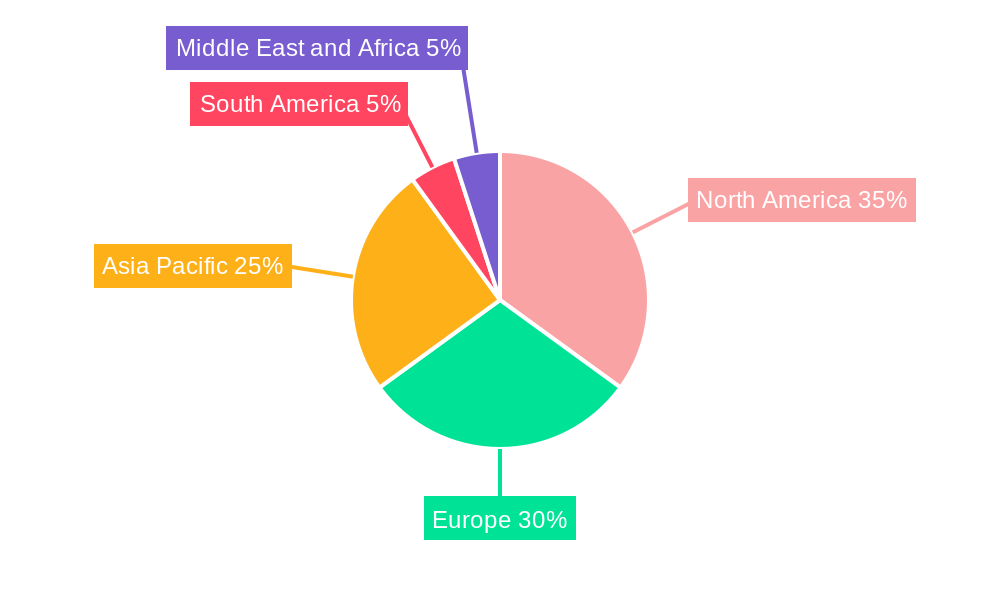
Agri genomics Market Regional Market Share
Geographic Coverage of Agri genomics Market
Agri genomics Market REPORT HIGHLIGHTS
| Aspects | Details |
|---|---|
| Study Period | 2020-2034 |
| Base Year | 2025 |
| Estimated Year | 2026 |
| Forecast Period | 2026-2034 |
| Historical Period | 2020-2025 |
| Growth Rate | CAGR of 9.7% from 2020-2034 |
| Segmentation |
|
Table of Contents
- 1. Introduction
- 1.1. Research Scope
- 1.2. Market Segmentation
- 1.3. Research Objective
- 1.4. Definitions and Assumptions
- 2. Executive Summary
- 2.1. Market Snapshot
- 3. Market Dynamics
- 3.1. Market Drivers
- 3.2. Market Restrains
- 3.3. Market Trends
- 3.4. Market Opportunities
- 4. Market Factor Analysis
- 4.1. Porters Five Forces
- 4.1.1. Bargaining Power of Suppliers
- 4.1.2. Bargaining Power of Buyers
- 4.1.3. Threat of New Entrants
- 4.1.4. Threat of Substitutes
- 4.1.5. Competitive Rivalry
- 4.2. PESTEL analysis
- 4.3. BCG Analysis
- 4.3.1. Stars (High Growth, High Market Share)
- 4.3.2. Cash Cows (Low Growth, High Market Share)
- 4.3.3. Question Mark (High Growth, Low Market Share)
- 4.3.4. Dogs (Low Growth, Low Market Share)
- 4.4. Ansoff Matrix Analysis
- 4.5. Supply Chain Analysis
- 4.6. Regulatory Landscape
- 4.7. Current Market Potential and Opportunity Assessment (TAM–SAM–SOM Framework)
- 4.8. TIR Analyst Note
- 4.1. Porters Five Forces
- 5. Market Analysis, Insights and Forecast 2021-2033
- 5.1. Market Analysis, Insights and Forecast - by Production Analysis
- 5.2. Market Analysis, Insights and Forecast - by Consumption Analysis
- 5.3. Market Analysis, Insights and Forecast - by Import Market Analysis (Value & Volume)
- 5.4. Market Analysis, Insights and Forecast - by Export Market Analysis (Value & Volume)
- 5.5. Market Analysis, Insights and Forecast - by Price Trend Analysis
- 5.6. Market Analysis, Insights and Forecast - by Region
- 5.6.1. North America
- 5.6.2. South America
- 5.6.3. Europe
- 5.6.4. Middle East & Africa
- 5.6.5. Asia Pacific
- 6. Global Agri genomics Market Analysis, Insights and Forecast, 2021-2033
- 6.1. Market Analysis, Insights and Forecast - by Production Analysis
- 6.2. Market Analysis, Insights and Forecast - by Consumption Analysis
- 6.3. Market Analysis, Insights and Forecast - by Import Market Analysis (Value & Volume)
- 6.4. Market Analysis, Insights and Forecast - by Export Market Analysis (Value & Volume)
- 6.5. Market Analysis, Insights and Forecast - by Price Trend Analysis
- 7. North America Agri genomics Market Analysis, Insights and Forecast, 2020-2032
- 7.1. Market Analysis, Insights and Forecast - by Production Analysis
- 7.2. Market Analysis, Insights and Forecast - by Consumption Analysis
- 7.3. Market Analysis, Insights and Forecast - by Import Market Analysis (Value & Volume)
- 7.4. Market Analysis, Insights and Forecast - by Export Market Analysis (Value & Volume)
- 7.5. Market Analysis, Insights and Forecast - by Price Trend Analysis
- 8. South America Agri genomics Market Analysis, Insights and Forecast, 2020-2032
- 8.1. Market Analysis, Insights and Forecast - by Production Analysis
- 8.2. Market Analysis, Insights and Forecast - by Consumption Analysis
- 8.3. Market Analysis, Insights and Forecast - by Import Market Analysis (Value & Volume)
- 8.4. Market Analysis, Insights and Forecast - by Export Market Analysis (Value & Volume)
- 8.5. Market Analysis, Insights and Forecast - by Price Trend Analysis
- 9. Europe Agri genomics Market Analysis, Insights and Forecast, 2020-2032
- 9.1. Market Analysis, Insights and Forecast - by Production Analysis
- 9.2. Market Analysis, Insights and Forecast - by Consumption Analysis
- 9.3. Market Analysis, Insights and Forecast - by Import Market Analysis (Value & Volume)
- 9.4. Market Analysis, Insights and Forecast - by Export Market Analysis (Value & Volume)
- 9.5. Market Analysis, Insights and Forecast - by Price Trend Analysis
- 10. Middle East & Africa Agri genomics Market Analysis, Insights and Forecast, 2020-2032
- 10.1. Market Analysis, Insights and Forecast - by Production Analysis
- 10.2. Market Analysis, Insights and Forecast - by Consumption Analysis
- 10.3. Market Analysis, Insights and Forecast - by Import Market Analysis (Value & Volume)
- 10.4. Market Analysis, Insights and Forecast - by Export Market Analysis (Value & Volume)
- 10.5. Market Analysis, Insights and Forecast - by Price Trend Analysis
- 11. Asia Pacific Agri genomics Market Analysis, Insights and Forecast, 2020-2032
- 11.1. Market Analysis, Insights and Forecast - by Production Analysis
- 11.2. Market Analysis, Insights and Forecast - by Consumption Analysis
- 11.3. Market Analysis, Insights and Forecast - by Import Market Analysis (Value & Volume)
- 11.4. Market Analysis, Insights and Forecast - by Export Market Analysis (Value & Volume)
- 11.5. Market Analysis, Insights and Forecast - by Price Trend Analysis
- 12. Competitive Analysis
- 12.1. Company Profiles
- 12.1.1 Zoetis' Inc
- 12.1.1.1. Company Overview
- 12.1.1.2. Products
- 12.1.1.3. Company Financials
- 12.1.1.4. SWOT Analysis
- 12.1.2 Biogenetic Services' Inc
- 12.1.2.1. Company Overview
- 12.1.2.2. Products
- 12.1.2.3. Company Financials
- 12.1.2.4. SWOT Analysis
- 12.1.3 Eurofins Scientific Se
- 12.1.3.1. Company Overview
- 12.1.3.2. Products
- 12.1.3.3. Company Financials
- 12.1.3.4. SWOT Analysis
- 12.1.4 Tecan Genomics Inc
- 12.1.4.1. Company Overview
- 12.1.4.2. Products
- 12.1.4.3. Company Financials
- 12.1.4.4. SWOT Analysis
- 12.1.5 Thermo Fisher Scientific' Inc
- 12.1.5.1. Company Overview
- 12.1.5.2. Products
- 12.1.5.3. Company Financials
- 12.1.5.4. SWOT Analysis
- 12.1.6 Galseq Srl Via Italia
- 12.1.6.1. Company Overview
- 12.1.6.2. Products
- 12.1.6.3. Company Financials
- 12.1.6.4. SWOT Analysis
- 12.1.7 Arbor Biosciences
- 12.1.7.1. Company Overview
- 12.1.7.2. Products
- 12.1.7.3. Company Financials
- 12.1.7.4. SWOT Analysis
- 12.1.8 Agrigenomics' Inc
- 12.1.8.1. Company Overview
- 12.1.8.2. Products
- 12.1.8.3. Company Financials
- 12.1.8.4. SWOT Analysis
- 12.1.9 Neogen Corporation
- 12.1.9.1. Company Overview
- 12.1.9.2. Products
- 12.1.9.3. Company Financials
- 12.1.9.4. SWOT Analysis
- 12.1.10 Illumina' Inc
- 12.1.10.1. Company Overview
- 12.1.10.2. Products
- 12.1.10.3. Company Financials
- 12.1.10.4. SWOT Analysis
- 12.1.1 Zoetis' Inc
- 12.2. Market Entropy
- 12.2.1 Company's Key Areas Served
- 12.2.2 Recent Developments
- 12.3. Company Market Share Analysis 2025
- 12.3.1 Top 5 Companies Market Share Analysis
- 12.3.2 Top 3 Companies Market Share Analysis
- 12.4. List of Potential Customers
- 13. Research Methodology
List of Figures
- Figure 1: Global Agri genomics Market Revenue Breakdown (billion, %) by Region 2025 & 2033
- Figure 2: North America Agri genomics Market Revenue (billion), by Production Analysis 2025 & 2033
- Figure 3: North America Agri genomics Market Revenue Share (%), by Production Analysis 2025 & 2033
- Figure 4: North America Agri genomics Market Revenue (billion), by Consumption Analysis 2025 & 2033
- Figure 5: North America Agri genomics Market Revenue Share (%), by Consumption Analysis 2025 & 2033
- Figure 6: North America Agri genomics Market Revenue (billion), by Import Market Analysis (Value & Volume) 2025 & 2033
- Figure 7: North America Agri genomics Market Revenue Share (%), by Import Market Analysis (Value & Volume) 2025 & 2033
- Figure 8: North America Agri genomics Market Revenue (billion), by Export Market Analysis (Value & Volume) 2025 & 2033
- Figure 9: North America Agri genomics Market Revenue Share (%), by Export Market Analysis (Value & Volume) 2025 & 2033
- Figure 10: North America Agri genomics Market Revenue (billion), by Price Trend Analysis 2025 & 2033
- Figure 11: North America Agri genomics Market Revenue Share (%), by Price Trend Analysis 2025 & 2033
- Figure 12: North America Agri genomics Market Revenue (billion), by Country 2025 & 2033
- Figure 13: North America Agri genomics Market Revenue Share (%), by Country 2025 & 2033
- Figure 14: South America Agri genomics Market Revenue (billion), by Production Analysis 2025 & 2033
- Figure 15: South America Agri genomics Market Revenue Share (%), by Production Analysis 2025 & 2033
- Figure 16: South America Agri genomics Market Revenue (billion), by Consumption Analysis 2025 & 2033
- Figure 17: South America Agri genomics Market Revenue Share (%), by Consumption Analysis 2025 & 2033
- Figure 18: South America Agri genomics Market Revenue (billion), by Import Market Analysis (Value & Volume) 2025 & 2033
- Figure 19: South America Agri genomics Market Revenue Share (%), by Import Market Analysis (Value & Volume) 2025 & 2033
- Figure 20: South America Agri genomics Market Revenue (billion), by Export Market Analysis (Value & Volume) 2025 & 2033
- Figure 21: South America Agri genomics Market Revenue Share (%), by Export Market Analysis (Value & Volume) 2025 & 2033
- Figure 22: South America Agri genomics Market Revenue (billion), by Price Trend Analysis 2025 & 2033
- Figure 23: South America Agri genomics Market Revenue Share (%), by Price Trend Analysis 2025 & 2033
- Figure 24: South America Agri genomics Market Revenue (billion), by Country 2025 & 2033
- Figure 25: South America Agri genomics Market Revenue Share (%), by Country 2025 & 2033
- Figure 26: Europe Agri genomics Market Revenue (billion), by Production Analysis 2025 & 2033
- Figure 27: Europe Agri genomics Market Revenue Share (%), by Production Analysis 2025 & 2033
- Figure 28: Europe Agri genomics Market Revenue (billion), by Consumption Analysis 2025 & 2033
- Figure 29: Europe Agri genomics Market Revenue Share (%), by Consumption Analysis 2025 & 2033
- Figure 30: Europe Agri genomics Market Revenue (billion), by Import Market Analysis (Value & Volume) 2025 & 2033
- Figure 31: Europe Agri genomics Market Revenue Share (%), by Import Market Analysis (Value & Volume) 2025 & 2033
- Figure 32: Europe Agri genomics Market Revenue (billion), by Export Market Analysis (Value & Volume) 2025 & 2033
- Figure 33: Europe Agri genomics Market Revenue Share (%), by Export Market Analysis (Value & Volume) 2025 & 2033
- Figure 34: Europe Agri genomics Market Revenue (billion), by Price Trend Analysis 2025 & 2033
- Figure 35: Europe Agri genomics Market Revenue Share (%), by Price Trend Analysis 2025 & 2033
- Figure 36: Europe Agri genomics Market Revenue (billion), by Country 2025 & 2033
- Figure 37: Europe Agri genomics Market Revenue Share (%), by Country 2025 & 2033
- Figure 38: Middle East & Africa Agri genomics Market Revenue (billion), by Production Analysis 2025 & 2033
- Figure 39: Middle East & Africa Agri genomics Market Revenue Share (%), by Production Analysis 2025 & 2033
- Figure 40: Middle East & Africa Agri genomics Market Revenue (billion), by Consumption Analysis 2025 & 2033
- Figure 41: Middle East & Africa Agri genomics Market Revenue Share (%), by Consumption Analysis 2025 & 2033
- Figure 42: Middle East & Africa Agri genomics Market Revenue (billion), by Import Market Analysis (Value & Volume) 2025 & 2033
- Figure 43: Middle East & Africa Agri genomics Market Revenue Share (%), by Import Market Analysis (Value & Volume) 2025 & 2033
- Figure 44: Middle East & Africa Agri genomics Market Revenue (billion), by Export Market Analysis (Value & Volume) 2025 & 2033
- Figure 45: Middle East & Africa Agri genomics Market Revenue Share (%), by Export Market Analysis (Value & Volume) 2025 & 2033
- Figure 46: Middle East & Africa Agri genomics Market Revenue (billion), by Price Trend Analysis 2025 & 2033
- Figure 47: Middle East & Africa Agri genomics Market Revenue Share (%), by Price Trend Analysis 2025 & 2033
- Figure 48: Middle East & Africa Agri genomics Market Revenue (billion), by Country 2025 & 2033
- Figure 49: Middle East & Africa Agri genomics Market Revenue Share (%), by Country 2025 & 2033
- Figure 50: Asia Pacific Agri genomics Market Revenue (billion), by Production Analysis 2025 & 2033
- Figure 51: Asia Pacific Agri genomics Market Revenue Share (%), by Production Analysis 2025 & 2033
- Figure 52: Asia Pacific Agri genomics Market Revenue (billion), by Consumption Analysis 2025 & 2033
- Figure 53: Asia Pacific Agri genomics Market Revenue Share (%), by Consumption Analysis 2025 & 2033
- Figure 54: Asia Pacific Agri genomics Market Revenue (billion), by Import Market Analysis (Value & Volume) 2025 & 2033
- Figure 55: Asia Pacific Agri genomics Market Revenue Share (%), by Import Market Analysis (Value & Volume) 2025 & 2033
- Figure 56: Asia Pacific Agri genomics Market Revenue (billion), by Export Market Analysis (Value & Volume) 2025 & 2033
- Figure 57: Asia Pacific Agri genomics Market Revenue Share (%), by Export Market Analysis (Value & Volume) 2025 & 2033
- Figure 58: Asia Pacific Agri genomics Market Revenue (billion), by Price Trend Analysis 2025 & 2033
- Figure 59: Asia Pacific Agri genomics Market Revenue Share (%), by Price Trend Analysis 2025 & 2033
- Figure 60: Asia Pacific Agri genomics Market Revenue (billion), by Country 2025 & 2033
- Figure 61: Asia Pacific Agri genomics Market Revenue Share (%), by Country 2025 & 2033
List of Tables
- Table 1: Global Agri genomics Market Revenue billion Forecast, by Production Analysis 2020 & 2033
- Table 2: Global Agri genomics Market Revenue billion Forecast, by Consumption Analysis 2020 & 2033
- Table 3: Global Agri genomics Market Revenue billion Forecast, by Import Market Analysis (Value & Volume) 2020 & 2033
- Table 4: Global Agri genomics Market Revenue billion Forecast, by Export Market Analysis (Value & Volume) 2020 & 2033
- Table 5: Global Agri genomics Market Revenue billion Forecast, by Price Trend Analysis 2020 & 2033
- Table 6: Global Agri genomics Market Revenue billion Forecast, by Region 2020 & 2033
- Table 7: Global Agri genomics Market Revenue billion Forecast, by Production Analysis 2020 & 2033
- Table 8: Global Agri genomics Market Revenue billion Forecast, by Consumption Analysis 2020 & 2033
- Table 9: Global Agri genomics Market Revenue billion Forecast, by Import Market Analysis (Value & Volume) 2020 & 2033
- Table 10: Global Agri genomics Market Revenue billion Forecast, by Export Market Analysis (Value & Volume) 2020 & 2033
- Table 11: Global Agri genomics Market Revenue billion Forecast, by Price Trend Analysis 2020 & 2033
- Table 12: Global Agri genomics Market Revenue billion Forecast, by Country 2020 & 2033
- Table 13: United States Agri genomics Market Revenue (billion) Forecast, by Application 2020 & 2033
- Table 14: Canada Agri genomics Market Revenue (billion) Forecast, by Application 2020 & 2033
- Table 15: Mexico Agri genomics Market Revenue (billion) Forecast, by Application 2020 & 2033
- Table 16: Global Agri genomics Market Revenue billion Forecast, by Production Analysis 2020 & 2033
- Table 17: Global Agri genomics Market Revenue billion Forecast, by Consumption Analysis 2020 & 2033
- Table 18: Global Agri genomics Market Revenue billion Forecast, by Import Market Analysis (Value & Volume) 2020 & 2033
- Table 19: Global Agri genomics Market Revenue billion Forecast, by Export Market Analysis (Value & Volume) 2020 & 2033
- Table 20: Global Agri genomics Market Revenue billion Forecast, by Price Trend Analysis 2020 & 2033
- Table 21: Global Agri genomics Market Revenue billion Forecast, by Country 2020 & 2033
- Table 22: Brazil Agri genomics Market Revenue (billion) Forecast, by Application 2020 & 2033
- Table 23: Argentina Agri genomics Market Revenue (billion) Forecast, by Application 2020 & 2033
- Table 24: Rest of South America Agri genomics Market Revenue (billion) Forecast, by Application 2020 & 2033
- Table 25: Global Agri genomics Market Revenue billion Forecast, by Production Analysis 2020 & 2033
- Table 26: Global Agri genomics Market Revenue billion Forecast, by Consumption Analysis 2020 & 2033
- Table 27: Global Agri genomics Market Revenue billion Forecast, by Import Market Analysis (Value & Volume) 2020 & 2033
- Table 28: Global Agri genomics Market Revenue billion Forecast, by Export Market Analysis (Value & Volume) 2020 & 2033
- Table 29: Global Agri genomics Market Revenue billion Forecast, by Price Trend Analysis 2020 & 2033
- Table 30: Global Agri genomics Market Revenue billion Forecast, by Country 2020 & 2033
- Table 31: United Kingdom Agri genomics Market Revenue (billion) Forecast, by Application 2020 & 2033
- Table 32: Germany Agri genomics Market Revenue (billion) Forecast, by Application 2020 & 2033
- Table 33: France Agri genomics Market Revenue (billion) Forecast, by Application 2020 & 2033
- Table 34: Italy Agri genomics Market Revenue (billion) Forecast, by Application 2020 & 2033
- Table 35: Spain Agri genomics Market Revenue (billion) Forecast, by Application 2020 & 2033
- Table 36: Russia Agri genomics Market Revenue (billion) Forecast, by Application 2020 & 2033
- Table 37: Benelux Agri genomics Market Revenue (billion) Forecast, by Application 2020 & 2033
- Table 38: Nordics Agri genomics Market Revenue (billion) Forecast, by Application 2020 & 2033
- Table 39: Rest of Europe Agri genomics Market Revenue (billion) Forecast, by Application 2020 & 2033
- Table 40: Global Agri genomics Market Revenue billion Forecast, by Production Analysis 2020 & 2033
- Table 41: Global Agri genomics Market Revenue billion Forecast, by Consumption Analysis 2020 & 2033
- Table 42: Global Agri genomics Market Revenue billion Forecast, by Import Market Analysis (Value & Volume) 2020 & 2033
- Table 43: Global Agri genomics Market Revenue billion Forecast, by Export Market Analysis (Value & Volume) 2020 & 2033
- Table 44: Global Agri genomics Market Revenue billion Forecast, by Price Trend Analysis 2020 & 2033
- Table 45: Global Agri genomics Market Revenue billion Forecast, by Country 2020 & 2033
- Table 46: Turkey Agri genomics Market Revenue (billion) Forecast, by Application 2020 & 2033
- Table 47: Israel Agri genomics Market Revenue (billion) Forecast, by Application 2020 & 2033
- Table 48: GCC Agri genomics Market Revenue (billion) Forecast, by Application 2020 & 2033
- Table 49: North Africa Agri genomics Market Revenue (billion) Forecast, by Application 2020 & 2033
- Table 50: South Africa Agri genomics Market Revenue (billion) Forecast, by Application 2020 & 2033
- Table 51: Rest of Middle East & Africa Agri genomics Market Revenue (billion) Forecast, by Application 2020 & 2033
- Table 52: Global Agri genomics Market Revenue billion Forecast, by Production Analysis 2020 & 2033
- Table 53: Global Agri genomics Market Revenue billion Forecast, by Consumption Analysis 2020 & 2033
- Table 54: Global Agri genomics Market Revenue billion Forecast, by Import Market Analysis (Value & Volume) 2020 & 2033
- Table 55: Global Agri genomics Market Revenue billion Forecast, by Export Market Analysis (Value & Volume) 2020 & 2033
- Table 56: Global Agri genomics Market Revenue billion Forecast, by Price Trend Analysis 2020 & 2033
- Table 57: Global Agri genomics Market Revenue billion Forecast, by Country 2020 & 2033
- Table 58: China Agri genomics Market Revenue (billion) Forecast, by Application 2020 & 2033
- Table 59: India Agri genomics Market Revenue (billion) Forecast, by Application 2020 & 2033
- Table 60: Japan Agri genomics Market Revenue (billion) Forecast, by Application 2020 & 2033
- Table 61: South Korea Agri genomics Market Revenue (billion) Forecast, by Application 2020 & 2033
- Table 62: ASEAN Agri genomics Market Revenue (billion) Forecast, by Application 2020 & 2033
- Table 63: Oceania Agri genomics Market Revenue (billion) Forecast, by Application 2020 & 2033
- Table 64: Rest of Asia Pacific Agri genomics Market Revenue (billion) Forecast, by Application 2020 & 2033
Frequently Asked Questions
1. What is the projected Compound Annual Growth Rate (CAGR) of the Agri genomics Market?
The projected CAGR is approximately 9.7%.
2. Which companies are prominent players in the Agri genomics Market?
Key companies in the market include Zoetis' Inc, Biogenetic Services' Inc, Eurofins Scientific Se, Tecan Genomics Inc, Thermo Fisher Scientific' Inc, Galseq Srl Via Italia, Arbor Biosciences, Agrigenomics' Inc, Neogen Corporation, Illumina' Inc.
3. What are the main segments of the Agri genomics Market?
The market segments include Production Analysis, Consumption Analysis, Import Market Analysis (Value & Volume), Export Market Analysis (Value & Volume), Price Trend Analysis.
4. Can you provide details about the market size?
The market size is estimated to be USD 5.24 billion as of 2022.
5. What are some drivers contributing to market growth?
Need for Custom Product Development; Use of CROs for Regulatory Services.
6. What are the notable trends driving market growth?
Growing Food Demand and Shrinking Land.
7. Are there any restraints impacting market growth?
Data and Cyber Security Concerns; Lack of Experts and Professionals in this Industry.
8. Can you provide examples of recent developments in the market?
February 2023: Tecan collaborated with Singular Genomics to use the turnkey MagicPrep NGS system to create sequencing-ready libraries for the G4 sequencing platform. The agreement will combine Tecan's expertise in laboratory automation, genomics, and bioinformatics with Singular Genomics' fast, flexible, and highly accurate sequencing technology to simplify life in the lab.
9. What pricing options are available for accessing the report?
Pricing options include single-user, multi-user, and enterprise licenses priced at USD 4750, USD 5250, and USD 8750 respectively.
10. Is the market size provided in terms of value or volume?
The market size is provided in terms of value, measured in billion.
11. Are there any specific market keywords associated with the report?
Yes, the market keyword associated with the report is "Agri genomics Market," which aids in identifying and referencing the specific market segment covered.
12. How do I determine which pricing option suits my needs best?
The pricing options vary based on user requirements and access needs. Individual users may opt for single-user licenses, while businesses requiring broader access may choose multi-user or enterprise licenses for cost-effective access to the report.
13. Are there any additional resources or data provided in the Agri genomics Market report?
While the report offers comprehensive insights, it's advisable to review the specific contents or supplementary materials provided to ascertain if additional resources or data are available.
14. How can I stay updated on further developments or reports in the Agri genomics Market?
To stay informed about further developments, trends, and reports in the Agri genomics Market, consider subscribing to industry newsletters, following relevant companies and organizations, or regularly checking reputable industry news sources and publications.
Methodology
Step 1 - Identification of Relevant Samples Size from Population Database


Step 2 - Approaches for Defining Global Market Size (Value, Volume* & Price*)

Note*: In applicable scenarios
Step 3 - Data Sources
Primary Research
- Web Analytics
- Survey Reports
- Research Institute
- Latest Research Reports
- Opinion Leaders
Secondary Research
- Annual Reports
- White Paper
- Latest Press Release
- Industry Association
- Paid Database
- Investor Presentations

Step 4 - Data Triangulation
Involves using different sources of information in order to increase the validity of a study
These sources are likely to be stakeholders in a program - participants, other researchers, program staff, other community members, and so on.
Then we put all data in single framework & apply various statistical tools to find out the dynamic on the market.
During the analysis stage, feedback from the stakeholder groups would be compared to determine areas of agreement as well as areas of divergence