

Key Insights
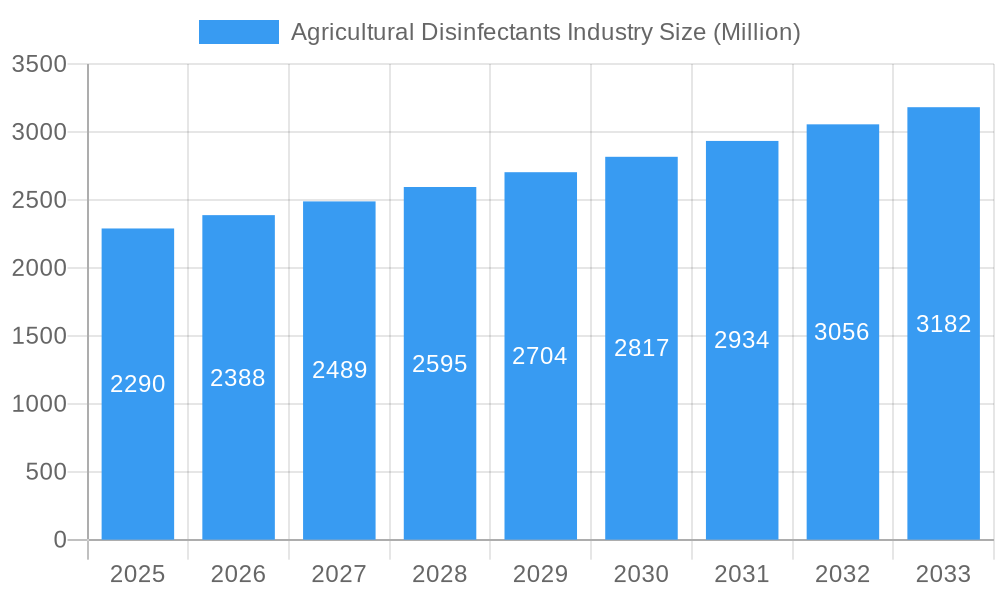
The global Agricultural Disinfectants market is poised for significant growth, projected to reach approximately USD 2.29 billion by 2025 and expand at a Compound Annual Growth Rate (CAGR) of 4.30% through 2033. This upward trajectory is propelled by a growing awareness of biosecurity in livestock farming, the increasing prevalence of zoonotic diseases, and the imperative to enhance crop yields and quality through effective disease prevention. The market is segmented into various analysis types, including production and consumption, import/export dynamics, and price trends, all contributing to a comprehensive understanding of market forces. Key drivers include the rising demand for safe and sustainable food production, stringent regulatory frameworks promoting hygiene in agricultural practices, and advancements in disinfectant formulations offering broader spectrum efficacy and improved environmental profiles.
Agricultural Disinfectants Industry Market Size (In Billion)
Emerging trends highlight a shift towards eco-friendly and bio-based disinfectants, driven by consumer demand for sustainable agriculture and concerns over the environmental impact of traditional chemical agents. The integration of advanced application technologies, such as automated spraying systems and smart monitoring devices, is also shaping the market by optimizing disinfectant usage and enhancing effectiveness. However, restraints such as the high cost of certain advanced disinfectant solutions, potential development of microbial resistance, and the need for proper training and handling protocols can pose challenges. Geographically, North America and Europe are established markets due to robust agricultural infrastructure and stringent biosecurity regulations. The Asia Pacific region, with its rapidly growing population and expanding agricultural sector, presents substantial growth opportunities. Key players like Zoetis Services LLC, Lanxess AG, and Bayer Cropscience are actively investing in research and development to introduce innovative products and expand their market reach.
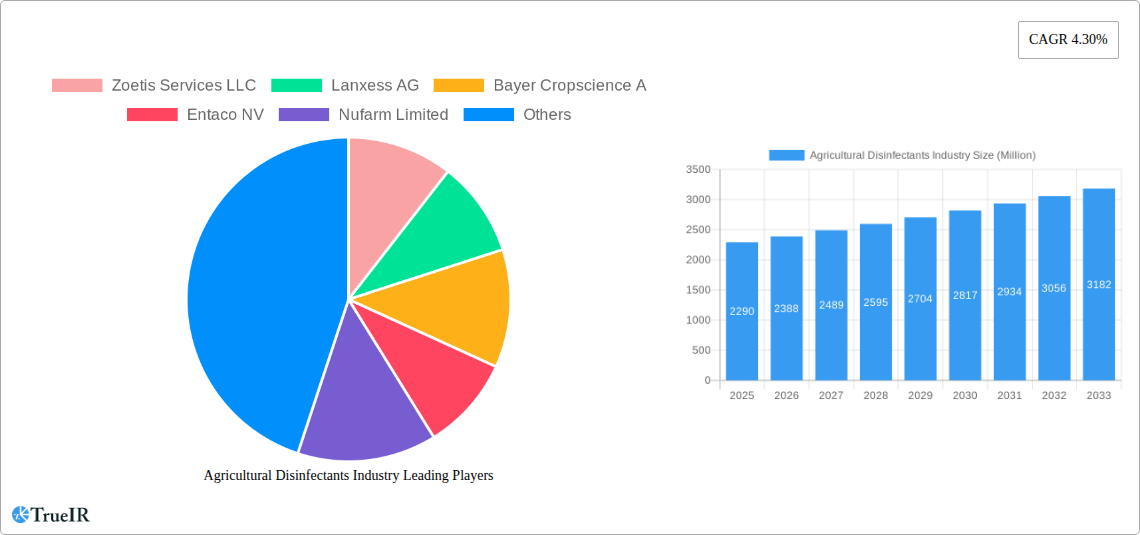
Agricultural Disinfectants Industry Company Market Share
Unlock comprehensive market intelligence on the agricultural disinfectants industry with our in-depth report. Analyzing a robust study period from 2019 to 2033, with a base year of 2025, this report provides critical insights into animal health disinfectants, crop protection chemicals, and biosecurity solutions. We delve into veterinary disinfectants, poultry disinfectants, swine disinfectants, and cattle disinfectants, exploring market dynamics, competitive landscapes, and future growth trajectories. This report is an essential resource for stakeholders seeking to understand disinfectant market size, disinfectant market trends, and disinfectant market opportunities within the global agricultural sector.
Agricultural Disinfectants Industry Market Structure & Competitive Landscape
The agricultural disinfectants market exhibits a moderately concentrated structure, with key players like Zoetis Services LLC, Lanxess AG, Bayer Cropscience A, Entaco NV, Nufarm Limited, Corteva Agri Science, Stepan Company, Neogen Corporation, Thymox Technology, and Ceva Sante Animale Group dominating significant market share. Innovation drivers are primarily focused on developing broad-spectrum efficacy against emerging pathogens, enhancing user safety, and promoting sustainable disinfection practices. Regulatory impacts, such as stringent environmental guidelines and approvals for new active ingredients, play a crucial role in shaping market entry and product development. Product substitutes include traditional cleaning methods and alternative biological control agents, though disinfectants remain vital for rapid and effective pathogen control. End-user segmentation highlights the significant demand from the livestock and poultry sectors, followed by horticulture and crop production. Mergers and acquisitions (M&A) are actively shaping the landscape, with an estimated volume of $500 Million in M&A activity recorded within the historical period (2019-2024), demonstrating consolidation and strategic expansion by leading firms. For instance, Lanxess AG's acquisition of Theseo in 2021 significantly bolstered its animal hygiene portfolio.
Agricultural Disinfectants Industry Market Trends & Opportunities
The agricultural disinfectants market is poised for substantial growth, projected to reach a market size of $15,000 Million by 2033, exhibiting a Compound Annual Growth Rate (CAGR) of approximately 7.5% during the forecast period (2025-2033). Technological shifts are driving the adoption of advanced formulations, including nano-disinfectants and bio-based disinfectants, offering enhanced efficacy and reduced environmental impact. Consumer preferences are increasingly leaning towards disinfectants that are safe for animals and humans, with a growing emphasis on preventative healthcare and biosecurity measures in farming practices. Competitive dynamics are characterized by intense R&D investments, strategic partnerships, and a focus on expanding geographical reach to cater to diverse agricultural needs worldwide. The rising incidence of zoonotic diseases and the growing awareness of the economic impact of animal diseases are significant market penetration drivers. Opportunities lie in developing integrated pest and disease management solutions that incorporate effective disinfection protocols, addressing the growing demand for sustainable agriculture and food safety. The increasing global population and the consequent need for enhanced food production further fuel the demand for effective disease control measures in agriculture.
Dominant Markets & Segments in Agricultural Disinfectants Industry
Production Analysis: The production of agricultural disinfectants is significantly concentrated in North America and Europe, driven by established agricultural infrastructure and stringent biosecurity regulations. Asia Pacific is emerging as a rapidly growing production hub due to increasing investments in animal husbandry and expanding crop cultivation.
Consumption Analysis: North America and Europe represent the largest consumption markets for agricultural disinfectants, fueled by intensive livestock farming operations and a proactive approach to disease prevention. The demand in Latin America and Asia Pacific is escalating due to the growth of the animal protein industry and increasing adoption of modern farming techniques.
Import Market Analysis (Value & Volume): The global import market for agricultural disinfectants is valued at approximately $3,500 Million in the base year of 2025. Key importing regions include countries with significant livestock populations and import-dependent agricultural sectors. Volume imports are substantial, indicating a widespread need for readily available and effective disinfectant solutions across various agricultural practices.
Export Market Analysis (Value & Volume): Leading exporting nations, valued at approximately $3,800 Million in 2025, are characterized by strong manufacturing capabilities and advanced product development. These nations cater to global demand, supplying a wide range of disinfectant products tailored for diverse agricultural applications and disease challenges.
Price Trend Analysis: The price trend for agricultural disinfectants has observed a steady increase, influenced by raw material costs, R&D expenses, and evolving regulatory landscapes. Average price increases have been in the range of 4-6% annually over the historical period. The forecast indicates continued upward price momentum due to sustained demand and innovation in product offerings.
Agricultural Disinfectants Industry Product Analysis
Product innovation in the agricultural disinfectants sector focuses on developing highly effective, broad-spectrum formulations that target a wide range of pathogens while minimizing environmental impact. Key advancements include the development of more stable and less toxic active ingredients, such as quaternary ammonium compounds, peroxyacetic acid, and glutaraldehyde, often combined in synergistic blends. Applications span animal housing disinfection, equipment sanitization, water treatment, and crop protection, with a growing emphasis on user-friendly delivery systems and residual efficacy. Competitive advantages are derived from superior efficacy against resistant strains, regulatory approvals, and sustainable sourcing of raw materials.
Key Drivers, Barriers & Challenges in Agricultural Disinfectants Industry
Key Drivers:
- Increasing prevalence of animal diseases: The rising occurrence of infectious diseases like Avian Influenza and African Swine Fever necessitates robust disinfection protocols, driving demand for agricultural disinfectants.
- Growing awareness of biosecurity: Farmers and agricultural organizations are increasingly recognizing the importance of biosecurity measures to prevent disease outbreaks and protect herd/flock health, leading to higher adoption rates of disinfectants.
- Technological advancements: Development of novel disinfectant formulations with enhanced efficacy, safety, and sustainability profiles is creating new market opportunities.
- Supportive government policies: Regulations promoting animal health and food safety indirectly support the agricultural disinfectants market.
Barriers & Challenges:
- Stringent regulatory frameworks: Obtaining approvals for new disinfectant products can be a lengthy and costly process, posing a barrier to entry for smaller companies.
- Development of microbial resistance: Overuse or improper application of disinfectants can lead to the development of resistant microbial strains, reducing their effectiveness.
- Fluctuating raw material prices: Volatility in the cost of key raw materials can impact profit margins for manufacturers and influence product pricing.
- Environmental concerns: Growing scrutiny over the environmental impact of certain disinfectant chemicals requires manufacturers to develop eco-friendlier alternatives.
Growth Drivers in the Agricultural Disinfectants Industry Market
The agricultural disinfectants industry is propelled by several key growth drivers. The escalating global demand for animal protein, coupled with the intensified scale of livestock farming, creates a fertile ground for disinfectants to maintain herd health and prevent devastating disease outbreaks. Furthermore, a heightened awareness of zoonotic diseases and their potential impact on public health is driving proactive biosecurity measures, directly boosting the demand for effective disinfectant solutions. Technological innovations in disinfectant formulations, such as the development of faster-acting and more environmentally benign chemistries, are expanding market applications and consumer acceptance. Supportive government initiatives aimed at enhancing food safety and animal welfare also play a crucial role in fostering market growth.
Challenges Impacting Agricultural Disinfectants Industry Growth
Several challenges are impacting the growth of the agricultural disinfectants industry. The rigorous and often lengthy regulatory approval processes for new disinfectant products can significantly delay market entry and increase development costs. The potential for microbial resistance development, stemming from improper or overuse of disinfectants, poses a significant threat to their long-term efficacy. Fluctuations in the prices of key raw materials, such as petrochemical derivatives, can lead to unpredictable cost structures for manufacturers and impact pricing strategies. Moreover, increasing environmental regulations and public concern regarding the ecological impact of certain disinfectant chemicals necessitate the development and adoption of greener, more sustainable alternatives.
Key Players Shaping the Agricultural Disinfectants Industry Market
- Zoetis Services LLC
- Lanxess AG
- Bayer Cropscience A
- Entaco NV
- Nufarm Limited
- Corteva Agri Science
- Stepan Company
- Neogen Corporation
- Thymox Technology
- Ceva Sante Animale Group
Significant Agricultural Disinfectants Industry Industry Milestones
- 2021: Ceva Santé Animale Group and INRAE Technologies signed an agreement to consolidate their collaboration in animal health, focusing on animal, human, and environmental health, particularly the prevention of infectious diseases of animal origin and improvement of animal welfare.
- 2021: Lanxess AG acquired Theseo, a disinfection and hygiene solutions provider, to strengthen its position in the animal hygiene market with Theseo's technical expertise and broad portfolio.
Future Outlook for Agricultural Disinfectants Industry Market
The future outlook for the agricultural disinfectants industry is highly positive, driven by a confluence of increasing global food demand, growing concerns over biosecurity, and continuous innovation. Strategic opportunities lie in the development of smart disinfection technologies, including automated application systems and real-time monitoring of pathogen presence. The growing demand for organic and sustainable farming practices will also foster the adoption of bio-based and eco-friendly disinfectant solutions. Market expansion into emerging economies with rapidly developing agricultural sectors presents significant potential. Collaboration between industry players, research institutions, and regulatory bodies will be crucial in addressing evolving challenges and ensuring the sustained growth of the agricultural disinfectants market.
Agricultural Disinfectants Industry Segmentation
- 1. Production Analysis
- 2. Consumption Analysis
- 3. Import Market Analysis (Value & Volume)
- 4. Export Market Analysis (Value & Volume)
- 5. Price Trend Analysis
Agricultural Disinfectants Industry Segmentation By Geography
-
1. North America
- 1.1. United States
- 1.2. Canada
- 1.3. Mexico
-
2. South America
- 2.1. Brazil
- 2.2. Argentina
- 2.3. Rest of South America
-
3. Europe
- 3.1. United Kingdom
- 3.2. Germany
- 3.3. France
- 3.4. Italy
- 3.5. Spain
- 3.6. Russia
- 3.7. Benelux
- 3.8. Nordics
- 3.9. Rest of Europe
-
4. Middle East & Africa
- 4.1. Turkey
- 4.2. Israel
- 4.3. GCC
- 4.4. North Africa
- 4.5. South Africa
- 4.6. Rest of Middle East & Africa
-
5. Asia Pacific
- 5.1. China
- 5.2. India
- 5.3. Japan
- 5.4. South Korea
- 5.5. ASEAN
- 5.6. Oceania
- 5.7. Rest of Asia Pacific
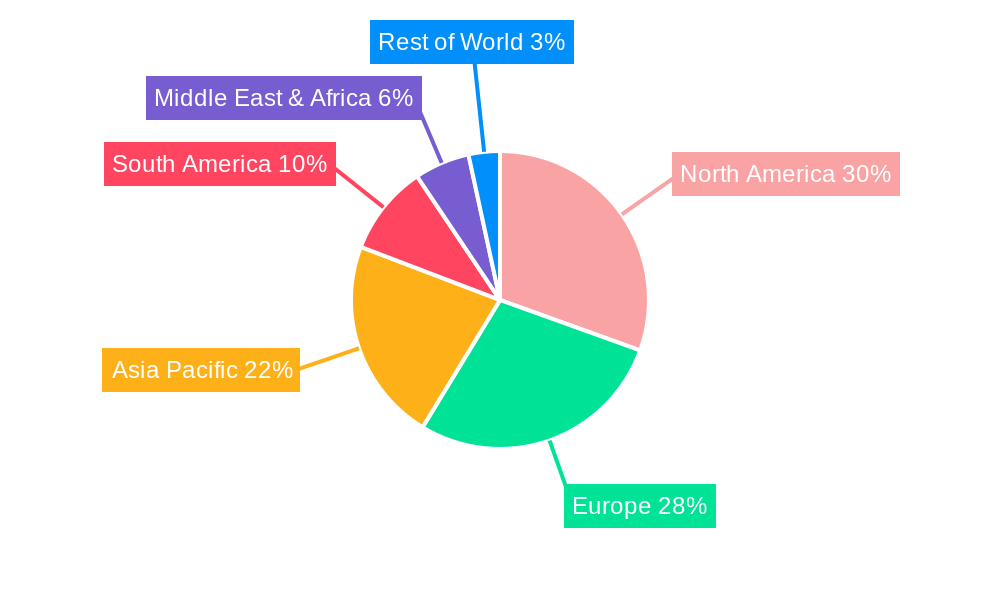
Agricultural Disinfectants Industry Regional Market Share
Geographic Coverage of Agricultural Disinfectants Industry
Agricultural Disinfectants Industry REPORT HIGHLIGHTS
| Aspects | Details |
|---|---|
| Study Period | 2020-2034 |
| Base Year | 2025 |
| Estimated Year | 2026 |
| Forecast Period | 2026-2034 |
| Historical Period | 2020-2025 |
| Growth Rate | CAGR of 4.30% from 2020-2034 |
| Segmentation |
|
Table of Contents
- 1. Introduction
- 1.1. Research Scope
- 1.2. Market Segmentation
- 1.3. Research Objective
- 1.4. Definitions and Assumptions
- 2. Executive Summary
- 2.1. Market Snapshot
- 3. Market Dynamics
- 3.1. Market Drivers
- 3.2. Market Restrains
- 3.3. Market Trends
- 3.4. Market Opportunities
- 4. Market Factor Analysis
- 4.1. Porters Five Forces
- 4.1.1. Bargaining Power of Suppliers
- 4.1.2. Bargaining Power of Buyers
- 4.1.3. Threat of New Entrants
- 4.1.4. Threat of Substitutes
- 4.1.5. Competitive Rivalry
- 4.2. PESTEL analysis
- 4.3. BCG Analysis
- 4.3.1. Stars (High Growth, High Market Share)
- 4.3.2. Cash Cows (Low Growth, High Market Share)
- 4.3.3. Question Mark (High Growth, Low Market Share)
- 4.3.4. Dogs (Low Growth, Low Market Share)
- 4.4. Ansoff Matrix Analysis
- 4.5. Supply Chain Analysis
- 4.6. Regulatory Landscape
- 4.7. Current Market Potential and Opportunity Assessment (TAM–SAM–SOM Framework)
- 4.8. TIR Analyst Note
- 4.1. Porters Five Forces
- 5. Market Analysis, Insights and Forecast 2021-2033
- 5.1. Market Analysis, Insights and Forecast - by Production Analysis
- 5.2. Market Analysis, Insights and Forecast - by Consumption Analysis
- 5.3. Market Analysis, Insights and Forecast - by Import Market Analysis (Value & Volume)
- 5.4. Market Analysis, Insights and Forecast - by Export Market Analysis (Value & Volume)
- 5.5. Market Analysis, Insights and Forecast - by Price Trend Analysis
- 5.6. Market Analysis, Insights and Forecast - by Region
- 5.6.1. North America
- 5.6.2. South America
- 5.6.3. Europe
- 5.6.4. Middle East & Africa
- 5.6.5. Asia Pacific
- 6. Global Agricultural Disinfectants Industry Analysis, Insights and Forecast, 2021-2033
- 6.1. Market Analysis, Insights and Forecast - by Production Analysis
- 6.2. Market Analysis, Insights and Forecast - by Consumption Analysis
- 6.3. Market Analysis, Insights and Forecast - by Import Market Analysis (Value & Volume)
- 6.4. Market Analysis, Insights and Forecast - by Export Market Analysis (Value & Volume)
- 6.5. Market Analysis, Insights and Forecast - by Price Trend Analysis
- 7. North America Agricultural Disinfectants Industry Analysis, Insights and Forecast, 2020-2032
- 7.1. Market Analysis, Insights and Forecast - by Production Analysis
- 7.2. Market Analysis, Insights and Forecast - by Consumption Analysis
- 7.3. Market Analysis, Insights and Forecast - by Import Market Analysis (Value & Volume)
- 7.4. Market Analysis, Insights and Forecast - by Export Market Analysis (Value & Volume)
- 7.5. Market Analysis, Insights and Forecast - by Price Trend Analysis
- 8. South America Agricultural Disinfectants Industry Analysis, Insights and Forecast, 2020-2032
- 8.1. Market Analysis, Insights and Forecast - by Production Analysis
- 8.2. Market Analysis, Insights and Forecast - by Consumption Analysis
- 8.3. Market Analysis, Insights and Forecast - by Import Market Analysis (Value & Volume)
- 8.4. Market Analysis, Insights and Forecast - by Export Market Analysis (Value & Volume)
- 8.5. Market Analysis, Insights and Forecast - by Price Trend Analysis
- 9. Europe Agricultural Disinfectants Industry Analysis, Insights and Forecast, 2020-2032
- 9.1. Market Analysis, Insights and Forecast - by Production Analysis
- 9.2. Market Analysis, Insights and Forecast - by Consumption Analysis
- 9.3. Market Analysis, Insights and Forecast - by Import Market Analysis (Value & Volume)
- 9.4. Market Analysis, Insights and Forecast - by Export Market Analysis (Value & Volume)
- 9.5. Market Analysis, Insights and Forecast - by Price Trend Analysis
- 10. Middle East & Africa Agricultural Disinfectants Industry Analysis, Insights and Forecast, 2020-2032
- 10.1. Market Analysis, Insights and Forecast - by Production Analysis
- 10.2. Market Analysis, Insights and Forecast - by Consumption Analysis
- 10.3. Market Analysis, Insights and Forecast - by Import Market Analysis (Value & Volume)
- 10.4. Market Analysis, Insights and Forecast - by Export Market Analysis (Value & Volume)
- 10.5. Market Analysis, Insights and Forecast - by Price Trend Analysis
- 11. Asia Pacific Agricultural Disinfectants Industry Analysis, Insights and Forecast, 2020-2032
- 11.1. Market Analysis, Insights and Forecast - by Production Analysis
- 11.2. Market Analysis, Insights and Forecast - by Consumption Analysis
- 11.3. Market Analysis, Insights and Forecast - by Import Market Analysis (Value & Volume)
- 11.4. Market Analysis, Insights and Forecast - by Export Market Analysis (Value & Volume)
- 11.5. Market Analysis, Insights and Forecast - by Price Trend Analysis
- 12. Competitive Analysis
- 12.1. Company Profiles
- 12.1.1 Zoetis Services LLC
- 12.1.1.1. Company Overview
- 12.1.1.2. Products
- 12.1.1.3. Company Financials
- 12.1.1.4. SWOT Analysis
- 12.1.2 Lanxess AG
- 12.1.2.1. Company Overview
- 12.1.2.2. Products
- 12.1.2.3. Company Financials
- 12.1.2.4. SWOT Analysis
- 12.1.3 Bayer Cropscience A
- 12.1.3.1. Company Overview
- 12.1.3.2. Products
- 12.1.3.3. Company Financials
- 12.1.3.4. SWOT Analysis
- 12.1.4 Entaco NV
- 12.1.4.1. Company Overview
- 12.1.4.2. Products
- 12.1.4.3. Company Financials
- 12.1.4.4. SWOT Analysis
- 12.1.5 Nufarm Limited
- 12.1.5.1. Company Overview
- 12.1.5.2. Products
- 12.1.5.3. Company Financials
- 12.1.5.4. SWOT Analysis
- 12.1.6 Corteva Agri Science
- 12.1.6.1. Company Overview
- 12.1.6.2. Products
- 12.1.6.3. Company Financials
- 12.1.6.4. SWOT Analysis
- 12.1.7 Stepan Company
- 12.1.7.1. Company Overview
- 12.1.7.2. Products
- 12.1.7.3. Company Financials
- 12.1.7.4. SWOT Analysis
- 12.1.8 Neogen Corporation
- 12.1.8.1. Company Overview
- 12.1.8.2. Products
- 12.1.8.3. Company Financials
- 12.1.8.4. SWOT Analysis
- 12.1.9 Thymox Technology
- 12.1.9.1. Company Overview
- 12.1.9.2. Products
- 12.1.9.3. Company Financials
- 12.1.9.4. SWOT Analysis
- 12.1.10 Ceva Sante Animale Group
- 12.1.10.1. Company Overview
- 12.1.10.2. Products
- 12.1.10.3. Company Financials
- 12.1.10.4. SWOT Analysis
- 12.1.1 Zoetis Services LLC
- 12.2. Market Entropy
- 12.2.1 Company's Key Areas Served
- 12.2.2 Recent Developments
- 12.3. Company Market Share Analysis 2025
- 12.3.1 Top 5 Companies Market Share Analysis
- 12.3.2 Top 3 Companies Market Share Analysis
- 12.4. List of Potential Customers
- 13. Research Methodology
List of Figures
- Figure 1: Global Agricultural Disinfectants Industry Revenue Breakdown (Million, %) by Region 2025 & 2033
- Figure 2: North America Agricultural Disinfectants Industry Revenue (Million), by Production Analysis 2025 & 2033
- Figure 3: North America Agricultural Disinfectants Industry Revenue Share (%), by Production Analysis 2025 & 2033
- Figure 4: North America Agricultural Disinfectants Industry Revenue (Million), by Consumption Analysis 2025 & 2033
- Figure 5: North America Agricultural Disinfectants Industry Revenue Share (%), by Consumption Analysis 2025 & 2033
- Figure 6: North America Agricultural Disinfectants Industry Revenue (Million), by Import Market Analysis (Value & Volume) 2025 & 2033
- Figure 7: North America Agricultural Disinfectants Industry Revenue Share (%), by Import Market Analysis (Value & Volume) 2025 & 2033
- Figure 8: North America Agricultural Disinfectants Industry Revenue (Million), by Export Market Analysis (Value & Volume) 2025 & 2033
- Figure 9: North America Agricultural Disinfectants Industry Revenue Share (%), by Export Market Analysis (Value & Volume) 2025 & 2033
- Figure 10: North America Agricultural Disinfectants Industry Revenue (Million), by Price Trend Analysis 2025 & 2033
- Figure 11: North America Agricultural Disinfectants Industry Revenue Share (%), by Price Trend Analysis 2025 & 2033
- Figure 12: North America Agricultural Disinfectants Industry Revenue (Million), by Country 2025 & 2033
- Figure 13: North America Agricultural Disinfectants Industry Revenue Share (%), by Country 2025 & 2033
- Figure 14: South America Agricultural Disinfectants Industry Revenue (Million), by Production Analysis 2025 & 2033
- Figure 15: South America Agricultural Disinfectants Industry Revenue Share (%), by Production Analysis 2025 & 2033
- Figure 16: South America Agricultural Disinfectants Industry Revenue (Million), by Consumption Analysis 2025 & 2033
- Figure 17: South America Agricultural Disinfectants Industry Revenue Share (%), by Consumption Analysis 2025 & 2033
- Figure 18: South America Agricultural Disinfectants Industry Revenue (Million), by Import Market Analysis (Value & Volume) 2025 & 2033
- Figure 19: South America Agricultural Disinfectants Industry Revenue Share (%), by Import Market Analysis (Value & Volume) 2025 & 2033
- Figure 20: South America Agricultural Disinfectants Industry Revenue (Million), by Export Market Analysis (Value & Volume) 2025 & 2033
- Figure 21: South America Agricultural Disinfectants Industry Revenue Share (%), by Export Market Analysis (Value & Volume) 2025 & 2033
- Figure 22: South America Agricultural Disinfectants Industry Revenue (Million), by Price Trend Analysis 2025 & 2033
- Figure 23: South America Agricultural Disinfectants Industry Revenue Share (%), by Price Trend Analysis 2025 & 2033
- Figure 24: South America Agricultural Disinfectants Industry Revenue (Million), by Country 2025 & 2033
- Figure 25: South America Agricultural Disinfectants Industry Revenue Share (%), by Country 2025 & 2033
- Figure 26: Europe Agricultural Disinfectants Industry Revenue (Million), by Production Analysis 2025 & 2033
- Figure 27: Europe Agricultural Disinfectants Industry Revenue Share (%), by Production Analysis 2025 & 2033
- Figure 28: Europe Agricultural Disinfectants Industry Revenue (Million), by Consumption Analysis 2025 & 2033
- Figure 29: Europe Agricultural Disinfectants Industry Revenue Share (%), by Consumption Analysis 2025 & 2033
- Figure 30: Europe Agricultural Disinfectants Industry Revenue (Million), by Import Market Analysis (Value & Volume) 2025 & 2033
- Figure 31: Europe Agricultural Disinfectants Industry Revenue Share (%), by Import Market Analysis (Value & Volume) 2025 & 2033
- Figure 32: Europe Agricultural Disinfectants Industry Revenue (Million), by Export Market Analysis (Value & Volume) 2025 & 2033
- Figure 33: Europe Agricultural Disinfectants Industry Revenue Share (%), by Export Market Analysis (Value & Volume) 2025 & 2033
- Figure 34: Europe Agricultural Disinfectants Industry Revenue (Million), by Price Trend Analysis 2025 & 2033
- Figure 35: Europe Agricultural Disinfectants Industry Revenue Share (%), by Price Trend Analysis 2025 & 2033
- Figure 36: Europe Agricultural Disinfectants Industry Revenue (Million), by Country 2025 & 2033
- Figure 37: Europe Agricultural Disinfectants Industry Revenue Share (%), by Country 2025 & 2033
- Figure 38: Middle East & Africa Agricultural Disinfectants Industry Revenue (Million), by Production Analysis 2025 & 2033
- Figure 39: Middle East & Africa Agricultural Disinfectants Industry Revenue Share (%), by Production Analysis 2025 & 2033
- Figure 40: Middle East & Africa Agricultural Disinfectants Industry Revenue (Million), by Consumption Analysis 2025 & 2033
- Figure 41: Middle East & Africa Agricultural Disinfectants Industry Revenue Share (%), by Consumption Analysis 2025 & 2033
- Figure 42: Middle East & Africa Agricultural Disinfectants Industry Revenue (Million), by Import Market Analysis (Value & Volume) 2025 & 2033
- Figure 43: Middle East & Africa Agricultural Disinfectants Industry Revenue Share (%), by Import Market Analysis (Value & Volume) 2025 & 2033
- Figure 44: Middle East & Africa Agricultural Disinfectants Industry Revenue (Million), by Export Market Analysis (Value & Volume) 2025 & 2033
- Figure 45: Middle East & Africa Agricultural Disinfectants Industry Revenue Share (%), by Export Market Analysis (Value & Volume) 2025 & 2033
- Figure 46: Middle East & Africa Agricultural Disinfectants Industry Revenue (Million), by Price Trend Analysis 2025 & 2033
- Figure 47: Middle East & Africa Agricultural Disinfectants Industry Revenue Share (%), by Price Trend Analysis 2025 & 2033
- Figure 48: Middle East & Africa Agricultural Disinfectants Industry Revenue (Million), by Country 2025 & 2033
- Figure 49: Middle East & Africa Agricultural Disinfectants Industry Revenue Share (%), by Country 2025 & 2033
- Figure 50: Asia Pacific Agricultural Disinfectants Industry Revenue (Million), by Production Analysis 2025 & 2033
- Figure 51: Asia Pacific Agricultural Disinfectants Industry Revenue Share (%), by Production Analysis 2025 & 2033
- Figure 52: Asia Pacific Agricultural Disinfectants Industry Revenue (Million), by Consumption Analysis 2025 & 2033
- Figure 53: Asia Pacific Agricultural Disinfectants Industry Revenue Share (%), by Consumption Analysis 2025 & 2033
- Figure 54: Asia Pacific Agricultural Disinfectants Industry Revenue (Million), by Import Market Analysis (Value & Volume) 2025 & 2033
- Figure 55: Asia Pacific Agricultural Disinfectants Industry Revenue Share (%), by Import Market Analysis (Value & Volume) 2025 & 2033
- Figure 56: Asia Pacific Agricultural Disinfectants Industry Revenue (Million), by Export Market Analysis (Value & Volume) 2025 & 2033
- Figure 57: Asia Pacific Agricultural Disinfectants Industry Revenue Share (%), by Export Market Analysis (Value & Volume) 2025 & 2033
- Figure 58: Asia Pacific Agricultural Disinfectants Industry Revenue (Million), by Price Trend Analysis 2025 & 2033
- Figure 59: Asia Pacific Agricultural Disinfectants Industry Revenue Share (%), by Price Trend Analysis 2025 & 2033
- Figure 60: Asia Pacific Agricultural Disinfectants Industry Revenue (Million), by Country 2025 & 2033
- Figure 61: Asia Pacific Agricultural Disinfectants Industry Revenue Share (%), by Country 2025 & 2033
List of Tables
- Table 1: Global Agricultural Disinfectants Industry Revenue Million Forecast, by Production Analysis 2020 & 2033
- Table 2: Global Agricultural Disinfectants Industry Revenue Million Forecast, by Consumption Analysis 2020 & 2033
- Table 3: Global Agricultural Disinfectants Industry Revenue Million Forecast, by Import Market Analysis (Value & Volume) 2020 & 2033
- Table 4: Global Agricultural Disinfectants Industry Revenue Million Forecast, by Export Market Analysis (Value & Volume) 2020 & 2033
- Table 5: Global Agricultural Disinfectants Industry Revenue Million Forecast, by Price Trend Analysis 2020 & 2033
- Table 6: Global Agricultural Disinfectants Industry Revenue Million Forecast, by Region 2020 & 2033
- Table 7: Global Agricultural Disinfectants Industry Revenue Million Forecast, by Production Analysis 2020 & 2033
- Table 8: Global Agricultural Disinfectants Industry Revenue Million Forecast, by Consumption Analysis 2020 & 2033
- Table 9: Global Agricultural Disinfectants Industry Revenue Million Forecast, by Import Market Analysis (Value & Volume) 2020 & 2033
- Table 10: Global Agricultural Disinfectants Industry Revenue Million Forecast, by Export Market Analysis (Value & Volume) 2020 & 2033
- Table 11: Global Agricultural Disinfectants Industry Revenue Million Forecast, by Price Trend Analysis 2020 & 2033
- Table 12: Global Agricultural Disinfectants Industry Revenue Million Forecast, by Country 2020 & 2033
- Table 13: United States Agricultural Disinfectants Industry Revenue (Million) Forecast, by Application 2020 & 2033
- Table 14: Canada Agricultural Disinfectants Industry Revenue (Million) Forecast, by Application 2020 & 2033
- Table 15: Mexico Agricultural Disinfectants Industry Revenue (Million) Forecast, by Application 2020 & 2033
- Table 16: Global Agricultural Disinfectants Industry Revenue Million Forecast, by Production Analysis 2020 & 2033
- Table 17: Global Agricultural Disinfectants Industry Revenue Million Forecast, by Consumption Analysis 2020 & 2033
- Table 18: Global Agricultural Disinfectants Industry Revenue Million Forecast, by Import Market Analysis (Value & Volume) 2020 & 2033
- Table 19: Global Agricultural Disinfectants Industry Revenue Million Forecast, by Export Market Analysis (Value & Volume) 2020 & 2033
- Table 20: Global Agricultural Disinfectants Industry Revenue Million Forecast, by Price Trend Analysis 2020 & 2033
- Table 21: Global Agricultural Disinfectants Industry Revenue Million Forecast, by Country 2020 & 2033
- Table 22: Brazil Agricultural Disinfectants Industry Revenue (Million) Forecast, by Application 2020 & 2033
- Table 23: Argentina Agricultural Disinfectants Industry Revenue (Million) Forecast, by Application 2020 & 2033
- Table 24: Rest of South America Agricultural Disinfectants Industry Revenue (Million) Forecast, by Application 2020 & 2033
- Table 25: Global Agricultural Disinfectants Industry Revenue Million Forecast, by Production Analysis 2020 & 2033
- Table 26: Global Agricultural Disinfectants Industry Revenue Million Forecast, by Consumption Analysis 2020 & 2033
- Table 27: Global Agricultural Disinfectants Industry Revenue Million Forecast, by Import Market Analysis (Value & Volume) 2020 & 2033
- Table 28: Global Agricultural Disinfectants Industry Revenue Million Forecast, by Export Market Analysis (Value & Volume) 2020 & 2033
- Table 29: Global Agricultural Disinfectants Industry Revenue Million Forecast, by Price Trend Analysis 2020 & 2033
- Table 30: Global Agricultural Disinfectants Industry Revenue Million Forecast, by Country 2020 & 2033
- Table 31: United Kingdom Agricultural Disinfectants Industry Revenue (Million) Forecast, by Application 2020 & 2033
- Table 32: Germany Agricultural Disinfectants Industry Revenue (Million) Forecast, by Application 2020 & 2033
- Table 33: France Agricultural Disinfectants Industry Revenue (Million) Forecast, by Application 2020 & 2033
- Table 34: Italy Agricultural Disinfectants Industry Revenue (Million) Forecast, by Application 2020 & 2033
- Table 35: Spain Agricultural Disinfectants Industry Revenue (Million) Forecast, by Application 2020 & 2033
- Table 36: Russia Agricultural Disinfectants Industry Revenue (Million) Forecast, by Application 2020 & 2033
- Table 37: Benelux Agricultural Disinfectants Industry Revenue (Million) Forecast, by Application 2020 & 2033
- Table 38: Nordics Agricultural Disinfectants Industry Revenue (Million) Forecast, by Application 2020 & 2033
- Table 39: Rest of Europe Agricultural Disinfectants Industry Revenue (Million) Forecast, by Application 2020 & 2033
- Table 40: Global Agricultural Disinfectants Industry Revenue Million Forecast, by Production Analysis 2020 & 2033
- Table 41: Global Agricultural Disinfectants Industry Revenue Million Forecast, by Consumption Analysis 2020 & 2033
- Table 42: Global Agricultural Disinfectants Industry Revenue Million Forecast, by Import Market Analysis (Value & Volume) 2020 & 2033
- Table 43: Global Agricultural Disinfectants Industry Revenue Million Forecast, by Export Market Analysis (Value & Volume) 2020 & 2033
- Table 44: Global Agricultural Disinfectants Industry Revenue Million Forecast, by Price Trend Analysis 2020 & 2033
- Table 45: Global Agricultural Disinfectants Industry Revenue Million Forecast, by Country 2020 & 2033
- Table 46: Turkey Agricultural Disinfectants Industry Revenue (Million) Forecast, by Application 2020 & 2033
- Table 47: Israel Agricultural Disinfectants Industry Revenue (Million) Forecast, by Application 2020 & 2033
- Table 48: GCC Agricultural Disinfectants Industry Revenue (Million) Forecast, by Application 2020 & 2033
- Table 49: North Africa Agricultural Disinfectants Industry Revenue (Million) Forecast, by Application 2020 & 2033
- Table 50: South Africa Agricultural Disinfectants Industry Revenue (Million) Forecast, by Application 2020 & 2033
- Table 51: Rest of Middle East & Africa Agricultural Disinfectants Industry Revenue (Million) Forecast, by Application 2020 & 2033
- Table 52: Global Agricultural Disinfectants Industry Revenue Million Forecast, by Production Analysis 2020 & 2033
- Table 53: Global Agricultural Disinfectants Industry Revenue Million Forecast, by Consumption Analysis 2020 & 2033
- Table 54: Global Agricultural Disinfectants Industry Revenue Million Forecast, by Import Market Analysis (Value & Volume) 2020 & 2033
- Table 55: Global Agricultural Disinfectants Industry Revenue Million Forecast, by Export Market Analysis (Value & Volume) 2020 & 2033
- Table 56: Global Agricultural Disinfectants Industry Revenue Million Forecast, by Price Trend Analysis 2020 & 2033
- Table 57: Global Agricultural Disinfectants Industry Revenue Million Forecast, by Country 2020 & 2033
- Table 58: China Agricultural Disinfectants Industry Revenue (Million) Forecast, by Application 2020 & 2033
- Table 59: India Agricultural Disinfectants Industry Revenue (Million) Forecast, by Application 2020 & 2033
- Table 60: Japan Agricultural Disinfectants Industry Revenue (Million) Forecast, by Application 2020 & 2033
- Table 61: South Korea Agricultural Disinfectants Industry Revenue (Million) Forecast, by Application 2020 & 2033
- Table 62: ASEAN Agricultural Disinfectants Industry Revenue (Million) Forecast, by Application 2020 & 2033
- Table 63: Oceania Agricultural Disinfectants Industry Revenue (Million) Forecast, by Application 2020 & 2033
- Table 64: Rest of Asia Pacific Agricultural Disinfectants Industry Revenue (Million) Forecast, by Application 2020 & 2033
Frequently Asked Questions
1. What is the projected Compound Annual Growth Rate (CAGR) of the Agricultural Disinfectants Industry?
The projected CAGR is approximately 4.30%.
2. Which companies are prominent players in the Agricultural Disinfectants Industry?
Key companies in the market include Zoetis Services LLC, Lanxess AG, Bayer Cropscience A, Entaco NV, Nufarm Limited, Corteva Agri Science, Stepan Company, Neogen Corporation, Thymox Technology, Ceva Sante Animale Group.
3. What are the main segments of the Agricultural Disinfectants Industry?
The market segments include Production Analysis, Consumption Analysis, Import Market Analysis (Value & Volume), Export Market Analysis (Value & Volume), Price Trend Analysis.
4. Can you provide details about the market size?
The market size is estimated to be USD 2.29 Million as of 2022.
5. What are some drivers contributing to market growth?
Skilled Labor Shortage; Favorable Government Policies.
6. What are the notable trends driving market growth?
Growing Area Under Protected Cultivation.
7. Are there any restraints impacting market growth?
Fragmentation of Land Holdings; Increasing Interest of Farmers Toward Custom Hiring Center.
8. Can you provide examples of recent developments in the market?
In 2021, Ceva Santé Animale Group and INRAE Technologies signed an agreement to consolidate their collaboration in animal health. This collaboration will focus on the animal, human, and environmental health. It will particularly focus on the prevention of infectious diseases of animal origin and the improvement of animal welfare.
9. What pricing options are available for accessing the report?
Pricing options include single-user, multi-user, and enterprise licenses priced at USD 4750, USD 5250, and USD 8750 respectively.
10. Is the market size provided in terms of value or volume?
The market size is provided in terms of value, measured in Million.
11. Are there any specific market keywords associated with the report?
Yes, the market keyword associated with the report is "Agricultural Disinfectants Industry," which aids in identifying and referencing the specific market segment covered.
12. How do I determine which pricing option suits my needs best?
The pricing options vary based on user requirements and access needs. Individual users may opt for single-user licenses, while businesses requiring broader access may choose multi-user or enterprise licenses for cost-effective access to the report.
13. Are there any additional resources or data provided in the Agricultural Disinfectants Industry report?
While the report offers comprehensive insights, it's advisable to review the specific contents or supplementary materials provided to ascertain if additional resources or data are available.
14. How can I stay updated on further developments or reports in the Agricultural Disinfectants Industry?
To stay informed about further developments, trends, and reports in the Agricultural Disinfectants Industry, consider subscribing to industry newsletters, following relevant companies and organizations, or regularly checking reputable industry news sources and publications.
Methodology
Step 1 - Identification of Relevant Samples Size from Population Database


Step 2 - Approaches for Defining Global Market Size (Value, Volume* & Price*)

Note*: In applicable scenarios
Step 3 - Data Sources
Primary Research
- Web Analytics
- Survey Reports
- Research Institute
- Latest Research Reports
- Opinion Leaders
Secondary Research
- Annual Reports
- White Paper
- Latest Press Release
- Industry Association
- Paid Database
- Investor Presentations

Step 4 - Data Triangulation
Involves using different sources of information in order to increase the validity of a study
These sources are likely to be stakeholders in a program - participants, other researchers, program staff, other community members, and so on.
Then we put all data in single framework & apply various statistical tools to find out the dynamic on the market.
During the analysis stage, feedback from the stakeholder groups would be compared to determine areas of agreement as well as areas of divergence