

Key Insights
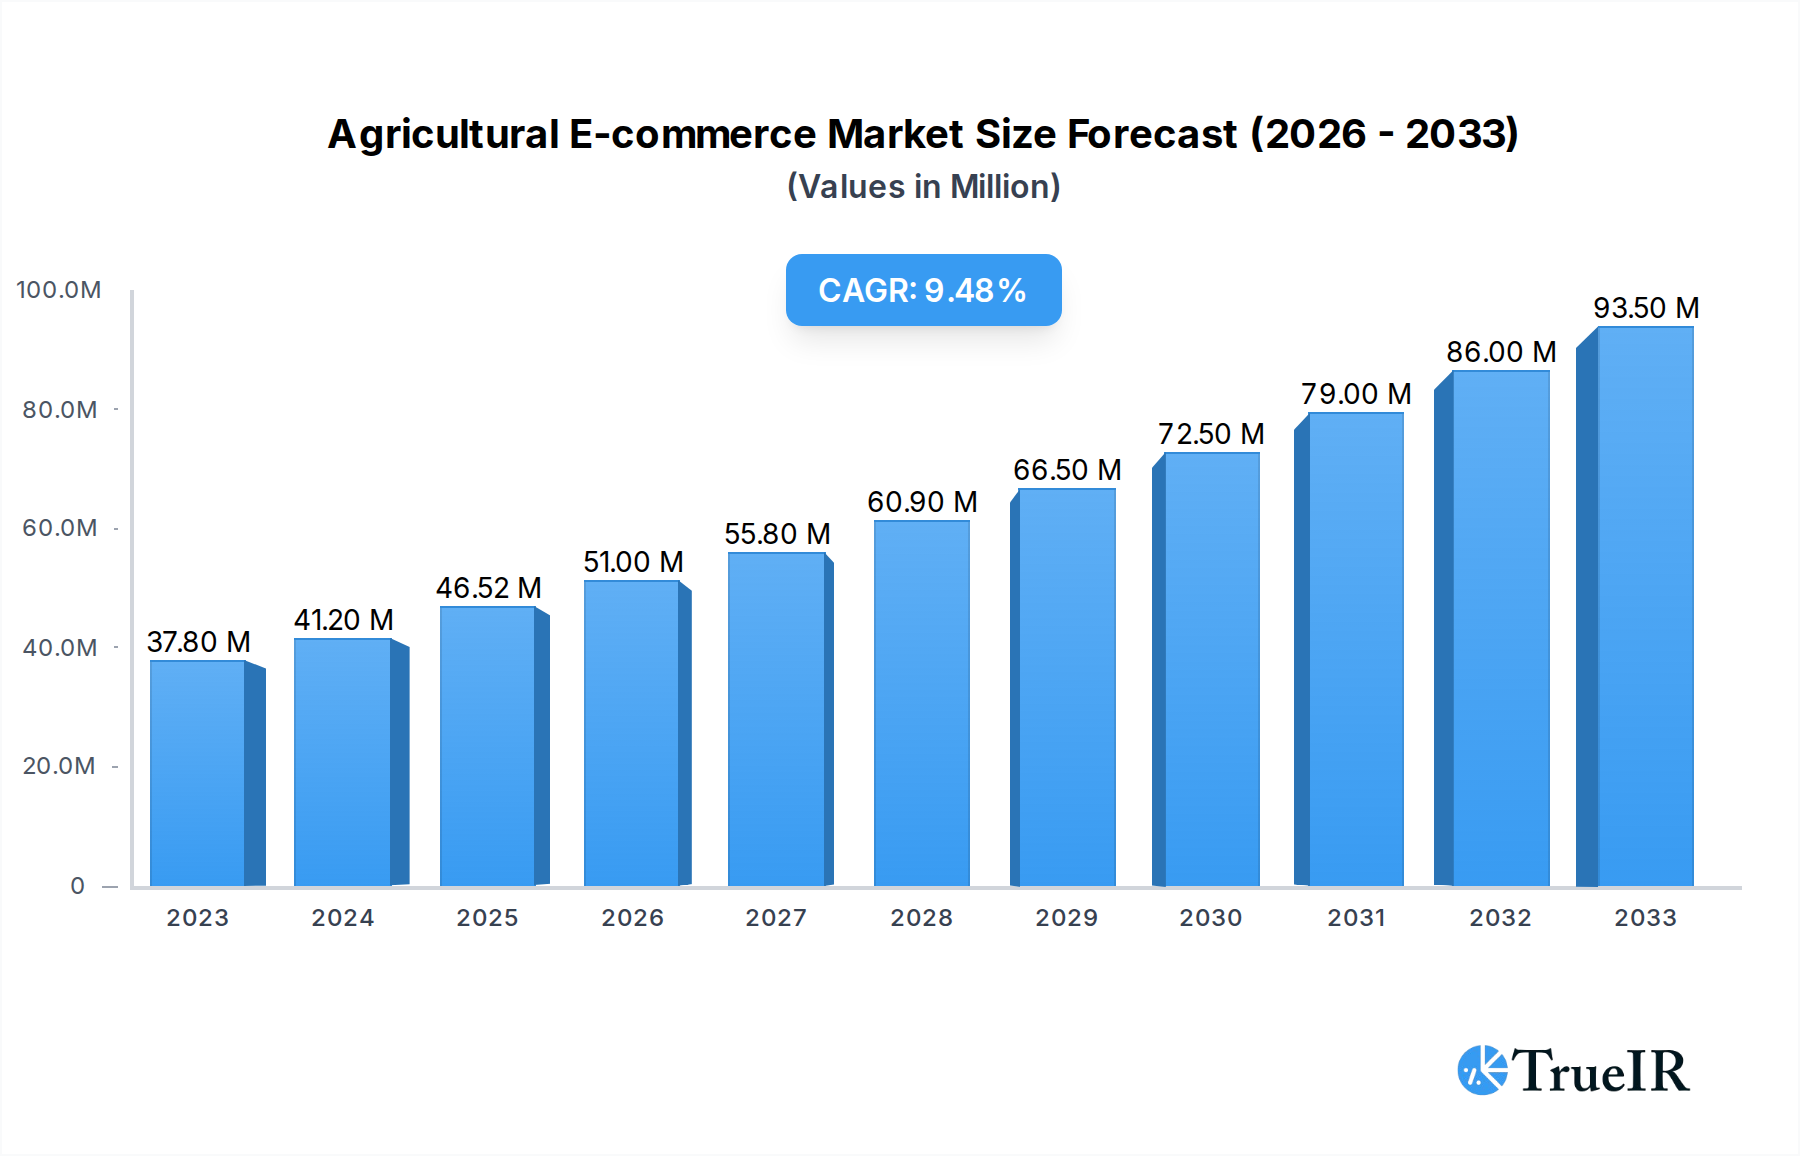
The global Agricultural E-commerce market is experiencing robust growth, projected to reach $46.52 billion by 2025, with a significant Compound Annual Growth Rate (CAGR) of 9.6% anticipated through 2033. This expansion is primarily fueled by increasing internet penetration in rural areas, the growing adoption of digital payment systems, and the rising demand for traceable and sustainably sourced agricultural products. Key drivers include government initiatives promoting digital agriculture, the need for improved supply chain efficiency, and the desire for greater convenience among both producers and consumers. The market's evolution is characterized by a shift towards more sophisticated online platforms offering a wide array of services, from raw material procurement to finished product sales and logistics support.

Agricultural E-commerce Market Size (In Million)
The Agricultural E-commerce landscape is segmented into various applications, with Enterprise and Government Procurement being significant contributors due to bulk purchasing and policy support, respectively. The Consumer segment is also rapidly growing as individuals seek direct access to fresh produce and specialized agricultural goods. The market's development is further shaped by distinct business models, including Business-to-Business (B2B) for wholesale transactions and Business-to-Consumer (B2C) for direct sales. While the market presents immense opportunities, it also faces challenges such as logistical complexities in last-mile delivery, fluctuating commodity prices, and the need for robust quality control measures. However, innovations in agricultural technology, including AI-powered analytics and blockchain for supply chain transparency, are poised to mitigate these restraints and further propel market expansion. Major players like Amazon, Alibaba Group, and JD.com are actively investing in this sector, alongside specialized agricultural e-commerce platforms, indicating a highly competitive yet promising market future.
Agricultural E-commerce Company Market Share
Agricultural E-commerce: Unlocking Global Food Supply Chains and Driving Farm-to-Fork Innovation
This comprehensive report provides an in-depth analysis of the global Agricultural E-commerce market, forecasting its explosive growth from 2019 to 2033. Leveraging advanced analytics and high-volume keywords, this report is your definitive guide to understanding market dynamics, competitive landscapes, and future trajectories in one of the most crucial sectors of the global economy. We delve into the transformative power of digital platforms in revolutionizing how agricultural products are bought, sold, and distributed, from farm-level inputs to consumer-ready goods.
Agricultural E-commerce Market Structure & Competitive Landscape
The Agricultural E-commerce market exhibits a dynamic and evolving structure, characterized by a mix of established e-commerce giants and specialized agricultural technology platforms. Market concentration varies significantly by region, with some markets dominated by a few large players, while others remain fragmented with numerous niche providers. Innovation drivers are primarily fueled by advancements in logistics, blockchain technology for traceability, data analytics for optimizing supply chains, and user-friendly interfaces for both farmers and consumers. Regulatory impacts are significant, with government initiatives aimed at promoting digital agriculture, food safety standards, and fair trade practices playing a crucial role in shaping market access and operational frameworks. Product substitutes, while present in traditional trade channels, are increasingly being disrupted by the efficiency and transparency offered by online platforms. End-user segmentation spans government procurement of agricultural commodities, enterprise-level procurement for food processing and retail, and direct-to-consumer sales, each with distinct needs and purchasing behaviors. Mergers and acquisitions (M&A) trends are on the rise as companies seek to expand their market reach, acquire technological capabilities, and consolidate their positions in this burgeoning sector. For instance, the last five years have seen approximately \$50 billion in M&A activity, with concentration ratios in key markets hovering around 65%.
Agricultural E-commerce Market Trends & Opportunities
The Agricultural E-commerce market is poised for unprecedented growth, projected to reach a valuation exceeding \$10 trillion by 2033. This expansion is driven by a confluence of technological advancements, evolving consumer preferences, and significant industry developments. The market size is expected to grow at a Compound Annual Growth Rate (CAGR) of approximately 15% from the base year of 2025. Technological shifts are central to this transformation, with the adoption of artificial intelligence (AI) for predictive analytics in crop yields and market demand, the Internet of Things (IoT) for precision agriculture and supply chain monitoring, and blockchain for enhanced transparency and traceability of food products. These technologies are not only improving operational efficiency but also building consumer trust. Consumer preferences are increasingly leaning towards convenience, sustainability, and ethically sourced products, all of which can be effectively communicated and delivered through e-commerce platforms. The rise of the "conscious consumer" is a major opportunity, creating demand for niche agricultural products and direct sourcing from farms. Competitive dynamics are intensifying, with both global e-commerce giants and innovative startups vying for market share. This competition is fostering greater investment in user experience, faster delivery networks, and more sophisticated digital tools for farmers. Market penetration rates are expected to surge, particularly in emerging economies where digital infrastructure is rapidly developing. Opportunities abound for platforms that can effectively bridge the gap between producers and consumers, reduce post-harvest losses through efficient logistics, and offer value-added services like farm management software and financial support to farmers. The increasing focus on food security and resilience further amplifies the importance of digital agricultural trade.
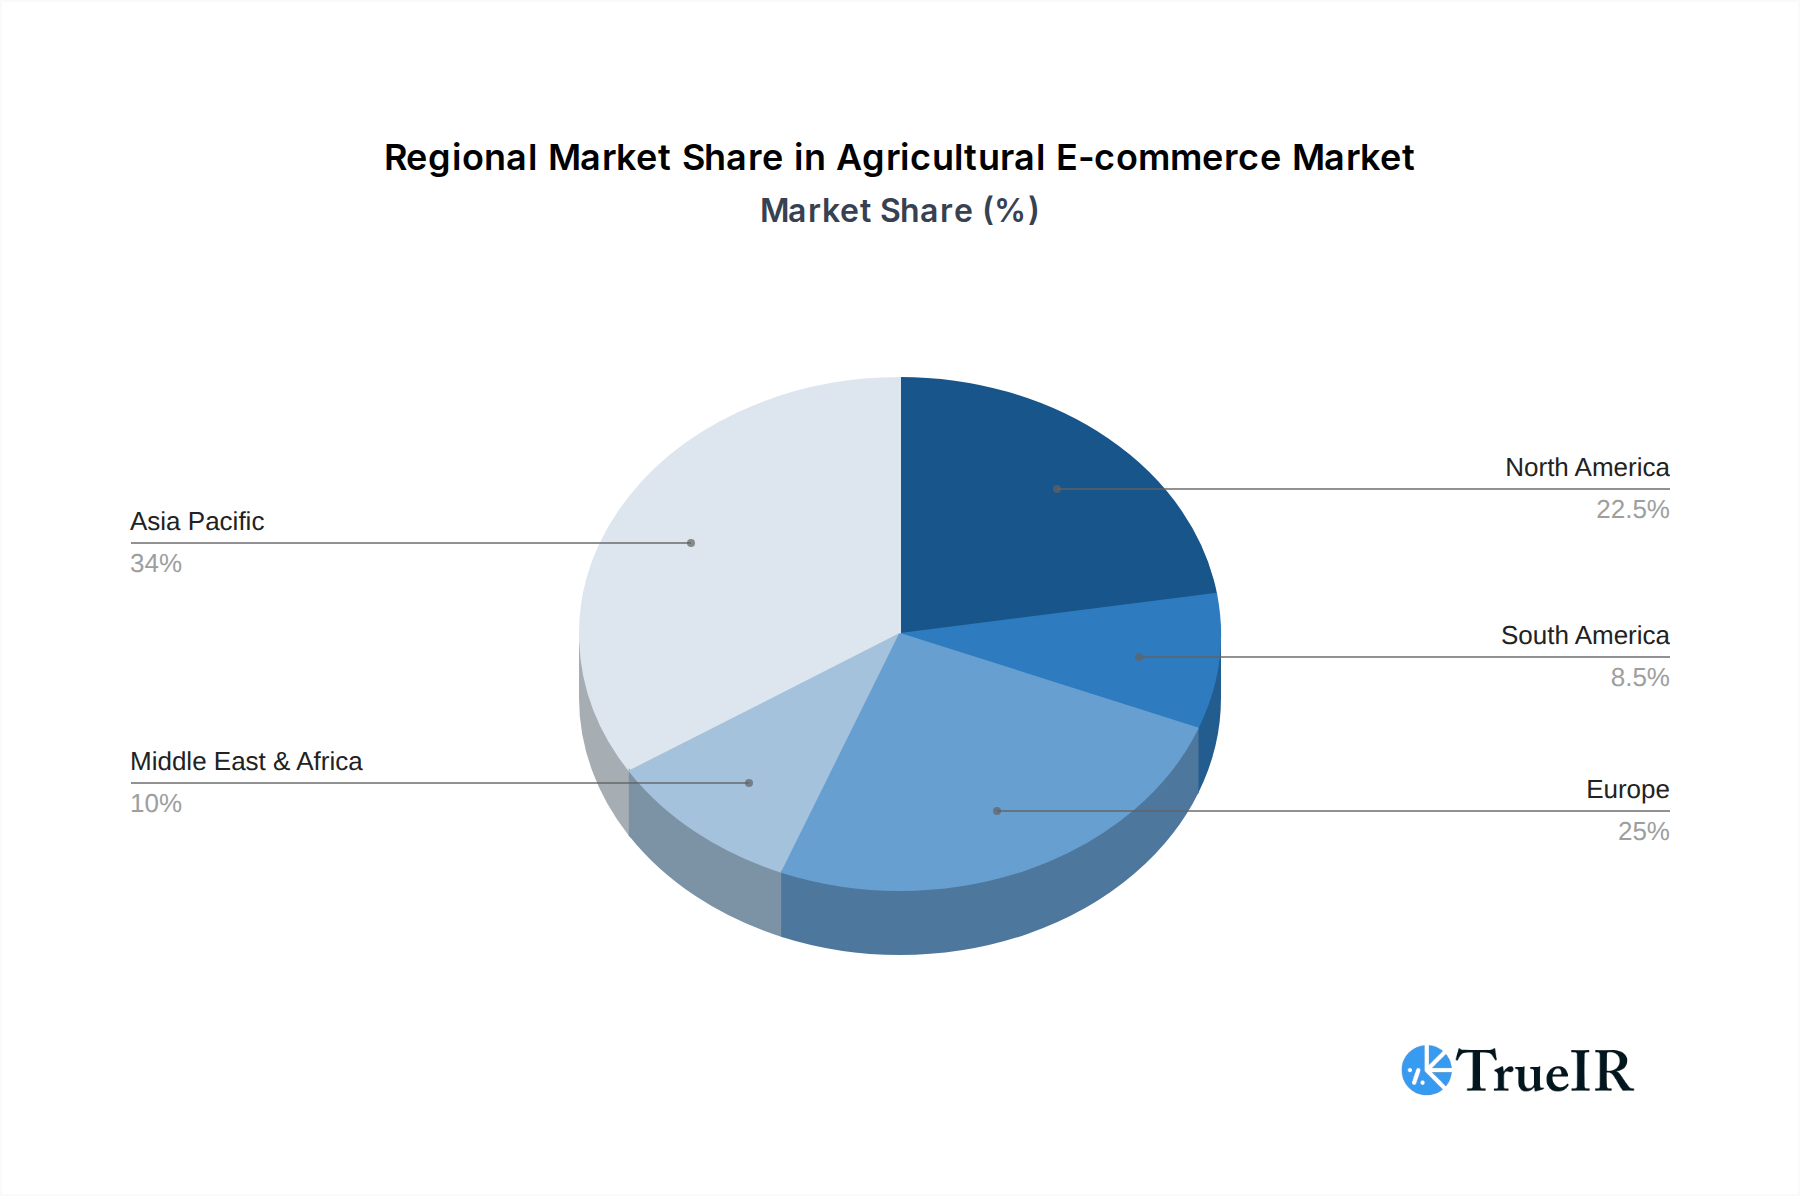
Dominant Markets & Segments in Agricultural E-commerce
The Agricultural E-commerce market is experiencing robust growth across several key regions and segments, with Asia-Pacific emerging as a dominant force due to its large agricultural base and rapidly expanding digital infrastructure. Within the Application segment, Consumer procurement represents the largest and fastest-growing category, driven by increasing urbanization and a desire for convenient access to fresh produce and other agricultural goods. This segment is projected to account for over 40% of the total market value by 2033.
- Key Growth Drivers in the Consumer Segment:
- Rising disposable incomes: Enabling consumers to spend more on quality food products.
- Urbanization: Concentrating demand and creating a need for efficient last-mile delivery solutions.
- Growing awareness of health and wellness: Leading to increased demand for organic, sustainable, and traceable food options.
- Advancements in cold chain logistics: Ensuring the freshness and quality of perishable goods during transit.
- Ubiquity of smartphones and internet access: Facilitating seamless online purchasing experiences.
In terms of Types, Business To Consumer (B2C) transactions are currently leading the market and are expected to maintain their dominance, reflecting the direct-to-consumer trend. However, the Business To Business (B2B) segment is also experiencing significant expansion, fueled by the digitalization of supply chains for food processors, retailers, and hospitality businesses.
- Key Growth Drivers in the B2B Segment:
- Demand for supply chain efficiency: Businesses are seeking to streamline procurement processes and reduce costs.
- Need for reliable sourcing and quality assurance: E-commerce platforms offer greater transparency and control over product origin and quality.
- Digitalization of procurement systems: Integration of online platforms with enterprise resource planning (ERP) systems.
- Growth of the food processing industry: Requiring large volumes of raw agricultural materials.
- Government initiatives to modernize agricultural supply chains: Encouraging the adoption of digital solutions.
Government Procurement is another crucial application, especially in developing nations, where e-platforms are used for bulk purchasing of agricultural commodities for food security programs and disaster relief. While currently smaller in market share, its strategic importance ensures steady growth. The "Other" application segment encompasses various niche markets, including agricultural inputs for research institutions and specialized trading platforms.
Agricultural E-commerce Product Analysis
The Agricultural E-commerce product landscape is characterized by a diverse range of offerings, from raw agricultural commodities to value-added processed goods and essential farm inputs. Innovations are increasingly focused on enhancing traceability through blockchain technology, offering real-time market price information, and providing access to specialized agricultural machinery and services. Applications span direct sales of fruits, vegetables, grains, and livestock, as well as the procurement of seeds, fertilizers, and pesticides. Competitive advantages are being built on superior logistics, secure payment gateways, robust quality control measures, and personalized customer support. Technological advancements like AI-powered recommendation engines and demand forecasting tools are further differentiating offerings and providing significant market fit.
Key Drivers, Barriers & Challenges in Agricultural E-commerce
The Agricultural E-commerce market is propelled by a potent combination of technological advancements, favorable economic conditions, and supportive government policies. Key drivers include the widespread adoption of smartphones and internet connectivity, enabling greater access for farmers and consumers. Economic factors such as rising disposable incomes and growing demand for convenient food sourcing are significant motivators. Policy-driven initiatives aimed at modernizing agricultural sectors and promoting digital trade further accelerate growth.
Conversely, significant challenges and restraints impact market expansion. Supply chain issues, particularly in last-mile delivery and cold chain management for perishable goods, remain a major hurdle. Regulatory hurdles, including varying food safety standards and complex import/export regulations across different regions, can impede cross-border trade. Competitive pressures from established offline channels and the need for substantial initial investment in technology and infrastructure also pose challenges. For example, the cost of building out efficient logistics networks can exceed \$10 billion in some regions.
Growth Drivers in the Agricultural E-commerce Market
The Agricultural E-commerce market's growth is fueled by several key drivers. Technologically, the proliferation of mobile internet access and the development of user-friendly e-commerce platforms are paramount. Economically, increasing global demand for food, coupled with rising consumer purchasing power in emerging markets, creates a significant market opportunity. Regulatory drivers include government initiatives promoting digital agriculture, e-governance in food procurement, and policies aimed at improving food supply chain efficiency and transparency. For instance, national digital agriculture strategies are projected to unlock over \$20 billion in market value.
Challenges Impacting Agricultural E-commerce Growth
Despite its promising trajectory, the Agricultural E-commerce market faces considerable challenges. Regulatory complexities, including varying food safety standards, labeling requirements, and international trade policies, can create significant barriers. Supply chain issues, such as inefficient last-mile delivery, lack of adequate cold chain infrastructure, and logistics disruptions, particularly in rural areas, contribute to product spoilage and increased costs, impacting an estimated 15% of produce. Competitive pressures from established traditional markets and the substantial upfront investment required for technology and infrastructure development also restrain rapid growth.
Key Players Shaping the Agricultural E-commerce Market
- Amazon
- Alibaba Group
- JD.com Company
- Yihaodian
- COFCO Group
- SF Express
- Benlai Holding Group
- Natures Basket Limited.
- Supermarket Grocery Supplies Pvt Ltd
- Grofers India Pvt
- Ninayo
- FarmFresh
Significant Agricultural E-commerce Industry Milestones
- 2019: Launch of enhanced traceability features using blockchain by major platforms, increasing consumer trust.
- 2020: Accelerated adoption of e-commerce for agricultural inputs and produce due to global pandemic-related disruptions, leading to an estimated 30% increase in online farm-to-consumer sales.
- 2021: Significant investment surge in agritech startups focusing on AI and IoT for supply chain optimization, totaling over \$5 billion globally.
- 2022: Expansion of dedicated agricultural e-commerce platforms in Southeast Asia and Africa, aiming to onboard millions of smallholder farmers.
- 2023: Increased regulatory focus on food safety and digital product passports in key markets, driving demand for transparent e-commerce solutions.
- 2024: Introduction of sophisticated AI-driven demand forecasting tools by leading platforms to reduce waste and improve market efficiency.
Future Outlook for Agricultural E-commerce Market
The future outlook for the Agricultural E-commerce market is exceptionally robust, driven by persistent technological innovation and evolving consumer behaviors. Strategic opportunities lie in further integrating AI and machine learning for predictive analytics, enhancing cold chain logistics, and expanding into underserved rural markets. The market is expected to witness continued consolidation through mergers and acquisitions, leading to more integrated supply chain solutions. Digital platforms will increasingly become essential tools for farmers, offering access to wider markets, better pricing, and crucial agricultural intelligence. The projected growth indicates a market value exceeding \$10 trillion by 2033, with sustainability and traceability becoming paramount differentiators.
Agricultural E-commerce Segmentation
-
1. Application
- 1.1. Government Procurement
- 1.2. Enterprise
- 1.3. Consumer
- 1.4. Other
-
2. Types
- 2.1. Business To Business
- 2.2. Business To Consumer
Agricultural E-commerce Segmentation By Geography
-
1. North America
- 1.1. United States
- 1.2. Canada
- 1.3. Mexico
-
2. South America
- 2.1. Brazil
- 2.2. Argentina
- 2.3. Rest of South America
-
3. Europe
- 3.1. United Kingdom
- 3.2. Germany
- 3.3. France
- 3.4. Italy
- 3.5. Spain
- 3.6. Russia
- 3.7. Benelux
- 3.8. Nordics
- 3.9. Rest of Europe
-
4. Middle East & Africa
- 4.1. Turkey
- 4.2. Israel
- 4.3. GCC
- 4.4. North Africa
- 4.5. South Africa
- 4.6. Rest of Middle East & Africa
-
5. Asia Pacific
- 5.1. China
- 5.2. India
- 5.3. Japan
- 5.4. South Korea
- 5.5. ASEAN
- 5.6. Oceania
- 5.7. Rest of Asia Pacific
Agricultural E-commerce Regional Market Share
Geographic Coverage of Agricultural E-commerce
Agricultural E-commerce REPORT HIGHLIGHTS
| Aspects | Details |
|---|---|
| Study Period | 2020-2034 |
| Base Year | 2025 |
| Estimated Year | 2026 |
| Forecast Period | 2026-2034 |
| Historical Period | 2020-2025 |
| Growth Rate | CAGR of 9.6% from 2020-2034 |
| Segmentation |
|
Table of Contents
- 1. Introduction
- 1.1. Research Scope
- 1.2. Market Segmentation
- 1.3. Research Objective
- 1.4. Definitions and Assumptions
- 2. Executive Summary
- 2.1. Market Snapshot
- 3. Market Dynamics
- 3.1. Market Drivers
- 3.2. Market Restrains
- 3.3. Market Trends
- 3.4. Market Opportunities
- 4. Market Factor Analysis
- 4.1. Porters Five Forces
- 4.1.1. Bargaining Power of Suppliers
- 4.1.2. Bargaining Power of Buyers
- 4.1.3. Threat of New Entrants
- 4.1.4. Threat of Substitutes
- 4.1.5. Competitive Rivalry
- 4.2. PESTEL analysis
- 4.3. BCG Analysis
- 4.3.1. Stars (High Growth, High Market Share)
- 4.3.2. Cash Cows (Low Growth, High Market Share)
- 4.3.3. Question Mark (High Growth, Low Market Share)
- 4.3.4. Dogs (Low Growth, Low Market Share)
- 4.4. Ansoff Matrix Analysis
- 4.5. Supply Chain Analysis
- 4.6. Regulatory Landscape
- 4.7. Current Market Potential and Opportunity Assessment (TAM–SAM–SOM Framework)
- 4.8. TIR Analyst Note
- 4.1. Porters Five Forces
- 5. Market Analysis, Insights and Forecast 2021-2033
- 5.1. Market Analysis, Insights and Forecast - by Application
- 5.1.1. Government Procurement
- 5.1.2. Enterprise
- 5.1.3. Consumer
- 5.1.4. Other
- 5.2. Market Analysis, Insights and Forecast - by Types
- 5.2.1. Business To Business
- 5.2.2. Business To Consumer
- 5.3. Market Analysis, Insights and Forecast - by Region
- 5.3.1. North America
- 5.3.2. South America
- 5.3.3. Europe
- 5.3.4. Middle East & Africa
- 5.3.5. Asia Pacific
- 5.1. Market Analysis, Insights and Forecast - by Application
- 6. Global Agricultural E-commerce Analysis, Insights and Forecast, 2021-2033
- 6.1. Market Analysis, Insights and Forecast - by Application
- 6.1.1. Government Procurement
- 6.1.2. Enterprise
- 6.1.3. Consumer
- 6.1.4. Other
- 6.2. Market Analysis, Insights and Forecast - by Types
- 6.2.1. Business To Business
- 6.2.2. Business To Consumer
- 6.1. Market Analysis, Insights and Forecast - by Application
- 7. North America Agricultural E-commerce Analysis, Insights and Forecast, 2020-2032
- 7.1. Market Analysis, Insights and Forecast - by Application
- 7.1.1. Government Procurement
- 7.1.2. Enterprise
- 7.1.3. Consumer
- 7.1.4. Other
- 7.2. Market Analysis, Insights and Forecast - by Types
- 7.2.1. Business To Business
- 7.2.2. Business To Consumer
- 7.1. Market Analysis, Insights and Forecast - by Application
- 8. South America Agricultural E-commerce Analysis, Insights and Forecast, 2020-2032
- 8.1. Market Analysis, Insights and Forecast - by Application
- 8.1.1. Government Procurement
- 8.1.2. Enterprise
- 8.1.3. Consumer
- 8.1.4. Other
- 8.2. Market Analysis, Insights and Forecast - by Types
- 8.2.1. Business To Business
- 8.2.2. Business To Consumer
- 8.1. Market Analysis, Insights and Forecast - by Application
- 9. Europe Agricultural E-commerce Analysis, Insights and Forecast, 2020-2032
- 9.1. Market Analysis, Insights and Forecast - by Application
- 9.1.1. Government Procurement
- 9.1.2. Enterprise
- 9.1.3. Consumer
- 9.1.4. Other
- 9.2. Market Analysis, Insights and Forecast - by Types
- 9.2.1. Business To Business
- 9.2.2. Business To Consumer
- 9.1. Market Analysis, Insights and Forecast - by Application
- 10. Middle East & Africa Agricultural E-commerce Analysis, Insights and Forecast, 2020-2032
- 10.1. Market Analysis, Insights and Forecast - by Application
- 10.1.1. Government Procurement
- 10.1.2. Enterprise
- 10.1.3. Consumer
- 10.1.4. Other
- 10.2. Market Analysis, Insights and Forecast - by Types
- 10.2.1. Business To Business
- 10.2.2. Business To Consumer
- 10.1. Market Analysis, Insights and Forecast - by Application
- 11. Asia Pacific Agricultural E-commerce Analysis, Insights and Forecast, 2020-2032
- 11.1. Market Analysis, Insights and Forecast - by Application
- 11.1.1. Government Procurement
- 11.1.2. Enterprise
- 11.1.3. Consumer
- 11.1.4. Other
- 11.2. Market Analysis, Insights and Forecast - by Types
- 11.2.1. Business To Business
- 11.2.2. Business To Consumer
- 11.1. Market Analysis, Insights and Forecast - by Application
- 12. Competitive Analysis
- 12.1. Company Profiles
- 12.1.1 Amazon
- 12.1.1.1. Company Overview
- 12.1.1.2. Products
- 12.1.1.3. Company Financials
- 12.1.1.4. SWOT Analysis
- 12.1.2 Alibaba Group
- 12.1.2.1. Company Overview
- 12.1.2.2. Products
- 12.1.2.3. Company Financials
- 12.1.2.4. SWOT Analysis
- 12.1.3 JD.com Company
- 12.1.3.1. Company Overview
- 12.1.3.2. Products
- 12.1.3.3. Company Financials
- 12.1.3.4. SWOT Analysis
- 12.1.4 Yihaodian
- 12.1.4.1. Company Overview
- 12.1.4.2. Products
- 12.1.4.3. Company Financials
- 12.1.4.4. SWOT Analysis
- 12.1.5 COFCO Group
- 12.1.5.1. Company Overview
- 12.1.5.2. Products
- 12.1.5.3. Company Financials
- 12.1.5.4. SWOT Analysis
- 12.1.6 SF Express
- 12.1.6.1. Company Overview
- 12.1.6.2. Products
- 12.1.6.3. Company Financials
- 12.1.6.4. SWOT Analysis
- 12.1.7 Benlai Holding Group
- 12.1.7.1. Company Overview
- 12.1.7.2. Products
- 12.1.7.3. Company Financials
- 12.1.7.4. SWOT Analysis
- 12.1.8 Natures Basket Limited.
- 12.1.8.1. Company Overview
- 12.1.8.2. Products
- 12.1.8.3. Company Financials
- 12.1.8.4. SWOT Analysis
- 12.1.9 Supermarket Grocery Supplies Pvt Ltd
- 12.1.9.1. Company Overview
- 12.1.9.2. Products
- 12.1.9.3. Company Financials
- 12.1.9.4. SWOT Analysis
- 12.1.10 Grofers India Pvt
- 12.1.10.1. Company Overview
- 12.1.10.2. Products
- 12.1.10.3. Company Financials
- 12.1.10.4. SWOT Analysis
- 12.1.11 Ninayo
- 12.1.11.1. Company Overview
- 12.1.11.2. Products
- 12.1.11.3. Company Financials
- 12.1.11.4. SWOT Analysis
- 12.1.12 FarmFresh
- 12.1.12.1. Company Overview
- 12.1.12.2. Products
- 12.1.12.3. Company Financials
- 12.1.12.4. SWOT Analysis
- 12.1.1 Amazon
- 12.2. Market Entropy
- 12.2.1 Company's Key Areas Served
- 12.2.2 Recent Developments
- 12.3. Company Market Share Analysis 2025
- 12.3.1 Top 5 Companies Market Share Analysis
- 12.3.2 Top 3 Companies Market Share Analysis
- 12.4. List of Potential Customers
- 13. Research Methodology
List of Figures
- Figure 1: Global Agricultural E-commerce Revenue Breakdown (billion, %) by Region 2025 & 2033
- Figure 2: North America Agricultural E-commerce Revenue (billion), by Application 2025 & 2033
- Figure 3: North America Agricultural E-commerce Revenue Share (%), by Application 2025 & 2033
- Figure 4: North America Agricultural E-commerce Revenue (billion), by Types 2025 & 2033
- Figure 5: North America Agricultural E-commerce Revenue Share (%), by Types 2025 & 2033
- Figure 6: North America Agricultural E-commerce Revenue (billion), by Country 2025 & 2033
- Figure 7: North America Agricultural E-commerce Revenue Share (%), by Country 2025 & 2033
- Figure 8: South America Agricultural E-commerce Revenue (billion), by Application 2025 & 2033
- Figure 9: South America Agricultural E-commerce Revenue Share (%), by Application 2025 & 2033
- Figure 10: South America Agricultural E-commerce Revenue (billion), by Types 2025 & 2033
- Figure 11: South America Agricultural E-commerce Revenue Share (%), by Types 2025 & 2033
- Figure 12: South America Agricultural E-commerce Revenue (billion), by Country 2025 & 2033
- Figure 13: South America Agricultural E-commerce Revenue Share (%), by Country 2025 & 2033
- Figure 14: Europe Agricultural E-commerce Revenue (billion), by Application 2025 & 2033
- Figure 15: Europe Agricultural E-commerce Revenue Share (%), by Application 2025 & 2033
- Figure 16: Europe Agricultural E-commerce Revenue (billion), by Types 2025 & 2033
- Figure 17: Europe Agricultural E-commerce Revenue Share (%), by Types 2025 & 2033
- Figure 18: Europe Agricultural E-commerce Revenue (billion), by Country 2025 & 2033
- Figure 19: Europe Agricultural E-commerce Revenue Share (%), by Country 2025 & 2033
- Figure 20: Middle East & Africa Agricultural E-commerce Revenue (billion), by Application 2025 & 2033
- Figure 21: Middle East & Africa Agricultural E-commerce Revenue Share (%), by Application 2025 & 2033
- Figure 22: Middle East & Africa Agricultural E-commerce Revenue (billion), by Types 2025 & 2033
- Figure 23: Middle East & Africa Agricultural E-commerce Revenue Share (%), by Types 2025 & 2033
- Figure 24: Middle East & Africa Agricultural E-commerce Revenue (billion), by Country 2025 & 2033
- Figure 25: Middle East & Africa Agricultural E-commerce Revenue Share (%), by Country 2025 & 2033
- Figure 26: Asia Pacific Agricultural E-commerce Revenue (billion), by Application 2025 & 2033
- Figure 27: Asia Pacific Agricultural E-commerce Revenue Share (%), by Application 2025 & 2033
- Figure 28: Asia Pacific Agricultural E-commerce Revenue (billion), by Types 2025 & 2033
- Figure 29: Asia Pacific Agricultural E-commerce Revenue Share (%), by Types 2025 & 2033
- Figure 30: Asia Pacific Agricultural E-commerce Revenue (billion), by Country 2025 & 2033
- Figure 31: Asia Pacific Agricultural E-commerce Revenue Share (%), by Country 2025 & 2033
List of Tables
- Table 1: Global Agricultural E-commerce Revenue billion Forecast, by Application 2020 & 2033
- Table 2: Global Agricultural E-commerce Revenue billion Forecast, by Types 2020 & 2033
- Table 3: Global Agricultural E-commerce Revenue billion Forecast, by Region 2020 & 2033
- Table 4: Global Agricultural E-commerce Revenue billion Forecast, by Application 2020 & 2033
- Table 5: Global Agricultural E-commerce Revenue billion Forecast, by Types 2020 & 2033
- Table 6: Global Agricultural E-commerce Revenue billion Forecast, by Country 2020 & 2033
- Table 7: United States Agricultural E-commerce Revenue (billion) Forecast, by Application 2020 & 2033
- Table 8: Canada Agricultural E-commerce Revenue (billion) Forecast, by Application 2020 & 2033
- Table 9: Mexico Agricultural E-commerce Revenue (billion) Forecast, by Application 2020 & 2033
- Table 10: Global Agricultural E-commerce Revenue billion Forecast, by Application 2020 & 2033
- Table 11: Global Agricultural E-commerce Revenue billion Forecast, by Types 2020 & 2033
- Table 12: Global Agricultural E-commerce Revenue billion Forecast, by Country 2020 & 2033
- Table 13: Brazil Agricultural E-commerce Revenue (billion) Forecast, by Application 2020 & 2033
- Table 14: Argentina Agricultural E-commerce Revenue (billion) Forecast, by Application 2020 & 2033
- Table 15: Rest of South America Agricultural E-commerce Revenue (billion) Forecast, by Application 2020 & 2033
- Table 16: Global Agricultural E-commerce Revenue billion Forecast, by Application 2020 & 2033
- Table 17: Global Agricultural E-commerce Revenue billion Forecast, by Types 2020 & 2033
- Table 18: Global Agricultural E-commerce Revenue billion Forecast, by Country 2020 & 2033
- Table 19: United Kingdom Agricultural E-commerce Revenue (billion) Forecast, by Application 2020 & 2033
- Table 20: Germany Agricultural E-commerce Revenue (billion) Forecast, by Application 2020 & 2033
- Table 21: France Agricultural E-commerce Revenue (billion) Forecast, by Application 2020 & 2033
- Table 22: Italy Agricultural E-commerce Revenue (billion) Forecast, by Application 2020 & 2033
- Table 23: Spain Agricultural E-commerce Revenue (billion) Forecast, by Application 2020 & 2033
- Table 24: Russia Agricultural E-commerce Revenue (billion) Forecast, by Application 2020 & 2033
- Table 25: Benelux Agricultural E-commerce Revenue (billion) Forecast, by Application 2020 & 2033
- Table 26: Nordics Agricultural E-commerce Revenue (billion) Forecast, by Application 2020 & 2033
- Table 27: Rest of Europe Agricultural E-commerce Revenue (billion) Forecast, by Application 2020 & 2033
- Table 28: Global Agricultural E-commerce Revenue billion Forecast, by Application 2020 & 2033
- Table 29: Global Agricultural E-commerce Revenue billion Forecast, by Types 2020 & 2033
- Table 30: Global Agricultural E-commerce Revenue billion Forecast, by Country 2020 & 2033
- Table 31: Turkey Agricultural E-commerce Revenue (billion) Forecast, by Application 2020 & 2033
- Table 32: Israel Agricultural E-commerce Revenue (billion) Forecast, by Application 2020 & 2033
- Table 33: GCC Agricultural E-commerce Revenue (billion) Forecast, by Application 2020 & 2033
- Table 34: North Africa Agricultural E-commerce Revenue (billion) Forecast, by Application 2020 & 2033
- Table 35: South Africa Agricultural E-commerce Revenue (billion) Forecast, by Application 2020 & 2033
- Table 36: Rest of Middle East & Africa Agricultural E-commerce Revenue (billion) Forecast, by Application 2020 & 2033
- Table 37: Global Agricultural E-commerce Revenue billion Forecast, by Application 2020 & 2033
- Table 38: Global Agricultural E-commerce Revenue billion Forecast, by Types 2020 & 2033
- Table 39: Global Agricultural E-commerce Revenue billion Forecast, by Country 2020 & 2033
- Table 40: China Agricultural E-commerce Revenue (billion) Forecast, by Application 2020 & 2033
- Table 41: India Agricultural E-commerce Revenue (billion) Forecast, by Application 2020 & 2033
- Table 42: Japan Agricultural E-commerce Revenue (billion) Forecast, by Application 2020 & 2033
- Table 43: South Korea Agricultural E-commerce Revenue (billion) Forecast, by Application 2020 & 2033
- Table 44: ASEAN Agricultural E-commerce Revenue (billion) Forecast, by Application 2020 & 2033
- Table 45: Oceania Agricultural E-commerce Revenue (billion) Forecast, by Application 2020 & 2033
- Table 46: Rest of Asia Pacific Agricultural E-commerce Revenue (billion) Forecast, by Application 2020 & 2033
Frequently Asked Questions
1. What is the projected Compound Annual Growth Rate (CAGR) of the Agricultural E-commerce?
The projected CAGR is approximately 9.6%.
2. Which companies are prominent players in the Agricultural E-commerce?
Key companies in the market include Amazon, Alibaba Group, JD.com Company, Yihaodian, COFCO Group, SF Express, Benlai Holding Group, Natures Basket Limited., Supermarket Grocery Supplies Pvt Ltd, Grofers India Pvt, Ninayo, FarmFresh.
3. What are the main segments of the Agricultural E-commerce?
The market segments include Application, Types.
4. Can you provide details about the market size?
The market size is estimated to be USD 46.52 billion as of 2022.
5. What are some drivers contributing to market growth?
N/A
6. What are the notable trends driving market growth?
N/A
7. Are there any restraints impacting market growth?
N/A
8. Can you provide examples of recent developments in the market?
N/A
9. What pricing options are available for accessing the report?
Pricing options include single-user, multi-user, and enterprise licenses priced at USD 2900.00, USD 4350.00, and USD 5800.00 respectively.
10. Is the market size provided in terms of value or volume?
The market size is provided in terms of value, measured in billion.
11. Are there any specific market keywords associated with the report?
Yes, the market keyword associated with the report is "Agricultural E-commerce," which aids in identifying and referencing the specific market segment covered.
12. How do I determine which pricing option suits my needs best?
The pricing options vary based on user requirements and access needs. Individual users may opt for single-user licenses, while businesses requiring broader access may choose multi-user or enterprise licenses for cost-effective access to the report.
13. Are there any additional resources or data provided in the Agricultural E-commerce report?
While the report offers comprehensive insights, it's advisable to review the specific contents or supplementary materials provided to ascertain if additional resources or data are available.
14. How can I stay updated on further developments or reports in the Agricultural E-commerce?
To stay informed about further developments, trends, and reports in the Agricultural E-commerce, consider subscribing to industry newsletters, following relevant companies and organizations, or regularly checking reputable industry news sources and publications.
Methodology
Step 1 - Identification of Relevant Samples Size from Population Database


Step 2 - Approaches for Defining Global Market Size (Value, Volume* & Price*)

Note*: In applicable scenarios
Step 3 - Data Sources
Primary Research
- Web Analytics
- Survey Reports
- Research Institute
- Latest Research Reports
- Opinion Leaders
Secondary Research
- Annual Reports
- White Paper
- Latest Press Release
- Industry Association
- Paid Database
- Investor Presentations

Step 4 - Data Triangulation
Involves using different sources of information in order to increase the validity of a study
These sources are likely to be stakeholders in a program - participants, other researchers, program staff, other community members, and so on.
Then we put all data in single framework & apply various statistical tools to find out the dynamic on the market.
During the analysis stage, feedback from the stakeholder groups would be compared to determine areas of agreement as well as areas of divergence