

Key Insights
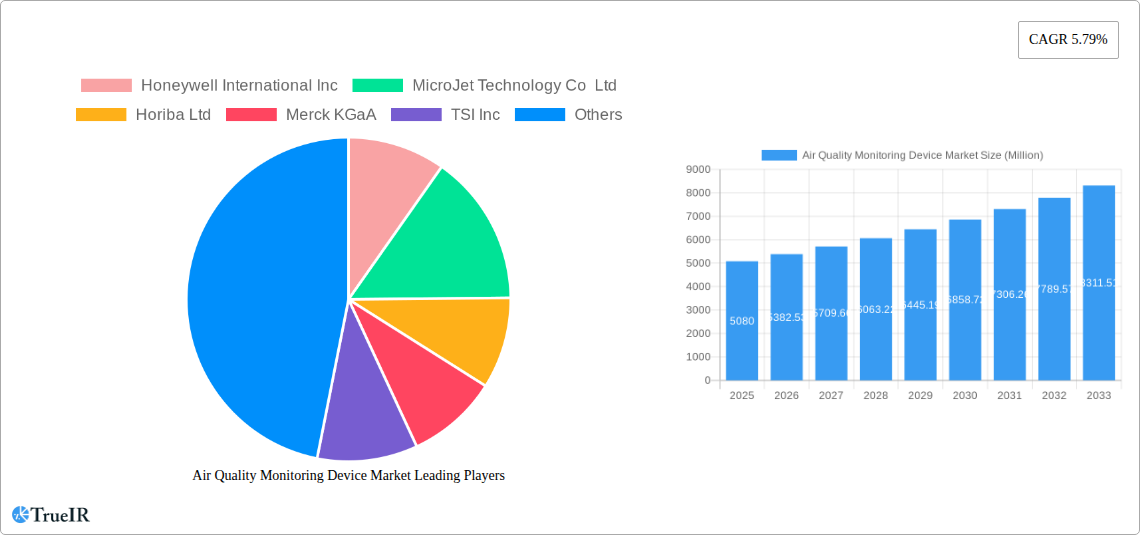
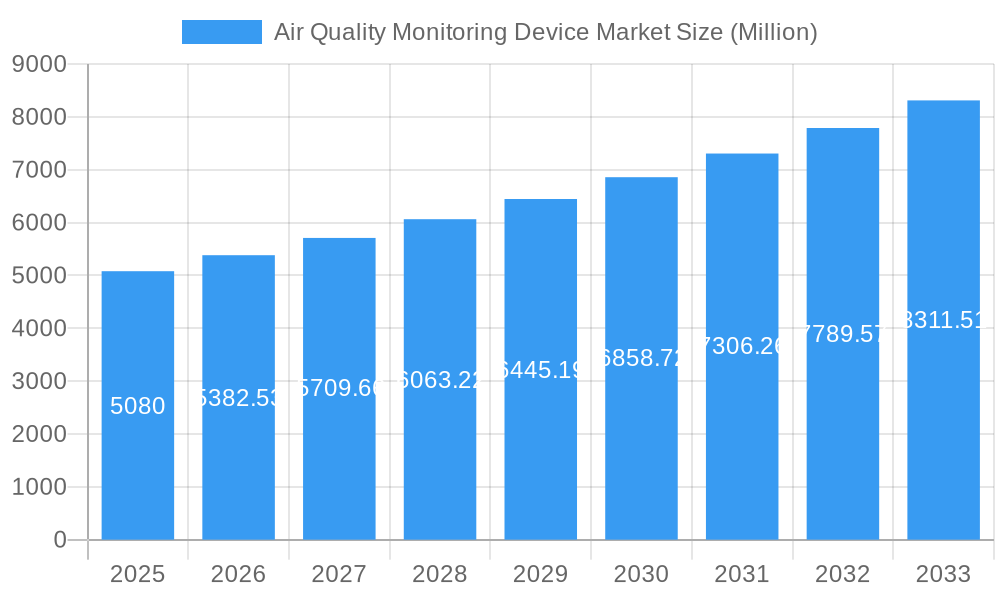
The Air Quality Monitoring Device market is experiencing robust growth, projected to reach \$5.08 billion in 2025 and maintain a Compound Annual Growth Rate (CAGR) of 5.79% from 2025 to 2033. This expansion is driven by several key factors. Increasing environmental concerns and stricter government regulations regarding air quality are pushing both residential and commercial sectors to adopt these devices. The rising prevalence of respiratory illnesses linked to poor air quality further fuels demand. Technological advancements, particularly in sensor technology and data analytics capabilities, are leading to more accurate, reliable, and user-friendly monitoring solutions. The market is witnessing a shift towards continuous monitoring systems, offering real-time insights and enabling proactive measures to mitigate air pollution. Growth is particularly strong in developing economies experiencing rapid urbanization and industrialization, where air pollution is a significant public health concern. The market segments show strong growth across product types (indoor and outdoor monitors gaining equal traction), sampling methods (continuous monitoring showing significant gains compared to manual and intermittent), and end-users (with residential, commercial, and power generation sectors leading). The competitive landscape is diverse, with established players like Honeywell, Thermo Fisher Scientific, and Siemens alongside innovative smaller companies contributing to market innovation. Regional growth is expected to be geographically diverse, with North America and Asia Pacific projected as major market drivers due to high adoption rates and stringent regulatory environments.
Air Quality Monitoring Device Market Market Size (In Billion)
The continued growth of the Air Quality Monitoring Device market hinges on several factors. Sustained investment in research and development will be crucial for improving sensor accuracy, reducing device costs, and enhancing data analysis capabilities. Government initiatives promoting air quality monitoring and providing financial incentives for adoption will play a significant role. The growing awareness among consumers about the impact of air pollution on their health will drive the demand for residential monitoring devices. Furthermore, integration of air quality monitoring data with smart city initiatives and the Internet of Things (IoT) will present lucrative opportunities for market expansion. Challenges include the high initial cost of some devices, the need for skilled personnel to operate and maintain sophisticated systems, and the potential for data privacy concerns in the era of connected devices. Nevertheless, the overall market outlook remains positive, driven by strong underlying demand and continuous technological advancements.
Air Quality Monitoring Device Market Company Market Share
Air Quality Monitoring Device Market: A Comprehensive Report (2019-2033)
This dynamic report provides a comprehensive analysis of the Air Quality Monitoring Device market, offering invaluable insights for stakeholders across the value chain. Leveraging extensive market research and data analysis, this report covers market size, segmentation, competitive landscape, key drivers and challenges, and future growth projections. The study period spans from 2019 to 2033, with 2025 serving as the base and estimated year.
Air Quality Monitoring Device Market Structure & Competitive Landscape
The Air Quality Monitoring Device market exhibits a moderately concentrated structure, with a few dominant players holding significant market share. The Herfindahl-Hirschman Index (HHI) for 2024 is estimated at xx, indicating a competitive landscape with room for both established players and new entrants. Innovation plays a crucial role, driving the development of advanced sensors, data analytics capabilities, and connectivity features. Stringent environmental regulations globally are significant market drivers, pushing the adoption of sophisticated monitoring devices. Product substitutes, such as less accurate manual methods or simpler monitoring systems, are facing increasing pressure due to the demand for precise and continuous data.
The market is segmented based on product type (indoor and outdoor monitors), sampling method (continuous, manual, and intermittent), and end-user (residential and commercial, power generation, petrochemicals, and other end-users). Residential and commercial sectors currently dominate the market, followed by power generation. Mergers and acquisitions (M&A) activity has been moderate, with xx M&A deals recorded between 2019 and 2024, primarily focused on consolidating technological expertise and expanding market reach. This activity indicates a growing focus on strategic partnerships and acquisitions.
- Market Concentration: HHI (2024): xx
- M&A Activity (2019-2024): xx deals
- Key Segmentation: Product type, sampling method, end-user.
- Innovation Drivers: Advanced sensors, data analytics, connectivity.
- Regulatory Impacts: Stringent environmental regulations are driving demand.
Air Quality Monitoring Device Market Market Trends & Opportunities
The global Air Quality Monitoring Device market is experiencing robust growth, with a projected Compound Annual Growth Rate (CAGR) of xx% during the forecast period (2025-2033). The market size is estimated at xx Million in 2025 and is anticipated to reach xx Million by 2033. This growth is fueled by rising environmental awareness, increasing urbanization, stricter emission control regulations, and the growing adoption of smart cities initiatives. Technological advancements, such as the development of miniaturized, low-cost sensors and improved data analytics tools, are further enhancing market penetration. Consumer preferences are shifting towards accurate, reliable, and user-friendly devices with features like real-time data visualization and remote monitoring capabilities. The competitive landscape is dynamic, with established players focusing on innovation and expansion while new entrants are leveraging niche technologies and market segments. Market penetration rates are gradually increasing, especially in developing economies, driven by government initiatives promoting air quality monitoring.
Dominant Markets & Segments in Air Quality Monitoring Device Market
The North American region is currently the dominant market, followed by Europe and Asia-Pacific. Within these regions, specific countries such as the United States, China, and Germany are leading the market growth due to robust industrial activity, strong environmental regulations, and significant investments in air quality monitoring infrastructure.
- Leading Region: North America
- Leading Countries: United States, China, Germany
Key Growth Drivers by Segment:
- Product Type: The demand for outdoor monitors is higher due to increasing environmental concerns and regulations concerning ambient air quality.
- Sampling Method: Continuous monitoring systems are experiencing higher growth due to the need for real-time data analysis and early warning systems.
- End-User: The residential and commercial sectors currently hold the largest market share. However, the power generation and petrochemical sectors are exhibiting the fastest growth due to stringent emission control norms and the increasing importance of environmental compliance.
The dominance of certain segments is attributed to factors like existing infrastructure, government policies promoting environmental monitoring, and the prevalence of industries that heavily impact air quality. These drivers influence the adoption rates and create opportunities for specialized monitoring devices.
Air Quality Monitoring Device Market Product Analysis
Recent product innovations include the development of portable, wireless, and IoT-enabled air quality monitors, offering improved user experience, remote monitoring capabilities, and seamless data integration. These advancements cater to the growing demand for real-time data, user-friendly interfaces, and data-driven insights. Key competitive advantages include sensor accuracy, data analytics capabilities, connectivity features, and the cost-effectiveness of solutions. The market is witnessing a trend towards sophisticated devices that provide comprehensive data on various pollutants, delivering valuable insights for environmental protection and public health.
Key Drivers, Barriers & Challenges in Air Quality Monitoring Device Market
Key Drivers: Stringent government regulations aimed at reducing air pollution are a major driver. The growing adoption of smart cities initiatives, coupled with advancements in sensor technology and data analytics, is further propelling market growth. Increased public awareness of air quality issues and associated health risks also contributes to the demand for monitoring devices. Rising investments in environmental monitoring infrastructure across several countries are fueling the market expansion.
Key Challenges: Supply chain disruptions caused by geopolitical factors and the COVID-19 pandemic are creating challenges for manufacturers. High initial costs of advanced monitoring systems can limit adoption, particularly in developing countries. The complexity of regulatory frameworks and compliance requirements across different regions presents challenges for manufacturers and end-users. Intense competition from both established and emerging players necessitates continuous innovation and product differentiation. The accurate and reliable calibration of monitoring equipment poses significant challenges.
Growth Drivers in the Air Quality Monitoring Device Market Market
Technological advancements in sensor technology, miniaturization, and data analytics capabilities are key growth drivers. Increasing government regulations to control air pollution levels are also driving the adoption of air quality monitoring devices. Furthermore, the growing awareness of air pollution's impact on human health and the environment significantly boosts demand.
Challenges Impacting Air Quality Monitoring Device Market Growth
High initial investment costs for advanced monitoring systems, especially for developing nations, pose a major barrier. Regulatory complexities across different regions create hurdles for manufacturers and importers. The supply chain is susceptible to disruptions due to geopolitical uncertainties and material shortages. Finally, competitive pressures among market players need constant innovation and cost-effective solutions.
Key Players Shaping the Air Quality Monitoring Device Market Market
- Honeywell International Inc
- MicroJet Technology Co Ltd
- Horiba Ltd
- Merck KGaA
- TSI Inc
- Thermo Fisher Scientific Inc
- Hawa Dawa GmbH
- Emerson Electric Co
- Siemens AG
- Agilent Technologies Inc
- 3M Co
- Teledyne Technologies Inc
Significant Air Quality Monitoring Device Market Industry Milestones
- March 2023: Tyndall National Institute participates in a European project to improve air quality monitoring, receiving EC funding.
- February 2022: Hawadawa partners with Thies Clima to offer a comprehensive air quality and weather data solution.
Future Outlook for Air Quality Monitoring Device Market Market
The Air Quality Monitoring Device market is poised for continued growth, driven by technological innovations, stringent environmental regulations, and rising consumer awareness. Strategic opportunities exist for companies to develop and deploy advanced monitoring solutions that integrate seamlessly with smart city infrastructure and provide comprehensive data insights. The market's potential is substantial, with significant opportunities for expansion in developing economies and niche applications. The ongoing integration of IoT and AI will enhance data analysis and improve decision-making capabilities in environmental management.
Air Quality Monitoring Device Market Segmentation
-
1. Product Type
- 1.1. Indoor Monitor
- 1.2. Outdoor Monitor
-
2. Sampling Method
- 2.1. Continuous
- 2.2. Manual
- 2.3. Intermittent
-
3. End User
- 3.1. Residential and Commercial
- 3.2. Power Generation
- 3.3. Petrochemicals
- 3.4. Other End Users
Air Quality Monitoring Device Market Segmentation By Geography
-
1. North America
- 1.1. United States
- 1.2. Canada
- 1.3. Rest of the North America
-
2. Europe
- 2.1. United Kingdom
- 2.2. Spain
- 2.3. Germany
- 2.4. Italy
-
3. Asia
- 3.1. China
- 3.2. Japan
- 3.3. Vietnam
- 3.4. India
- 3.5. Australia and New Zealand
-
4. South America
- 4.1. Brazil
- 4.2. Argentina
-
5. Middle East and Africa
- 5.1. United Arab Emirates
- 5.2. South Africa
- 5.3. Saudi Arabia
- 5.4. Iraq
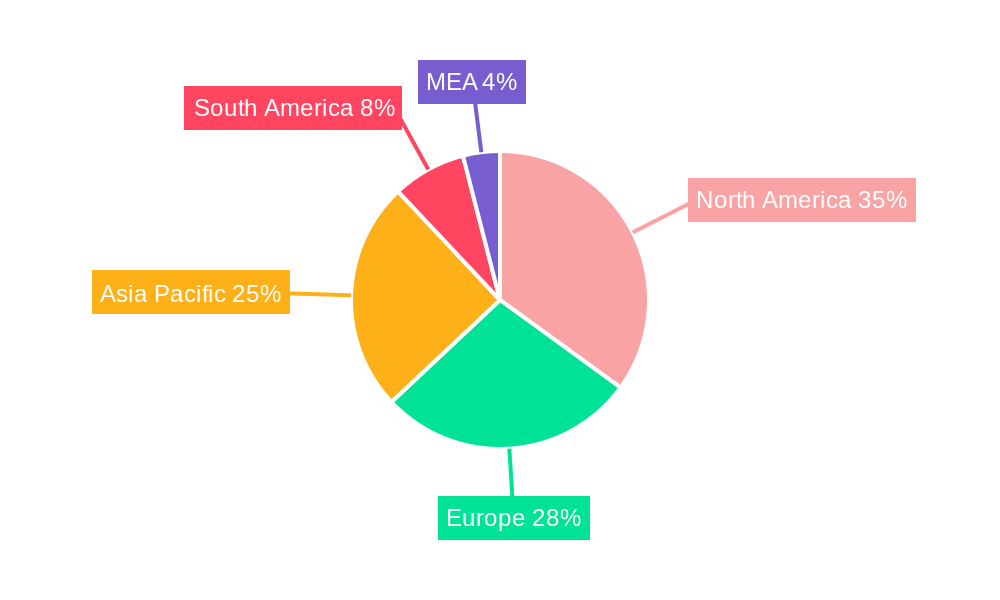
Air Quality Monitoring Device Market Regional Market Share
Geographic Coverage of Air Quality Monitoring Device Market
Air Quality Monitoring Device Market REPORT HIGHLIGHTS
| Aspects | Details |
|---|---|
| Study Period | 2020-2034 |
| Base Year | 2025 |
| Estimated Year | 2026 |
| Forecast Period | 2026-2034 |
| Historical Period | 2020-2025 |
| Growth Rate | CAGR of 5.79% from 2020-2034 |
| Segmentation |
|
Table of Contents
- 1. Introduction
- 1.1. Research Scope
- 1.2. Market Segmentation
- 1.3. Research Objective
- 1.4. Definitions and Assumptions
- 2. Executive Summary
- 2.1. Market Snapshot
- 3. Market Dynamics
- 3.1. Market Drivers
- 3.2. Market Restrains
- 3.3. Market Trends
- 3.4. Market Opportunities
- 4. Market Factor Analysis
- 4.1. Porters Five Forces
- 4.1.1. Bargaining Power of Suppliers
- 4.1.2. Bargaining Power of Buyers
- 4.1.3. Threat of New Entrants
- 4.1.4. Threat of Substitutes
- 4.1.5. Competitive Rivalry
- 4.2. PESTEL analysis
- 4.3. BCG Analysis
- 4.3.1. Stars (High Growth, High Market Share)
- 4.3.2. Cash Cows (Low Growth, High Market Share)
- 4.3.3. Question Mark (High Growth, Low Market Share)
- 4.3.4. Dogs (Low Growth, Low Market Share)
- 4.4. Ansoff Matrix Analysis
- 4.5. Supply Chain Analysis
- 4.6. Regulatory Landscape
- 4.7. Current Market Potential and Opportunity Assessment (TAM–SAM–SOM Framework)
- 4.8. TIR Analyst Note
- 4.1. Porters Five Forces
- 5. Market Analysis, Insights and Forecast 2021-2033
- 5.1. Market Analysis, Insights and Forecast - by Product Type
- 5.1.1. Indoor Monitor
- 5.1.2. Outdoor Monitor
- 5.2. Market Analysis, Insights and Forecast - by Sampling Method
- 5.2.1. Continuous
- 5.2.2. Manual
- 5.2.3. Intermittent
- 5.3. Market Analysis, Insights and Forecast - by End User
- 5.3.1. Residential and Commercial
- 5.3.2. Power Generation
- 5.3.3. Petrochemicals
- 5.3.4. Other End Users
- 5.4. Market Analysis, Insights and Forecast - by Region
- 5.4.1. North America
- 5.4.2. Europe
- 5.4.3. Asia
- 5.4.4. South America
- 5.4.5. Middle East and Africa
- 5.1. Market Analysis, Insights and Forecast - by Product Type
- 6. Global Air Quality Monitoring Device Market Analysis, Insights and Forecast, 2021-2033
- 6.1. Market Analysis, Insights and Forecast - by Product Type
- 6.1.1. Indoor Monitor
- 6.1.2. Outdoor Monitor
- 6.2. Market Analysis, Insights and Forecast - by Sampling Method
- 6.2.1. Continuous
- 6.2.2. Manual
- 6.2.3. Intermittent
- 6.3. Market Analysis, Insights and Forecast - by End User
- 6.3.1. Residential and Commercial
- 6.3.2. Power Generation
- 6.3.3. Petrochemicals
- 6.3.4. Other End Users
- 6.1. Market Analysis, Insights and Forecast - by Product Type
- 7. North America Air Quality Monitoring Device Market Analysis, Insights and Forecast, 2020-2032
- 7.1. Market Analysis, Insights and Forecast - by Product Type
- 7.1.1. Indoor Monitor
- 7.1.2. Outdoor Monitor
- 7.2. Market Analysis, Insights and Forecast - by Sampling Method
- 7.2.1. Continuous
- 7.2.2. Manual
- 7.2.3. Intermittent
- 7.3. Market Analysis, Insights and Forecast - by End User
- 7.3.1. Residential and Commercial
- 7.3.2. Power Generation
- 7.3.3. Petrochemicals
- 7.3.4. Other End Users
- 7.1. Market Analysis, Insights and Forecast - by Product Type
- 8. Europe Air Quality Monitoring Device Market Analysis, Insights and Forecast, 2020-2032
- 8.1. Market Analysis, Insights and Forecast - by Product Type
- 8.1.1. Indoor Monitor
- 8.1.2. Outdoor Monitor
- 8.2. Market Analysis, Insights and Forecast - by Sampling Method
- 8.2.1. Continuous
- 8.2.2. Manual
- 8.2.3. Intermittent
- 8.3. Market Analysis, Insights and Forecast - by End User
- 8.3.1. Residential and Commercial
- 8.3.2. Power Generation
- 8.3.3. Petrochemicals
- 8.3.4. Other End Users
- 8.1. Market Analysis, Insights and Forecast - by Product Type
- 9. Asia Air Quality Monitoring Device Market Analysis, Insights and Forecast, 2020-2032
- 9.1. Market Analysis, Insights and Forecast - by Product Type
- 9.1.1. Indoor Monitor
- 9.1.2. Outdoor Monitor
- 9.2. Market Analysis, Insights and Forecast - by Sampling Method
- 9.2.1. Continuous
- 9.2.2. Manual
- 9.2.3. Intermittent
- 9.3. Market Analysis, Insights and Forecast - by End User
- 9.3.1. Residential and Commercial
- 9.3.2. Power Generation
- 9.3.3. Petrochemicals
- 9.3.4. Other End Users
- 9.1. Market Analysis, Insights and Forecast - by Product Type
- 10. South America Air Quality Monitoring Device Market Analysis, Insights and Forecast, 2020-2032
- 10.1. Market Analysis, Insights and Forecast - by Product Type
- 10.1.1. Indoor Monitor
- 10.1.2. Outdoor Monitor
- 10.2. Market Analysis, Insights and Forecast - by Sampling Method
- 10.2.1. Continuous
- 10.2.2. Manual
- 10.2.3. Intermittent
- 10.3. Market Analysis, Insights and Forecast - by End User
- 10.3.1. Residential and Commercial
- 10.3.2. Power Generation
- 10.3.3. Petrochemicals
- 10.3.4. Other End Users
- 10.1. Market Analysis, Insights and Forecast - by Product Type
- 11. Middle East and Africa Air Quality Monitoring Device Market Analysis, Insights and Forecast, 2020-2032
- 11.1. Market Analysis, Insights and Forecast - by Product Type
- 11.1.1. Indoor Monitor
- 11.1.2. Outdoor Monitor
- 11.2. Market Analysis, Insights and Forecast - by Sampling Method
- 11.2.1. Continuous
- 11.2.2. Manual
- 11.2.3. Intermittent
- 11.3. Market Analysis, Insights and Forecast - by End User
- 11.3.1. Residential and Commercial
- 11.3.2. Power Generation
- 11.3.3. Petrochemicals
- 11.3.4. Other End Users
- 11.1. Market Analysis, Insights and Forecast - by Product Type
- 12. Competitive Analysis
- 12.1. Company Profiles
- 12.1.1 Honeywell International Inc
- 12.1.1.1. Company Overview
- 12.1.1.2. Products
- 12.1.1.3. Company Financials
- 12.1.1.4. SWOT Analysis
- 12.1.2 MicroJet Technology Co Ltd
- 12.1.2.1. Company Overview
- 12.1.2.2. Products
- 12.1.2.3. Company Financials
- 12.1.2.4. SWOT Analysis
- 12.1.3 Horiba Ltd
- 12.1.3.1. Company Overview
- 12.1.3.2. Products
- 12.1.3.3. Company Financials
- 12.1.3.4. SWOT Analysis
- 12.1.4 Merck KGaA
- 12.1.4.1. Company Overview
- 12.1.4.2. Products
- 12.1.4.3. Company Financials
- 12.1.4.4. SWOT Analysis
- 12.1.5 TSI Inc
- 12.1.5.1. Company Overview
- 12.1.5.2. Products
- 12.1.5.3. Company Financials
- 12.1.5.4. SWOT Analysis
- 12.1.6 Thermo Fisher Scientific Inc
- 12.1.6.1. Company Overview
- 12.1.6.2. Products
- 12.1.6.3. Company Financials
- 12.1.6.4. SWOT Analysis
- 12.1.7 Hawa Dawa GmbH
- 12.1.7.1. Company Overview
- 12.1.7.2. Products
- 12.1.7.3. Company Financials
- 12.1.7.4. SWOT Analysis
- 12.1.8 Emerson Electric Co
- 12.1.8.1. Company Overview
- 12.1.8.2. Products
- 12.1.8.3. Company Financials
- 12.1.8.4. SWOT Analysis
- 12.1.9 Siemens AG
- 12.1.9.1. Company Overview
- 12.1.9.2. Products
- 12.1.9.3. Company Financials
- 12.1.9.4. SWOT Analysis
- 12.1.10 Agilent Technologies Inc
- 12.1.10.1. Company Overview
- 12.1.10.2. Products
- 12.1.10.3. Company Financials
- 12.1.10.4. SWOT Analysis
- 12.1.11 3M Co
- 12.1.11.1. Company Overview
- 12.1.11.2. Products
- 12.1.11.3. Company Financials
- 12.1.11.4. SWOT Analysis
- 12.1.12 Teledyne Technologies Inc
- 12.1.12.1. Company Overview
- 12.1.12.2. Products
- 12.1.12.3. Company Financials
- 12.1.12.4. SWOT Analysis
- 12.1.1 Honeywell International Inc
- 12.2. Market Entropy
- 12.2.1 Company's Key Areas Served
- 12.2.2 Recent Developments
- 12.3. Company Market Share Analysis 2025
- 12.3.1 Top 5 Companies Market Share Analysis
- 12.3.2 Top 3 Companies Market Share Analysis
- 12.4. List of Potential Customers
- 13. Research Methodology
List of Figures
- Figure 1: Global Air Quality Monitoring Device Market Revenue Breakdown (Million, %) by Region 2025 & 2033
- Figure 2: Global Air Quality Monitoring Device Market Volume Breakdown (K Units, %) by Region 2025 & 2033
- Figure 3: North America Air Quality Monitoring Device Market Revenue (Million), by Product Type 2025 & 2033
- Figure 4: North America Air Quality Monitoring Device Market Volume (K Units), by Product Type 2025 & 2033
- Figure 5: North America Air Quality Monitoring Device Market Revenue Share (%), by Product Type 2025 & 2033
- Figure 6: North America Air Quality Monitoring Device Market Volume Share (%), by Product Type 2025 & 2033
- Figure 7: North America Air Quality Monitoring Device Market Revenue (Million), by Sampling Method 2025 & 2033
- Figure 8: North America Air Quality Monitoring Device Market Volume (K Units), by Sampling Method 2025 & 2033
- Figure 9: North America Air Quality Monitoring Device Market Revenue Share (%), by Sampling Method 2025 & 2033
- Figure 10: North America Air Quality Monitoring Device Market Volume Share (%), by Sampling Method 2025 & 2033
- Figure 11: North America Air Quality Monitoring Device Market Revenue (Million), by End User 2025 & 2033
- Figure 12: North America Air Quality Monitoring Device Market Volume (K Units), by End User 2025 & 2033
- Figure 13: North America Air Quality Monitoring Device Market Revenue Share (%), by End User 2025 & 2033
- Figure 14: North America Air Quality Monitoring Device Market Volume Share (%), by End User 2025 & 2033
- Figure 15: North America Air Quality Monitoring Device Market Revenue (Million), by Country 2025 & 2033
- Figure 16: North America Air Quality Monitoring Device Market Volume (K Units), by Country 2025 & 2033
- Figure 17: North America Air Quality Monitoring Device Market Revenue Share (%), by Country 2025 & 2033
- Figure 18: North America Air Quality Monitoring Device Market Volume Share (%), by Country 2025 & 2033
- Figure 19: Europe Air Quality Monitoring Device Market Revenue (Million), by Product Type 2025 & 2033
- Figure 20: Europe Air Quality Monitoring Device Market Volume (K Units), by Product Type 2025 & 2033
- Figure 21: Europe Air Quality Monitoring Device Market Revenue Share (%), by Product Type 2025 & 2033
- Figure 22: Europe Air Quality Monitoring Device Market Volume Share (%), by Product Type 2025 & 2033
- Figure 23: Europe Air Quality Monitoring Device Market Revenue (Million), by Sampling Method 2025 & 2033
- Figure 24: Europe Air Quality Monitoring Device Market Volume (K Units), by Sampling Method 2025 & 2033
- Figure 25: Europe Air Quality Monitoring Device Market Revenue Share (%), by Sampling Method 2025 & 2033
- Figure 26: Europe Air Quality Monitoring Device Market Volume Share (%), by Sampling Method 2025 & 2033
- Figure 27: Europe Air Quality Monitoring Device Market Revenue (Million), by End User 2025 & 2033
- Figure 28: Europe Air Quality Monitoring Device Market Volume (K Units), by End User 2025 & 2033
- Figure 29: Europe Air Quality Monitoring Device Market Revenue Share (%), by End User 2025 & 2033
- Figure 30: Europe Air Quality Monitoring Device Market Volume Share (%), by End User 2025 & 2033
- Figure 31: Europe Air Quality Monitoring Device Market Revenue (Million), by Country 2025 & 2033
- Figure 32: Europe Air Quality Monitoring Device Market Volume (K Units), by Country 2025 & 2033
- Figure 33: Europe Air Quality Monitoring Device Market Revenue Share (%), by Country 2025 & 2033
- Figure 34: Europe Air Quality Monitoring Device Market Volume Share (%), by Country 2025 & 2033
- Figure 35: Asia Air Quality Monitoring Device Market Revenue (Million), by Product Type 2025 & 2033
- Figure 36: Asia Air Quality Monitoring Device Market Volume (K Units), by Product Type 2025 & 2033
- Figure 37: Asia Air Quality Monitoring Device Market Revenue Share (%), by Product Type 2025 & 2033
- Figure 38: Asia Air Quality Monitoring Device Market Volume Share (%), by Product Type 2025 & 2033
- Figure 39: Asia Air Quality Monitoring Device Market Revenue (Million), by Sampling Method 2025 & 2033
- Figure 40: Asia Air Quality Monitoring Device Market Volume (K Units), by Sampling Method 2025 & 2033
- Figure 41: Asia Air Quality Monitoring Device Market Revenue Share (%), by Sampling Method 2025 & 2033
- Figure 42: Asia Air Quality Monitoring Device Market Volume Share (%), by Sampling Method 2025 & 2033
- Figure 43: Asia Air Quality Monitoring Device Market Revenue (Million), by End User 2025 & 2033
- Figure 44: Asia Air Quality Monitoring Device Market Volume (K Units), by End User 2025 & 2033
- Figure 45: Asia Air Quality Monitoring Device Market Revenue Share (%), by End User 2025 & 2033
- Figure 46: Asia Air Quality Monitoring Device Market Volume Share (%), by End User 2025 & 2033
- Figure 47: Asia Air Quality Monitoring Device Market Revenue (Million), by Country 2025 & 2033
- Figure 48: Asia Air Quality Monitoring Device Market Volume (K Units), by Country 2025 & 2033
- Figure 49: Asia Air Quality Monitoring Device Market Revenue Share (%), by Country 2025 & 2033
- Figure 50: Asia Air Quality Monitoring Device Market Volume Share (%), by Country 2025 & 2033
- Figure 51: South America Air Quality Monitoring Device Market Revenue (Million), by Product Type 2025 & 2033
- Figure 52: South America Air Quality Monitoring Device Market Volume (K Units), by Product Type 2025 & 2033
- Figure 53: South America Air Quality Monitoring Device Market Revenue Share (%), by Product Type 2025 & 2033
- Figure 54: South America Air Quality Monitoring Device Market Volume Share (%), by Product Type 2025 & 2033
- Figure 55: South America Air Quality Monitoring Device Market Revenue (Million), by Sampling Method 2025 & 2033
- Figure 56: South America Air Quality Monitoring Device Market Volume (K Units), by Sampling Method 2025 & 2033
- Figure 57: South America Air Quality Monitoring Device Market Revenue Share (%), by Sampling Method 2025 & 2033
- Figure 58: South America Air Quality Monitoring Device Market Volume Share (%), by Sampling Method 2025 & 2033
- Figure 59: South America Air Quality Monitoring Device Market Revenue (Million), by End User 2025 & 2033
- Figure 60: South America Air Quality Monitoring Device Market Volume (K Units), by End User 2025 & 2033
- Figure 61: South America Air Quality Monitoring Device Market Revenue Share (%), by End User 2025 & 2033
- Figure 62: South America Air Quality Monitoring Device Market Volume Share (%), by End User 2025 & 2033
- Figure 63: South America Air Quality Monitoring Device Market Revenue (Million), by Country 2025 & 2033
- Figure 64: South America Air Quality Monitoring Device Market Volume (K Units), by Country 2025 & 2033
- Figure 65: South America Air Quality Monitoring Device Market Revenue Share (%), by Country 2025 & 2033
- Figure 66: South America Air Quality Monitoring Device Market Volume Share (%), by Country 2025 & 2033
- Figure 67: Middle East and Africa Air Quality Monitoring Device Market Revenue (Million), by Product Type 2025 & 2033
- Figure 68: Middle East and Africa Air Quality Monitoring Device Market Volume (K Units), by Product Type 2025 & 2033
- Figure 69: Middle East and Africa Air Quality Monitoring Device Market Revenue Share (%), by Product Type 2025 & 2033
- Figure 70: Middle East and Africa Air Quality Monitoring Device Market Volume Share (%), by Product Type 2025 & 2033
- Figure 71: Middle East and Africa Air Quality Monitoring Device Market Revenue (Million), by Sampling Method 2025 & 2033
- Figure 72: Middle East and Africa Air Quality Monitoring Device Market Volume (K Units), by Sampling Method 2025 & 2033
- Figure 73: Middle East and Africa Air Quality Monitoring Device Market Revenue Share (%), by Sampling Method 2025 & 2033
- Figure 74: Middle East and Africa Air Quality Monitoring Device Market Volume Share (%), by Sampling Method 2025 & 2033
- Figure 75: Middle East and Africa Air Quality Monitoring Device Market Revenue (Million), by End User 2025 & 2033
- Figure 76: Middle East and Africa Air Quality Monitoring Device Market Volume (K Units), by End User 2025 & 2033
- Figure 77: Middle East and Africa Air Quality Monitoring Device Market Revenue Share (%), by End User 2025 & 2033
- Figure 78: Middle East and Africa Air Quality Monitoring Device Market Volume Share (%), by End User 2025 & 2033
- Figure 79: Middle East and Africa Air Quality Monitoring Device Market Revenue (Million), by Country 2025 & 2033
- Figure 80: Middle East and Africa Air Quality Monitoring Device Market Volume (K Units), by Country 2025 & 2033
- Figure 81: Middle East and Africa Air Quality Monitoring Device Market Revenue Share (%), by Country 2025 & 2033
- Figure 82: Middle East and Africa Air Quality Monitoring Device Market Volume Share (%), by Country 2025 & 2033
List of Tables
- Table 1: Global Air Quality Monitoring Device Market Revenue Million Forecast, by Product Type 2020 & 2033
- Table 2: Global Air Quality Monitoring Device Market Volume K Units Forecast, by Product Type 2020 & 2033
- Table 3: Global Air Quality Monitoring Device Market Revenue Million Forecast, by Sampling Method 2020 & 2033
- Table 4: Global Air Quality Monitoring Device Market Volume K Units Forecast, by Sampling Method 2020 & 2033
- Table 5: Global Air Quality Monitoring Device Market Revenue Million Forecast, by End User 2020 & 2033
- Table 6: Global Air Quality Monitoring Device Market Volume K Units Forecast, by End User 2020 & 2033
- Table 7: Global Air Quality Monitoring Device Market Revenue Million Forecast, by Region 2020 & 2033
- Table 8: Global Air Quality Monitoring Device Market Volume K Units Forecast, by Region 2020 & 2033
- Table 9: Global Air Quality Monitoring Device Market Revenue Million Forecast, by Product Type 2020 & 2033
- Table 10: Global Air Quality Monitoring Device Market Volume K Units Forecast, by Product Type 2020 & 2033
- Table 11: Global Air Quality Monitoring Device Market Revenue Million Forecast, by Sampling Method 2020 & 2033
- Table 12: Global Air Quality Monitoring Device Market Volume K Units Forecast, by Sampling Method 2020 & 2033
- Table 13: Global Air Quality Monitoring Device Market Revenue Million Forecast, by End User 2020 & 2033
- Table 14: Global Air Quality Monitoring Device Market Volume K Units Forecast, by End User 2020 & 2033
- Table 15: Global Air Quality Monitoring Device Market Revenue Million Forecast, by Country 2020 & 2033
- Table 16: Global Air Quality Monitoring Device Market Volume K Units Forecast, by Country 2020 & 2033
- Table 17: United States Air Quality Monitoring Device Market Revenue (Million) Forecast, by Application 2020 & 2033
- Table 18: United States Air Quality Monitoring Device Market Volume (K Units) Forecast, by Application 2020 & 2033
- Table 19: Canada Air Quality Monitoring Device Market Revenue (Million) Forecast, by Application 2020 & 2033
- Table 20: Canada Air Quality Monitoring Device Market Volume (K Units) Forecast, by Application 2020 & 2033
- Table 21: Rest of the North America Air Quality Monitoring Device Market Revenue (Million) Forecast, by Application 2020 & 2033
- Table 22: Rest of the North America Air Quality Monitoring Device Market Volume (K Units) Forecast, by Application 2020 & 2033
- Table 23: Global Air Quality Monitoring Device Market Revenue Million Forecast, by Product Type 2020 & 2033
- Table 24: Global Air Quality Monitoring Device Market Volume K Units Forecast, by Product Type 2020 & 2033
- Table 25: Global Air Quality Monitoring Device Market Revenue Million Forecast, by Sampling Method 2020 & 2033
- Table 26: Global Air Quality Monitoring Device Market Volume K Units Forecast, by Sampling Method 2020 & 2033
- Table 27: Global Air Quality Monitoring Device Market Revenue Million Forecast, by End User 2020 & 2033
- Table 28: Global Air Quality Monitoring Device Market Volume K Units Forecast, by End User 2020 & 2033
- Table 29: Global Air Quality Monitoring Device Market Revenue Million Forecast, by Country 2020 & 2033
- Table 30: Global Air Quality Monitoring Device Market Volume K Units Forecast, by Country 2020 & 2033
- Table 31: United Kingdom Air Quality Monitoring Device Market Revenue (Million) Forecast, by Application 2020 & 2033
- Table 32: United Kingdom Air Quality Monitoring Device Market Volume (K Units) Forecast, by Application 2020 & 2033
- Table 33: Spain Air Quality Monitoring Device Market Revenue (Million) Forecast, by Application 2020 & 2033
- Table 34: Spain Air Quality Monitoring Device Market Volume (K Units) Forecast, by Application 2020 & 2033
- Table 35: Germany Air Quality Monitoring Device Market Revenue (Million) Forecast, by Application 2020 & 2033
- Table 36: Germany Air Quality Monitoring Device Market Volume (K Units) Forecast, by Application 2020 & 2033
- Table 37: Italy Air Quality Monitoring Device Market Revenue (Million) Forecast, by Application 2020 & 2033
- Table 38: Italy Air Quality Monitoring Device Market Volume (K Units) Forecast, by Application 2020 & 2033
- Table 39: Global Air Quality Monitoring Device Market Revenue Million Forecast, by Product Type 2020 & 2033
- Table 40: Global Air Quality Monitoring Device Market Volume K Units Forecast, by Product Type 2020 & 2033
- Table 41: Global Air Quality Monitoring Device Market Revenue Million Forecast, by Sampling Method 2020 & 2033
- Table 42: Global Air Quality Monitoring Device Market Volume K Units Forecast, by Sampling Method 2020 & 2033
- Table 43: Global Air Quality Monitoring Device Market Revenue Million Forecast, by End User 2020 & 2033
- Table 44: Global Air Quality Monitoring Device Market Volume K Units Forecast, by End User 2020 & 2033
- Table 45: Global Air Quality Monitoring Device Market Revenue Million Forecast, by Country 2020 & 2033
- Table 46: Global Air Quality Monitoring Device Market Volume K Units Forecast, by Country 2020 & 2033
- Table 47: China Air Quality Monitoring Device Market Revenue (Million) Forecast, by Application 2020 & 2033
- Table 48: China Air Quality Monitoring Device Market Volume (K Units) Forecast, by Application 2020 & 2033
- Table 49: Japan Air Quality Monitoring Device Market Revenue (Million) Forecast, by Application 2020 & 2033
- Table 50: Japan Air Quality Monitoring Device Market Volume (K Units) Forecast, by Application 2020 & 2033
- Table 51: Vietnam Air Quality Monitoring Device Market Revenue (Million) Forecast, by Application 2020 & 2033
- Table 52: Vietnam Air Quality Monitoring Device Market Volume (K Units) Forecast, by Application 2020 & 2033
- Table 53: India Air Quality Monitoring Device Market Revenue (Million) Forecast, by Application 2020 & 2033
- Table 54: India Air Quality Monitoring Device Market Volume (K Units) Forecast, by Application 2020 & 2033
- Table 55: Australia and New Zealand Air Quality Monitoring Device Market Revenue (Million) Forecast, by Application 2020 & 2033
- Table 56: Australia and New Zealand Air Quality Monitoring Device Market Volume (K Units) Forecast, by Application 2020 & 2033
- Table 57: Global Air Quality Monitoring Device Market Revenue Million Forecast, by Product Type 2020 & 2033
- Table 58: Global Air Quality Monitoring Device Market Volume K Units Forecast, by Product Type 2020 & 2033
- Table 59: Global Air Quality Monitoring Device Market Revenue Million Forecast, by Sampling Method 2020 & 2033
- Table 60: Global Air Quality Monitoring Device Market Volume K Units Forecast, by Sampling Method 2020 & 2033
- Table 61: Global Air Quality Monitoring Device Market Revenue Million Forecast, by End User 2020 & 2033
- Table 62: Global Air Quality Monitoring Device Market Volume K Units Forecast, by End User 2020 & 2033
- Table 63: Global Air Quality Monitoring Device Market Revenue Million Forecast, by Country 2020 & 2033
- Table 64: Global Air Quality Monitoring Device Market Volume K Units Forecast, by Country 2020 & 2033
- Table 65: Brazil Air Quality Monitoring Device Market Revenue (Million) Forecast, by Application 2020 & 2033
- Table 66: Brazil Air Quality Monitoring Device Market Volume (K Units) Forecast, by Application 2020 & 2033
- Table 67: Argentina Air Quality Monitoring Device Market Revenue (Million) Forecast, by Application 2020 & 2033
- Table 68: Argentina Air Quality Monitoring Device Market Volume (K Units) Forecast, by Application 2020 & 2033
- Table 69: Global Air Quality Monitoring Device Market Revenue Million Forecast, by Product Type 2020 & 2033
- Table 70: Global Air Quality Monitoring Device Market Volume K Units Forecast, by Product Type 2020 & 2033
- Table 71: Global Air Quality Monitoring Device Market Revenue Million Forecast, by Sampling Method 2020 & 2033
- Table 72: Global Air Quality Monitoring Device Market Volume K Units Forecast, by Sampling Method 2020 & 2033
- Table 73: Global Air Quality Monitoring Device Market Revenue Million Forecast, by End User 2020 & 2033
- Table 74: Global Air Quality Monitoring Device Market Volume K Units Forecast, by End User 2020 & 2033
- Table 75: Global Air Quality Monitoring Device Market Revenue Million Forecast, by Country 2020 & 2033
- Table 76: Global Air Quality Monitoring Device Market Volume K Units Forecast, by Country 2020 & 2033
- Table 77: United Arab Emirates Air Quality Monitoring Device Market Revenue (Million) Forecast, by Application 2020 & 2033
- Table 78: United Arab Emirates Air Quality Monitoring Device Market Volume (K Units) Forecast, by Application 2020 & 2033
- Table 79: South Africa Air Quality Monitoring Device Market Revenue (Million) Forecast, by Application 2020 & 2033
- Table 80: South Africa Air Quality Monitoring Device Market Volume (K Units) Forecast, by Application 2020 & 2033
- Table 81: Saudi Arabia Air Quality Monitoring Device Market Revenue (Million) Forecast, by Application 2020 & 2033
- Table 82: Saudi Arabia Air Quality Monitoring Device Market Volume (K Units) Forecast, by Application 2020 & 2033
- Table 83: Iraq Air Quality Monitoring Device Market Revenue (Million) Forecast, by Application 2020 & 2033
- Table 84: Iraq Air Quality Monitoring Device Market Volume (K Units) Forecast, by Application 2020 & 2033
Frequently Asked Questions
1. What is the projected Compound Annual Growth Rate (CAGR) of the Air Quality Monitoring Device Market?
The projected CAGR is approximately 5.79%.
2. Which companies are prominent players in the Air Quality Monitoring Device Market?
Key companies in the market include Honeywell International Inc, MicroJet Technology Co Ltd, Horiba Ltd, Merck KGaA, TSI Inc, Thermo Fisher Scientific Inc, Hawa Dawa GmbH, Emerson Electric Co, Siemens AG, Agilent Technologies Inc, 3M Co, Teledyne Technologies Inc.
3. What are the main segments of the Air Quality Monitoring Device Market?
The market segments include Product Type, Sampling Method, End User.
4. Can you provide details about the market size?
The market size is estimated to be USD 5.08 Million as of 2022.
5. What are some drivers contributing to market growth?
4.; Supportive Government Policies to Regulate Air Pollution4.; Expansion of Industrialization Across the World.
6. What are the notable trends driving market growth?
The Outdoor Monitor Segment is Expected to be the Fastest-growing Segment.
7. Are there any restraints impacting market growth?
4.; The Penetration of Cleaner Energy Sources Like Renewables and Nuclear Power.
8. Can you provide examples of recent developments in the market?
In March 2023, Tyndall participated in a new European project aiming to improve air quality monitoring. It is a group member that has received EC (European Commission) funds to research air quality monitoring. The Tyndall National Institute for Research and Development in Microtechnologies (IMT) in Bucharest will lead the initiative, which will benefit from the experience of research institutions in Ireland and Italy.
9. What pricing options are available for accessing the report?
Pricing options include single-user, multi-user, and enterprise licenses priced at USD 4750, USD 5250, and USD 8750 respectively.
10. Is the market size provided in terms of value or volume?
The market size is provided in terms of value, measured in Million and volume, measured in K Units.
11. Are there any specific market keywords associated with the report?
Yes, the market keyword associated with the report is "Air Quality Monitoring Device Market," which aids in identifying and referencing the specific market segment covered.
12. How do I determine which pricing option suits my needs best?
The pricing options vary based on user requirements and access needs. Individual users may opt for single-user licenses, while businesses requiring broader access may choose multi-user or enterprise licenses for cost-effective access to the report.
13. Are there any additional resources or data provided in the Air Quality Monitoring Device Market report?
While the report offers comprehensive insights, it's advisable to review the specific contents or supplementary materials provided to ascertain if additional resources or data are available.
14. How can I stay updated on further developments or reports in the Air Quality Monitoring Device Market?
To stay informed about further developments, trends, and reports in the Air Quality Monitoring Device Market, consider subscribing to industry newsletters, following relevant companies and organizations, or regularly checking reputable industry news sources and publications.
Methodology
Step 1 - Identification of Relevant Samples Size from Population Database


Step 2 - Approaches for Defining Global Market Size (Value, Volume* & Price*)

Note*: In applicable scenarios
Step 3 - Data Sources
Primary Research
- Web Analytics
- Survey Reports
- Research Institute
- Latest Research Reports
- Opinion Leaders
Secondary Research
- Annual Reports
- White Paper
- Latest Press Release
- Industry Association
- Paid Database
- Investor Presentations

Step 4 - Data Triangulation
Involves using different sources of information in order to increase the validity of a study
These sources are likely to be stakeholders in a program - participants, other researchers, program staff, other community members, and so on.
Then we put all data in single framework & apply various statistical tools to find out the dynamic on the market.
During the analysis stage, feedback from the stakeholder groups would be compared to determine areas of agreement as well as areas of divergence