

Key Insights
The global aluminum market, valued at approximately $52.4 billion in 2025, is forecast to achieve a compound annual growth rate (CAGR) of 6% between 2025 and 2033. This significant expansion is driven by increasing demand in key sectors. The automotive industry's adoption of lightweight materials for enhanced fuel efficiency, coupled with the aerospace and defense sectors' need for high strength-to-weight ratios, are primary growth catalysts. The construction industry leverages aluminum's durability and corrosion resistance for applications like facades and roofing. Furthermore, the electrical and electronics sector benefits from the growth in smart technologies and renewable energy infrastructure. While raw material price volatility and environmental considerations present challenges, advancements in recycling and sustainable manufacturing are addressing these concerns. The Asia-Pacific region, led by China and India, dominates due to its robust manufacturing and infrastructure development. North America and Europe contribute significantly, driven by advanced end-user industries and technology adoption. These diverse applications underscore the sustained growth potential of the aluminum industry.
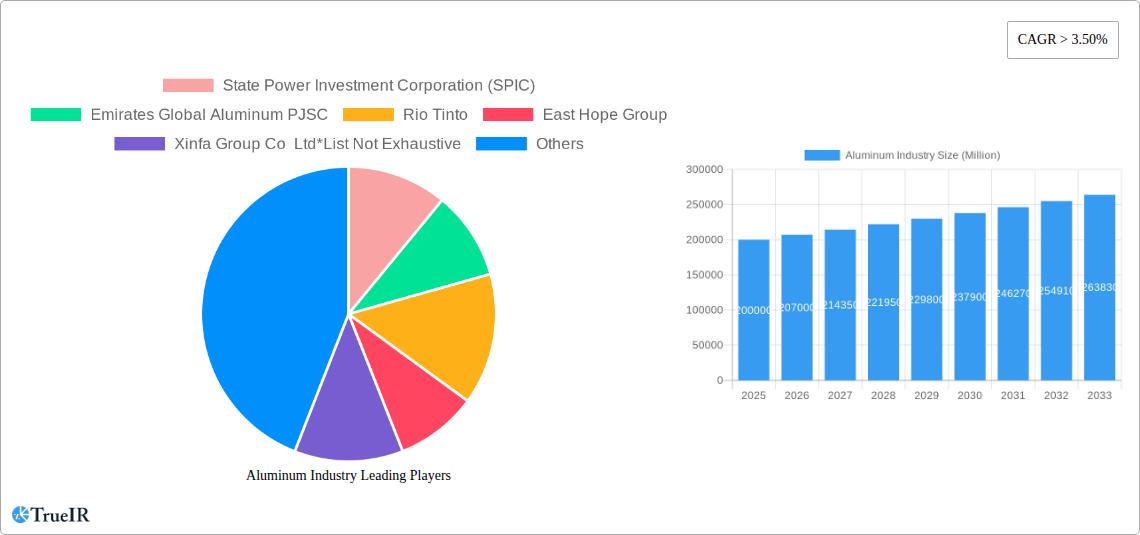
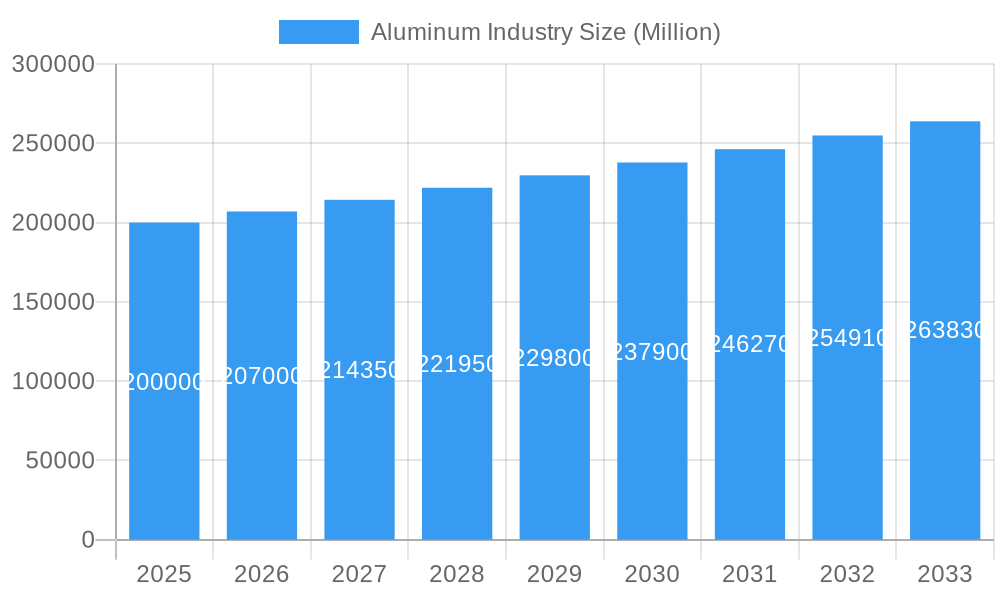
Aluminum Industry Market Size (In Billion)
Market segmentation highlights key growth drivers. Castings, extrusions, and forgings are critical processing types, each meeting distinct industrial requirements. Flat-rolled products serve broad applications in construction and packaging. Pigments and powders are integral to specialized coatings and materials science. The automotive sector's ongoing preference for aluminum alloys, alongside consistent demand from aerospace and defense, will continue to influence market dynamics. The construction segment remains a vital growth driver, influenced by sustainable building practices and energy efficiency. Major global players, including State Power Investment Corporation, Emirates Global Aluminum, and Rio Tinto, alongside emerging regional producers, shape a competitive and dynamic industry landscape, fostering innovation and price stability.
Aluminum Industry Company Market Share
Aluminum Industry Market Report: 2019-2033
This comprehensive report provides a detailed analysis of the global aluminum industry, covering market dynamics, competitive landscape, key players, and future growth prospects. With a study period spanning 2019-2033, a base year of 2025, and a forecast period from 2025-2033, this report is an invaluable resource for industry stakeholders seeking insights into this multi-billion-dollar market. The report leverages extensive data analysis to provide a clear understanding of market trends, segmentation, and future opportunities, making it essential for strategic decision-making.
Aluminum Industry Market Structure & Competitive Landscape
The global aluminum industry is characterized by a moderately concentrated market structure, with several major players controlling a significant portion of global production. The Herfindahl-Hirschman Index (HHI) for the industry is estimated to be xx, indicating a moderately concentrated market. Key players exhibit varying degrees of vertical integration, with some companies involved in bauxite mining, alumina refining, and aluminum smelting, while others focus on downstream processing and fabrication. Innovation in areas such as lightweight alloys, recycled aluminum production, and advanced manufacturing techniques is driving industry growth. Stringent environmental regulations are increasingly impacting production processes, prompting companies to adopt sustainable practices. Product substitution from materials like plastics and composites presents a key challenge, while mergers and acquisitions (M&A) activity reflects ongoing consolidation within the sector. The volume of M&A transactions in the aluminum industry from 2019-2024 reached approximately xx Million USD.
- Market Concentration: Moderately concentrated, with HHI estimated at xx.
- Innovation Drivers: Lightweight alloys, recycled aluminum, advanced manufacturing.
- Regulatory Impacts: Stringent environmental regulations, promoting sustainable practices.
- Product Substitutes: Plastics, composites.
- End-User Segmentation: Automotive, aerospace, building & construction, packaging, electrical & electronics, industrial, and other.
- M&A Trends: Ongoing consolidation, with xx Million USD in transactions from 2019-2024.
Aluminum Industry Market Trends & Opportunities
The global aluminum market is experiencing robust growth, driven by increasing demand from various end-use industries. The market size is projected to reach xx Million USD by 2033, exhibiting a Compound Annual Growth Rate (CAGR) of xx% during the forecast period (2025-2033). This growth is fueled by several factors, including the expanding automotive sector, particularly electric vehicles requiring lightweight materials; the rise of the construction industry in developing economies; and the growing popularity of sustainable packaging solutions. Technological advancements, such as improved recycling technologies and the development of advanced aluminum alloys, are further enhancing the competitiveness and applications of aluminum. Market penetration rates are also increasing in emerging markets, providing significant growth opportunities for producers and manufacturers. Competition is fierce, however, prompting companies to continuously innovate and optimize their production processes to maintain market share.
Dominant Markets & Segments in Aluminum Industry
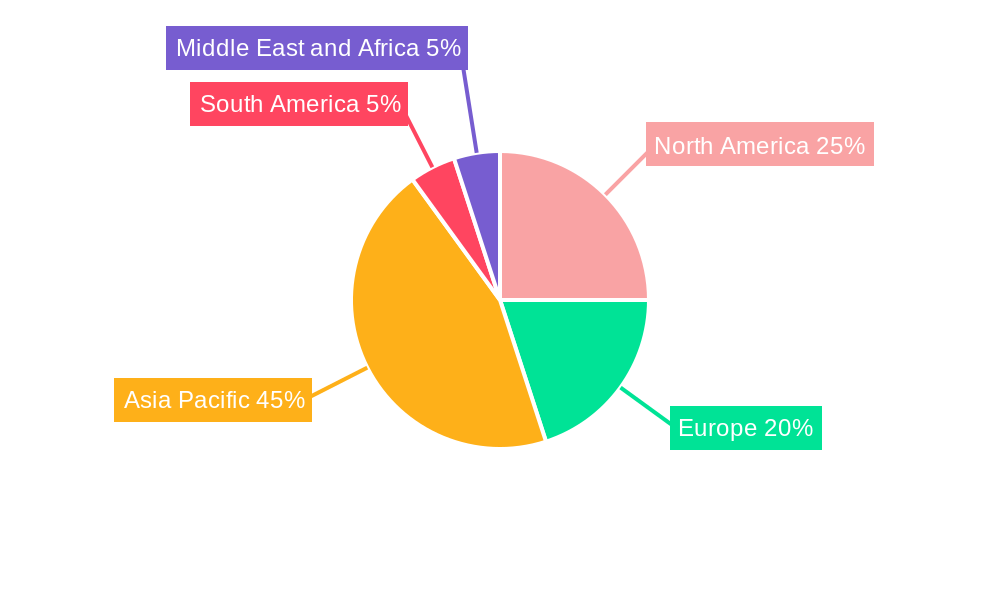
The Asia-Pacific region holds the dominant position in the global aluminum market, driven by robust infrastructure development, increasing industrialization, and expanding automotive and construction sectors. China remains the largest producer and consumer of aluminum globally.
- Leading Regions: Asia-Pacific (China specifically), North America, Europe.
- Leading Segments (Processing Type): Flat rolled products currently holds the largest market share, followed by extrusions and castings. Pigments and powders represent a smaller but growing segment.
- Leading Segments (End-user Industry): Building and construction demonstrates the highest demand, followed by the automotive and packaging sectors.
- Key Growth Drivers: Infrastructure projects, government policies promoting sustainable materials, urbanization, and economic growth in developing economies.
Aluminum Industry Product Analysis
The aluminum industry is witnessing significant product innovations, focusing on improving mechanical properties, corrosion resistance, and reducing weight. Advanced alloys with enhanced strength-to-weight ratios are finding increasing applications in the aerospace and automotive sectors. Recycled aluminum products are gaining traction, driven by environmental concerns and cost efficiency. Technological advancements in manufacturing processes, such as advanced casting and extrusion techniques, are enhancing product quality and reducing production costs. This focus on enhanced performance and sustainability positions aluminum as a competitive material in various sectors.
Key Drivers, Barriers & Challenges in Aluminum Industry
Key Drivers: Rising demand from the automotive and construction sectors, increasing adoption of recycled aluminum, technological advancements, and supportive government policies promoting sustainable materials.
Challenges: Volatility in raw material prices (bauxite and alumina), fluctuating energy costs, environmental regulations, and intense competition from alternative materials (plastics, composites) pose significant challenges. Supply chain disruptions can significantly impact production and delivery schedules.
Growth Drivers in the Aluminum Industry Market
Technological advancements (lightweight alloys, recycling), rising global demand (especially in developing economies), favorable government policies promoting sustainable materials and infrastructure projects, and the increasing adoption of aluminum in various end-use industries like automotive and packaging are major drivers of the aluminum industry's expansion.
Challenges Impacting Aluminum Industry Growth
Environmental regulations, energy price volatility, and competition from substitutes like plastics and composites are major challenges. Supply chain disruptions, geopolitical instability, and fluctuating raw material prices also hinder growth. These factors necessitate strategic adaptation and innovation for sustained industry expansion.
Key Players Shaping the Aluminum Industry Market
Significant Aluminum Industry Industry Milestones
- July 2022: Rio Tinto announces a USD 188 Million investment to expand aluminum billet production in Canada by 202,000 metric tonnes.
- February 2022: Emirates Global Aluminum PJSC (EGA) plans a 150,000-tonne capacity aluminum recycling facility in the UAE.
Future Outlook for Aluminum Industry Market
The aluminum industry is poised for continued growth, driven by the increasing demand for lightweight materials in the automotive and aerospace sectors, the expansion of construction activities globally, and a growing focus on sustainable and recyclable materials. Strategic investments in recycling infrastructure, technological advancements in alloy development, and the exploration of new applications will shape the future of the industry. The market presents considerable opportunities for companies that can innovate, adapt to regulatory changes, and efficiently manage their supply chains.
Aluminum Industry Segmentation
-
1. Processing Type
- 1.1. Castings
- 1.2. Extrusions
- 1.3. Forgings
- 1.4. Flat Rolled Products
- 1.5. Pigments and Powders
-
2. End-user Industry
- 2.1. Automotive
- 2.2. Aerospace and Defense
- 2.3. Building and Construction
- 2.4. Electrical and Electronics
- 2.5. Packaging
- 2.6. Industrial
- 2.7. Other End-user Industries
Aluminum Industry Segmentation By Geography
-
1. Asia Pacific
- 1.1. China
- 1.2. India
- 1.3. Japan
- 1.4. South Korea
- 1.5. Rest of Asia Pacific
-
2. North America
- 2.1. United States
- 2.2. Canada
- 2.3. Mexico
-
3. Europe
- 3.1. Germany
- 3.2. United Kingdom
- 3.3. France
- 3.4. Italy
- 3.5. Rest of Europe
-
4. South America
- 4.1. Brazil
- 4.2. Argentina
- 4.3. Rest of South America
-
5. Middle East and Africa
- 5.1. Saudi Arabia
- 5.2. South Africa
- 5.3. Rest of Middle East and Africa
Aluminum Industry Regional Market Share
Geographic Coverage of Aluminum Industry
Aluminum Industry REPORT HIGHLIGHTS
| Aspects | Details |
|---|---|
| Study Period | 2020-2034 |
| Base Year | 2025 |
| Estimated Year | 2026 |
| Forecast Period | 2026-2034 |
| Historical Period | 2020-2025 |
| Growth Rate | CAGR of 6% from 2020-2034 |
| Segmentation |
|
Table of Contents
- 1. Introduction
- 1.1. Research Scope
- 1.2. Market Segmentation
- 1.3. Research Methodology
- 1.4. Definitions and Assumptions
- 2. Executive Summary
- 2.1. Introduction
- 3. Market Dynamics
- 3.1. Introduction
- 3.2. Market Drivers
- 3.2.1. Increasing Construction Activities in the Asia-Pacific Region; Other Drivers
- 3.3. Market Restrains
- 3.3.1. Strict Regulations and Environmental Concerns Related to Aluminum Processing
- 3.4. Market Trends
- 3.4.1. Increasing Demand from the Building and Construction Industry
- 4. Market Factor Analysis
- 4.1. Porters Five Forces
- 4.2. Supply/Value Chain
- 4.3. PESTEL analysis
- 4.4. Market Entropy
- 4.5. Patent/Trademark Analysis
- 5. Global Aluminum Industry Analysis, Insights and Forecast, 2020-2032
- 5.1. Market Analysis, Insights and Forecast - by Processing Type
- 5.1.1. Castings
- 5.1.2. Extrusions
- 5.1.3. Forgings
- 5.1.4. Flat Rolled Products
- 5.1.5. Pigments and Powders
- 5.2. Market Analysis, Insights and Forecast - by End-user Industry
- 5.2.1. Automotive
- 5.2.2. Aerospace and Defense
- 5.2.3. Building and Construction
- 5.2.4. Electrical and Electronics
- 5.2.5. Packaging
- 5.2.6. Industrial
- 5.2.7. Other End-user Industries
- 5.3. Market Analysis, Insights and Forecast - by Region
- 5.3.1. Asia Pacific
- 5.3.2. North America
- 5.3.3. Europe
- 5.3.4. South America
- 5.3.5. Middle East and Africa
- 5.1. Market Analysis, Insights and Forecast - by Processing Type
- 6. Asia Pacific Aluminum Industry Analysis, Insights and Forecast, 2020-2032
- 6.1. Market Analysis, Insights and Forecast - by Processing Type
- 6.1.1. Castings
- 6.1.2. Extrusions
- 6.1.3. Forgings
- 6.1.4. Flat Rolled Products
- 6.1.5. Pigments and Powders
- 6.2. Market Analysis, Insights and Forecast - by End-user Industry
- 6.2.1. Automotive
- 6.2.2. Aerospace and Defense
- 6.2.3. Building and Construction
- 6.2.4. Electrical and Electronics
- 6.2.5. Packaging
- 6.2.6. Industrial
- 6.2.7. Other End-user Industries
- 6.1. Market Analysis, Insights and Forecast - by Processing Type
- 7. North America Aluminum Industry Analysis, Insights and Forecast, 2020-2032
- 7.1. Market Analysis, Insights and Forecast - by Processing Type
- 7.1.1. Castings
- 7.1.2. Extrusions
- 7.1.3. Forgings
- 7.1.4. Flat Rolled Products
- 7.1.5. Pigments and Powders
- 7.2. Market Analysis, Insights and Forecast - by End-user Industry
- 7.2.1. Automotive
- 7.2.2. Aerospace and Defense
- 7.2.3. Building and Construction
- 7.2.4. Electrical and Electronics
- 7.2.5. Packaging
- 7.2.6. Industrial
- 7.2.7. Other End-user Industries
- 7.1. Market Analysis, Insights and Forecast - by Processing Type
- 8. Europe Aluminum Industry Analysis, Insights and Forecast, 2020-2032
- 8.1. Market Analysis, Insights and Forecast - by Processing Type
- 8.1.1. Castings
- 8.1.2. Extrusions
- 8.1.3. Forgings
- 8.1.4. Flat Rolled Products
- 8.1.5. Pigments and Powders
- 8.2. Market Analysis, Insights and Forecast - by End-user Industry
- 8.2.1. Automotive
- 8.2.2. Aerospace and Defense
- 8.2.3. Building and Construction
- 8.2.4. Electrical and Electronics
- 8.2.5. Packaging
- 8.2.6. Industrial
- 8.2.7. Other End-user Industries
- 8.1. Market Analysis, Insights and Forecast - by Processing Type
- 9. South America Aluminum Industry Analysis, Insights and Forecast, 2020-2032
- 9.1. Market Analysis, Insights and Forecast - by Processing Type
- 9.1.1. Castings
- 9.1.2. Extrusions
- 9.1.3. Forgings
- 9.1.4. Flat Rolled Products
- 9.1.5. Pigments and Powders
- 9.2. Market Analysis, Insights and Forecast - by End-user Industry
- 9.2.1. Automotive
- 9.2.2. Aerospace and Defense
- 9.2.3. Building and Construction
- 9.2.4. Electrical and Electronics
- 9.2.5. Packaging
- 9.2.6. Industrial
- 9.2.7. Other End-user Industries
- 9.1. Market Analysis, Insights and Forecast - by Processing Type
- 10. Middle East and Africa Aluminum Industry Analysis, Insights and Forecast, 2020-2032
- 10.1. Market Analysis, Insights and Forecast - by Processing Type
- 10.1.1. Castings
- 10.1.2. Extrusions
- 10.1.3. Forgings
- 10.1.4. Flat Rolled Products
- 10.1.5. Pigments and Powders
- 10.2. Market Analysis, Insights and Forecast - by End-user Industry
- 10.2.1. Automotive
- 10.2.2. Aerospace and Defense
- 10.2.3. Building and Construction
- 10.2.4. Electrical and Electronics
- 10.2.5. Packaging
- 10.2.6. Industrial
- 10.2.7. Other End-user Industries
- 10.1. Market Analysis, Insights and Forecast - by Processing Type
- 11. Competitive Analysis
- 11.1. Global Market Share Analysis 2025
- 11.2. Company Profiles
- 11.2.1 State Power Investment Corporation (SPIC)
- 11.2.1.1. Overview
- 11.2.1.2. Products
- 11.2.1.3. SWOT Analysis
- 11.2.1.4. Recent Developments
- 11.2.1.5. Financials (Based on Availability)
- 11.2.2 Emirates Global Aluminum PJSC
- 11.2.2.1. Overview
- 11.2.2.2. Products
- 11.2.2.3. SWOT Analysis
- 11.2.2.4. Recent Developments
- 11.2.2.5. Financials (Based on Availability)
- 11.2.3 Rio Tinto
- 11.2.3.1. Overview
- 11.2.3.2. Products
- 11.2.3.3. SWOT Analysis
- 11.2.3.4. Recent Developments
- 11.2.3.5. Financials (Based on Availability)
- 11.2.4 East Hope Group
- 11.2.4.1. Overview
- 11.2.4.2. Products
- 11.2.4.3. SWOT Analysis
- 11.2.4.4. Recent Developments
- 11.2.4.5. Financials (Based on Availability)
- 11.2.5 Xinfa Group Co Ltd*List Not Exhaustive
- 11.2.5.1. Overview
- 11.2.5.2. Products
- 11.2.5.3. SWOT Analysis
- 11.2.5.4. Recent Developments
- 11.2.5.5. Financials (Based on Availability)
- 11.2.6 China Hongqiao Group Limited
- 11.2.6.1. Overview
- 11.2.6.2. Products
- 11.2.6.3. SWOT Analysis
- 11.2.6.4. Recent Developments
- 11.2.6.5. Financials (Based on Availability)
- 11.2.7 Novelis Inc
- 11.2.7.1. Overview
- 11.2.7.2. Products
- 11.2.7.3. SWOT Analysis
- 11.2.7.4. Recent Developments
- 11.2.7.5. Financials (Based on Availability)
- 11.2.8 RusAL
- 11.2.8.1. Overview
- 11.2.8.2. Products
- 11.2.8.3. SWOT Analysis
- 11.2.8.4. Recent Developments
- 11.2.8.5. Financials (Based on Availability)
- 11.2.9 Norsk Hydro ASA
- 11.2.9.1. Overview
- 11.2.9.2. Products
- 11.2.9.3. SWOT Analysis
- 11.2.9.4. Recent Developments
- 11.2.9.5. Financials (Based on Availability)
- 11.2.10 Aluminum Corporation of China Limited (CHINALCO)
- 11.2.10.1. Overview
- 11.2.10.2. Products
- 11.2.10.3. SWOT Analysis
- 11.2.10.4. Recent Developments
- 11.2.10.5. Financials (Based on Availability)
- 11.2.11 Alcoa Corporation
- 11.2.11.1. Overview
- 11.2.11.2. Products
- 11.2.11.3. SWOT Analysis
- 11.2.11.4. Recent Developments
- 11.2.11.5. Financials (Based on Availability)
- 11.2.12 Aluminum Bahrain B S C (Alba)
- 11.2.12.1. Overview
- 11.2.12.2. Products
- 11.2.12.3. SWOT Analysis
- 11.2.12.4. Recent Developments
- 11.2.12.5. Financials (Based on Availability)
- 11.2.1 State Power Investment Corporation (SPIC)
List of Figures
- Figure 1: Global Aluminum Industry Revenue Breakdown (billion, %) by Region 2025 & 2033
- Figure 2: Asia Pacific Aluminum Industry Revenue (billion), by Processing Type 2025 & 2033
- Figure 3: Asia Pacific Aluminum Industry Revenue Share (%), by Processing Type 2025 & 2033
- Figure 4: Asia Pacific Aluminum Industry Revenue (billion), by End-user Industry 2025 & 2033
- Figure 5: Asia Pacific Aluminum Industry Revenue Share (%), by End-user Industry 2025 & 2033
- Figure 6: Asia Pacific Aluminum Industry Revenue (billion), by Country 2025 & 2033
- Figure 7: Asia Pacific Aluminum Industry Revenue Share (%), by Country 2025 & 2033
- Figure 8: North America Aluminum Industry Revenue (billion), by Processing Type 2025 & 2033
- Figure 9: North America Aluminum Industry Revenue Share (%), by Processing Type 2025 & 2033
- Figure 10: North America Aluminum Industry Revenue (billion), by End-user Industry 2025 & 2033
- Figure 11: North America Aluminum Industry Revenue Share (%), by End-user Industry 2025 & 2033
- Figure 12: North America Aluminum Industry Revenue (billion), by Country 2025 & 2033
- Figure 13: North America Aluminum Industry Revenue Share (%), by Country 2025 & 2033
- Figure 14: Europe Aluminum Industry Revenue (billion), by Processing Type 2025 & 2033
- Figure 15: Europe Aluminum Industry Revenue Share (%), by Processing Type 2025 & 2033
- Figure 16: Europe Aluminum Industry Revenue (billion), by End-user Industry 2025 & 2033
- Figure 17: Europe Aluminum Industry Revenue Share (%), by End-user Industry 2025 & 2033
- Figure 18: Europe Aluminum Industry Revenue (billion), by Country 2025 & 2033
- Figure 19: Europe Aluminum Industry Revenue Share (%), by Country 2025 & 2033
- Figure 20: South America Aluminum Industry Revenue (billion), by Processing Type 2025 & 2033
- Figure 21: South America Aluminum Industry Revenue Share (%), by Processing Type 2025 & 2033
- Figure 22: South America Aluminum Industry Revenue (billion), by End-user Industry 2025 & 2033
- Figure 23: South America Aluminum Industry Revenue Share (%), by End-user Industry 2025 & 2033
- Figure 24: South America Aluminum Industry Revenue (billion), by Country 2025 & 2033
- Figure 25: South America Aluminum Industry Revenue Share (%), by Country 2025 & 2033
- Figure 26: Middle East and Africa Aluminum Industry Revenue (billion), by Processing Type 2025 & 2033
- Figure 27: Middle East and Africa Aluminum Industry Revenue Share (%), by Processing Type 2025 & 2033
- Figure 28: Middle East and Africa Aluminum Industry Revenue (billion), by End-user Industry 2025 & 2033
- Figure 29: Middle East and Africa Aluminum Industry Revenue Share (%), by End-user Industry 2025 & 2033
- Figure 30: Middle East and Africa Aluminum Industry Revenue (billion), by Country 2025 & 2033
- Figure 31: Middle East and Africa Aluminum Industry Revenue Share (%), by Country 2025 & 2033
List of Tables
- Table 1: Global Aluminum Industry Revenue billion Forecast, by Processing Type 2020 & 2033
- Table 2: Global Aluminum Industry Revenue billion Forecast, by End-user Industry 2020 & 2033
- Table 3: Global Aluminum Industry Revenue billion Forecast, by Region 2020 & 2033
- Table 4: Global Aluminum Industry Revenue billion Forecast, by Processing Type 2020 & 2033
- Table 5: Global Aluminum Industry Revenue billion Forecast, by End-user Industry 2020 & 2033
- Table 6: Global Aluminum Industry Revenue billion Forecast, by Country 2020 & 2033
- Table 7: China Aluminum Industry Revenue (billion) Forecast, by Application 2020 & 2033
- Table 8: India Aluminum Industry Revenue (billion) Forecast, by Application 2020 & 2033
- Table 9: Japan Aluminum Industry Revenue (billion) Forecast, by Application 2020 & 2033
- Table 10: South Korea Aluminum Industry Revenue (billion) Forecast, by Application 2020 & 2033
- Table 11: Rest of Asia Pacific Aluminum Industry Revenue (billion) Forecast, by Application 2020 & 2033
- Table 12: Global Aluminum Industry Revenue billion Forecast, by Processing Type 2020 & 2033
- Table 13: Global Aluminum Industry Revenue billion Forecast, by End-user Industry 2020 & 2033
- Table 14: Global Aluminum Industry Revenue billion Forecast, by Country 2020 & 2033
- Table 15: United States Aluminum Industry Revenue (billion) Forecast, by Application 2020 & 2033
- Table 16: Canada Aluminum Industry Revenue (billion) Forecast, by Application 2020 & 2033
- Table 17: Mexico Aluminum Industry Revenue (billion) Forecast, by Application 2020 & 2033
- Table 18: Global Aluminum Industry Revenue billion Forecast, by Processing Type 2020 & 2033
- Table 19: Global Aluminum Industry Revenue billion Forecast, by End-user Industry 2020 & 2033
- Table 20: Global Aluminum Industry Revenue billion Forecast, by Country 2020 & 2033
- Table 21: Germany Aluminum Industry Revenue (billion) Forecast, by Application 2020 & 2033
- Table 22: United Kingdom Aluminum Industry Revenue (billion) Forecast, by Application 2020 & 2033
- Table 23: France Aluminum Industry Revenue (billion) Forecast, by Application 2020 & 2033
- Table 24: Italy Aluminum Industry Revenue (billion) Forecast, by Application 2020 & 2033
- Table 25: Rest of Europe Aluminum Industry Revenue (billion) Forecast, by Application 2020 & 2033
- Table 26: Global Aluminum Industry Revenue billion Forecast, by Processing Type 2020 & 2033
- Table 27: Global Aluminum Industry Revenue billion Forecast, by End-user Industry 2020 & 2033
- Table 28: Global Aluminum Industry Revenue billion Forecast, by Country 2020 & 2033
- Table 29: Brazil Aluminum Industry Revenue (billion) Forecast, by Application 2020 & 2033
- Table 30: Argentina Aluminum Industry Revenue (billion) Forecast, by Application 2020 & 2033
- Table 31: Rest of South America Aluminum Industry Revenue (billion) Forecast, by Application 2020 & 2033
- Table 32: Global Aluminum Industry Revenue billion Forecast, by Processing Type 2020 & 2033
- Table 33: Global Aluminum Industry Revenue billion Forecast, by End-user Industry 2020 & 2033
- Table 34: Global Aluminum Industry Revenue billion Forecast, by Country 2020 & 2033
- Table 35: Saudi Arabia Aluminum Industry Revenue (billion) Forecast, by Application 2020 & 2033
- Table 36: South Africa Aluminum Industry Revenue (billion) Forecast, by Application 2020 & 2033
- Table 37: Rest of Middle East and Africa Aluminum Industry Revenue (billion) Forecast, by Application 2020 & 2033
Frequently Asked Questions
1. What is the projected Compound Annual Growth Rate (CAGR) of the Aluminum Industry?
The projected CAGR is approximately 6%.
2. Which companies are prominent players in the Aluminum Industry?
Key companies in the market include State Power Investment Corporation (SPIC), Emirates Global Aluminum PJSC, Rio Tinto, East Hope Group, Xinfa Group Co Ltd*List Not Exhaustive, China Hongqiao Group Limited, Novelis Inc, RusAL, Norsk Hydro ASA, Aluminum Corporation of China Limited (CHINALCO), Alcoa Corporation, Aluminum Bahrain B S C (Alba).
3. What are the main segments of the Aluminum Industry?
The market segments include Processing Type, End-user Industry.
4. Can you provide details about the market size?
The market size is estimated to be USD 52.4 billion as of 2022.
5. What are some drivers contributing to market growth?
Increasing Construction Activities in the Asia-Pacific Region; Other Drivers.
6. What are the notable trends driving market growth?
Increasing Demand from the Building and Construction Industry.
7. Are there any restraints impacting market growth?
Strict Regulations and Environmental Concerns Related to Aluminum Processing.
8. Can you provide examples of recent developments in the market?
July 2022: Rio Tinto unveils a USD 188 million aluminum investment plan in Canada. The company is planning to grow aluminum billets production by 202,000 metric tonnes. The firm will expand the capacity of the existing casting center at its Alma plant.
9. What pricing options are available for accessing the report?
Pricing options include single-user, multi-user, and enterprise licenses priced at USD 4750, USD 5250, and USD 8750 respectively.
10. Is the market size provided in terms of value or volume?
The market size is provided in terms of value, measured in billion.
11. Are there any specific market keywords associated with the report?
Yes, the market keyword associated with the report is "Aluminum Industry," which aids in identifying and referencing the specific market segment covered.
12. How do I determine which pricing option suits my needs best?
The pricing options vary based on user requirements and access needs. Individual users may opt for single-user licenses, while businesses requiring broader access may choose multi-user or enterprise licenses for cost-effective access to the report.
13. Are there any additional resources or data provided in the Aluminum Industry report?
While the report offers comprehensive insights, it's advisable to review the specific contents or supplementary materials provided to ascertain if additional resources or data are available.
14. How can I stay updated on further developments or reports in the Aluminum Industry?
To stay informed about further developments, trends, and reports in the Aluminum Industry, consider subscribing to industry newsletters, following relevant companies and organizations, or regularly checking reputable industry news sources and publications.
Methodology
Step 1 - Identification of Relevant Samples Size from Population Database


Step 2 - Approaches for Defining Global Market Size (Value, Volume* & Price*)

Note*: In applicable scenarios
Step 3 - Data Sources
Primary Research
- Web Analytics
- Survey Reports
- Research Institute
- Latest Research Reports
- Opinion Leaders
Secondary Research
- Annual Reports
- White Paper
- Latest Press Release
- Industry Association
- Paid Database
- Investor Presentations

Step 4 - Data Triangulation
Involves using different sources of information in order to increase the validity of a study
These sources are likely to be stakeholders in a program - participants, other researchers, program staff, other community members, and so on.
Then we put all data in single framework & apply various statistical tools to find out the dynamic on the market.
During the analysis stage, feedback from the stakeholder groups would be compared to determine areas of agreement as well as areas of divergence