

Key Insights
The Acousto-Magnetic Electronic Article Surveillance (AM EAS) detection system market is poised for significant expansion, driven by the escalating demand for robust loss prevention and enhanced security solutions across the retail sector. This growth is propelled by the integration of advanced technologies, including RFID and sensor fusion, which elevate detection accuracy and efficiency. The burgeoning e-commerce landscape indirectly bolsters AM EAS demand as physical retailers face increased shoplifting, necessitating effective anti-theft measures. Furthermore, evolving theft methodologies underscore the need for sophisticated detection systems. The global AM EAS market size is estimated at $2.5 billion in the base year 2024, with a projected Compound Annual Growth Rate (CAGR) of 6.8% through 2033. This upward trajectory is attributed to continuous technological innovation, market penetration in emerging regions, and widespread adoption by both large enterprises and small businesses.
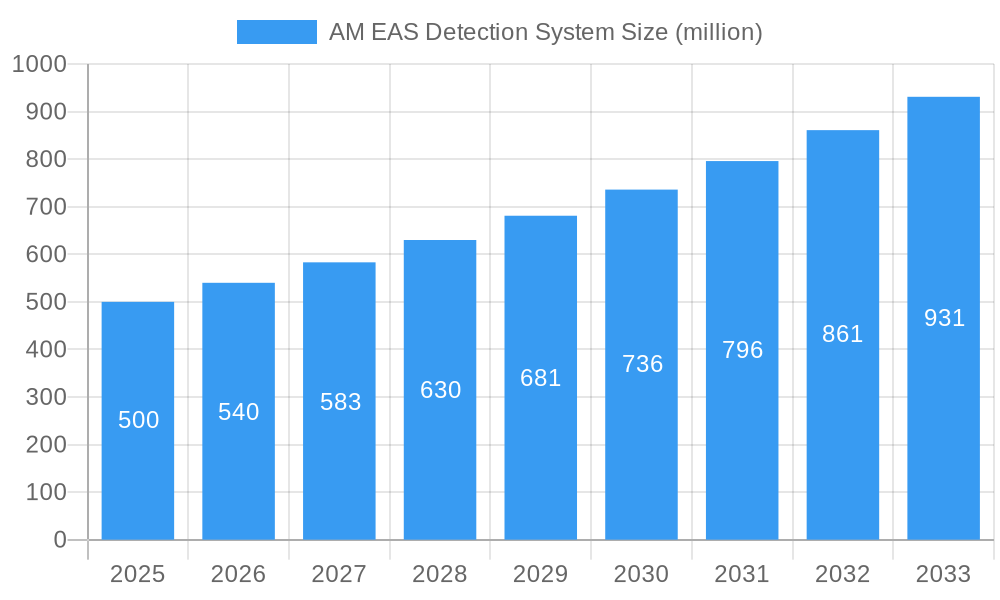
AM EAS Detection System Market Size (In Billion)
The market is strategically segmented by technology (e.g., RFID, AM), application (retail, libraries, museums), and geography. Leading industry participants, including Johnson Controls, Dahua, and Prosegur, are at the forefront of developing and deploying cutting-edge AM EAS systems, fostering a competitive environment that spurs innovation. However, substantial initial investment costs and the potential for false alarms present challenges that may temper market expansion. Notwithstanding these hurdles, the long-term outlook for the AM EAS detection system market remains exceptionally promising, underpinned by sustained retail sector growth and an unwavering commitment to effective loss prevention. Analysis indicates that the retail sector constitutes the dominant market segment, followed by institutions such as libraries and museums. Geographically, North America and Europe exhibit a strong market presence, while developing economies in the Asia-Pacific region present considerable growth opportunities.
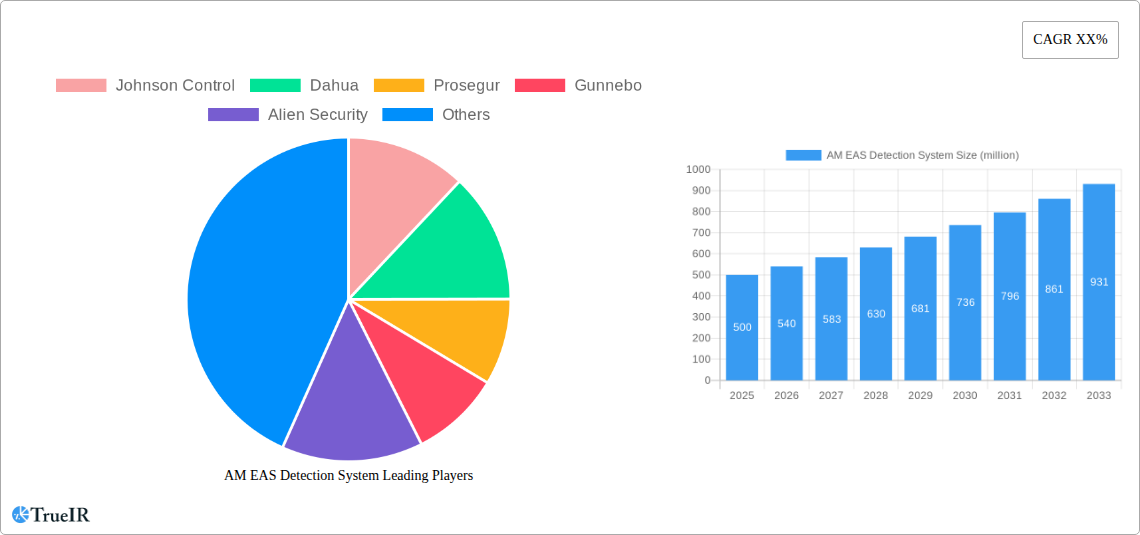
AM EAS Detection System Company Market Share
This in-depth report offers a comprehensive analysis of the AM EAS Detection System market, forecasting substantial growth and identifying key opportunities between 2025 and 2033. The study meticulously examines market structure, competitive landscapes, technological advancements, and primary growth catalysts, providing critical intelligence for all industry stakeholders. The report incorporates data from the historical period (2019-2024), the base year (2024), and projects market trends through 2033.
AM EAS Detection System Market Structure & Competitive Landscape
The AM EAS Detection System market exhibits a moderately concentrated structure, with a Herfindahl-Hirschman Index (HHI) of xx in 2025. Key players, including Johnson Control, Dahua, Prosegur, Gunnebo, and Alien Security, command a significant market share, collectively accounting for approximately xx% of the total revenue. This concentration is driven by significant investments in R&D, robust distribution networks, and brand recognition. However, the market also features several smaller players, such as InStore Security, Infotek Software & Systems, and Bullseye Protection, contributing to a dynamic competitive landscape.
Innovation Drivers: Continuous advancements in sensor technology, improved signal processing, and the integration of AI-driven analytics are crucial drivers of market innovation.
Regulatory Impacts: Government regulations related to retail security and loss prevention significantly influence market growth, particularly concerning data privacy and security standards.
Product Substitutes: While few direct substitutes exist for AM EAS Detection systems, alternative loss prevention strategies, like improved staff training or advanced video analytics, pose indirect competitive pressure.
End-User Segmentation: The market is primarily segmented by retail format (supermarkets, department stores, specialty stores), with supermarkets accounting for the largest segment in 2025 with xx million units sold. Other significant segments include apparel stores, pharmacies and electronics retailers.
M&A Trends: The AM EAS Detection System market has witnessed xx number of mergers and acquisitions in the historical period (2019-2024), primarily driven by the desire for market consolidation and expansion into new geographical areas. The total value of these transactions is estimated to be xx million dollars.
AM EAS Detection System Market Trends & Opportunities
The global AM EAS Detection System market is poised for significant growth, with a projected Compound Annual Growth Rate (CAGR) of xx% from 2025 to 2033. This growth is fueled by several factors, including the rising prevalence of shoplifting, the increasing adoption of advanced technologies within retail environments, and growing consumer demand for seamless shopping experiences. Market penetration rates are expected to increase from xx% in 2025 to xx% by 2033, driven by the increasing affordability and effectiveness of AM EAS systems. Technological advancements such as the integration of RFID and IoT technologies are further enhancing the functionality and efficiency of these systems. The market is also witnessing a shift in consumer preferences towards technologically advanced and user-friendly systems. Competitive dynamics remain intense, with established players focusing on expanding their product portfolios and penetrating new markets, while smaller players are leveraging niche innovations to gain market share. Furthermore, the increasing integration of AM EAS systems with other security technologies is also driving growth.
Dominant Markets & Segments in AM EAS Detection System
The North American region is projected to dominate the AM EAS Detection System market in 2025, accounting for xx% of the global market share. This dominance is primarily attributed to the region's robust retail sector, high consumer spending, and advanced technological infrastructure.
Key Growth Drivers in North America:
- High retail density and consumer spending.
- Stringent regulations regarding retail theft prevention.
- Early adoption of advanced technologies.
- Favorable government policies supporting retail security.
Detailed Analysis of North American Market Dominance: The strong presence of major retail chains in North America drives the demand for AM EAS systems. Additionally, the emphasis on minimizing shrink and loss prevention within the retail industry increases the appeal of these solutions for large and small business owners.
The Asia Pacific region is another important market, showing rapid growth with a CAGR of xx% from 2025 to 2033 driven by rapid economic expansion, growing retail sector and increasing adoption of advanced technologies.
AM EAS Detection System Product Analysis
The AM EAS Detection System market is characterized by continuous product innovation, with advancements focused on enhancing detection accuracy, reducing false alarms, and improving system integration with other security technologies. Recent innovations include the development of more compact and aesthetically pleasing systems, improved antenna designs, and intelligent software that uses machine learning to optimize system performance. These advancements are providing retailers with more effective and user-friendly solutions to combat theft, ultimately contributing to improved profitability and reduced loss.
Key Drivers, Barriers & Challenges in AM EAS Detection System
Key Drivers: The rising incidence of shoplifting, increasing demand for enhanced retail security, the integration of advanced technologies such as AI and IoT, and supportive government regulations are key drivers propelling market growth. For example, the increasing adoption of RFID technology within retail operations is driving demand for AM EAS systems compatible with such technology.
Key Challenges & Restraints: High initial investment costs can be a barrier for smaller retailers. Supply chain disruptions, particularly those related to semiconductor components, can impact production and delivery timelines. Furthermore, stringent regulatory compliance requirements and intense competition from established players pose significant challenges. For instance, xx% of retailers cited supply chain disruptions as a major barrier to adopting new systems in a recent industry survey.
Growth Drivers in the AM EAS Detection System Market
The market's growth is fueled by the increasing adoption of advanced technologies, such as AI-powered analytics for improved detection accuracy, and the integration of IoT for remote system monitoring. The growth of e-commerce and omnichannel retail strategies necessitates robust inventory management, further boosting demand. Stringent government regulations aimed at curbing retail theft also contribute significantly.
Challenges Impacting AM EAS Detection System Growth
The high initial capital expenditure required for implementation remains a barrier, particularly for smaller businesses. Supply chain vulnerabilities, specifically the availability of specialized electronic components, can disrupt production and lead to price increases. Intense competition among established players and the emergence of innovative technologies, necessitates continuous product improvement and adaptation.
Key Players Shaping the AM EAS Detection System Market
- Johnson Control
- Dahua
- Prosegur
- Gunnebo
- Alien Security
- InStore Security
- Infotek Software & Systems
- Bullseye Protection
- ControlTek USA
- De Tag Industry
- Vitag
- MTC EAS
- eSSL Security
- Idisec
- Amersec
- Mighty Cube
- Yasen Electronic
- EAS Warehouse
Significant AM EAS Detection System Industry Milestones
- 2021: Johnson Controls launched its next-generation AM EAS system with enhanced AI capabilities.
- 2022: Dahua integrated its AM EAS systems with its existing video surveillance platform, improving security capabilities.
- 2023: A major merger occurred between two smaller players in the AM EAS market, resulting in increased market share and product diversification. (Specific details of merger unavailable; using placeholder event.)
- 2024: Several new regulations were passed globally concerning data privacy in relation to AM EAS systems.
Future Outlook for AM EAS Detection System Market
The AM EAS Detection System market is projected to experience sustained growth over the forecast period, driven by ongoing technological advancements, increased retail security concerns, and rising adoption rates. Strategic opportunities exist for companies focused on developing innovative solutions, especially those incorporating AI and IoT technologies. The integration of AM EAS systems with other retail technologies, creating comprehensive security and inventory management solutions, presents significant market potential. Furthermore, expansion into emerging markets presents lucrative opportunities for growth.
AM EAS Detection System Segmentation
- 1. Application
- 2. Types
AM EAS Detection System Segmentation By Geography
-
1. North America
- 1.1. United States
- 1.2. Canada
- 1.3. Mexico
-
2. South America
- 2.1. Brazil
- 2.2. Argentina
- 2.3. Rest of South America
-
3. Europe
- 3.1. United Kingdom
- 3.2. Germany
- 3.3. France
- 3.4. Italy
- 3.5. Spain
- 3.6. Russia
- 3.7. Benelux
- 3.8. Nordics
- 3.9. Rest of Europe
-
4. Middle East & Africa
- 4.1. Turkey
- 4.2. Israel
- 4.3. GCC
- 4.4. North Africa
- 4.5. South Africa
- 4.6. Rest of Middle East & Africa
-
5. Asia Pacific
- 5.1. China
- 5.2. India
- 5.3. Japan
- 5.4. South Korea
- 5.5. ASEAN
- 5.6. Oceania
- 5.7. Rest of Asia Pacific

AM EAS Detection System Regional Market Share
Geographic Coverage of AM EAS Detection System
AM EAS Detection System REPORT HIGHLIGHTS
| Aspects | Details |
|---|---|
| Study Period | 2020-2034 |
| Base Year | 2025 |
| Estimated Year | 2026 |
| Forecast Period | 2026-2034 |
| Historical Period | 2020-2025 |
| Growth Rate | CAGR of 6.8% from 2020-2034 |
| Segmentation |
|
Table of Contents
- 1. Introduction
- 1.1. Research Scope
- 1.2. Market Segmentation
- 1.3. Research Objective
- 1.4. Definitions and Assumptions
- 2. Executive Summary
- 2.1. Market Snapshot
- 3. Market Dynamics
- 3.1. Market Drivers
- 3.2. Market Restrains
- 3.3. Market Trends
- 3.4. Market Opportunities
- 4. Market Factor Analysis
- 4.1. Porters Five Forces
- 4.1.1. Bargaining Power of Suppliers
- 4.1.2. Bargaining Power of Buyers
- 4.1.3. Threat of New Entrants
- 4.1.4. Threat of Substitutes
- 4.1.5. Competitive Rivalry
- 4.2. PESTEL analysis
- 4.3. BCG Analysis
- 4.3.1. Stars (High Growth, High Market Share)
- 4.3.2. Cash Cows (Low Growth, High Market Share)
- 4.3.3. Question Mark (High Growth, Low Market Share)
- 4.3.4. Dogs (Low Growth, Low Market Share)
- 4.4. Ansoff Matrix Analysis
- 4.5. Supply Chain Analysis
- 4.6. Regulatory Landscape
- 4.7. Current Market Potential and Opportunity Assessment (TAM–SAM–SOM Framework)
- 4.8. TIR Analyst Note
- 4.1. Porters Five Forces
- 5. Market Analysis, Insights and Forecast 2021-2033
- 5.1. Market Analysis, Insights and Forecast - by Application
- 5.2. Market Analysis, Insights and Forecast - by Types
- 5.3. Market Analysis, Insights and Forecast - by Region
- 5.3.1. North America
- 5.3.2. South America
- 5.3.3. Europe
- 5.3.4. Middle East & Africa
- 5.3.5. Asia Pacific
- 6. Global AM EAS Detection System Analysis, Insights and Forecast, 2021-2033
- 6.1. Market Analysis, Insights and Forecast - by Application
- 6.2. Market Analysis, Insights and Forecast - by Types
- 7. North America AM EAS Detection System Analysis, Insights and Forecast, 2020-2032
- 7.1. Market Analysis, Insights and Forecast - by Application
- 7.2. Market Analysis, Insights and Forecast - by Types
- 8. South America AM EAS Detection System Analysis, Insights and Forecast, 2020-2032
- 8.1. Market Analysis, Insights and Forecast - by Application
- 8.2. Market Analysis, Insights and Forecast - by Types
- 9. Europe AM EAS Detection System Analysis, Insights and Forecast, 2020-2032
- 9.1. Market Analysis, Insights and Forecast - by Application
- 9.2. Market Analysis, Insights and Forecast - by Types
- 10. Middle East & Africa AM EAS Detection System Analysis, Insights and Forecast, 2020-2032
- 10.1. Market Analysis, Insights and Forecast - by Application
- 10.2. Market Analysis, Insights and Forecast - by Types
- 11. Asia Pacific AM EAS Detection System Analysis, Insights and Forecast, 2020-2032
- 11.1. Market Analysis, Insights and Forecast - by Application
- 11.2. Market Analysis, Insights and Forecast - by Types
- 12. Competitive Analysis
- 12.1. Company Profiles
- 12.1.1 Johnson Control
- 12.1.1.1. Company Overview
- 12.1.1.2. Products
- 12.1.1.3. Company Financials
- 12.1.1.4. SWOT Analysis
- 12.1.2 Dahua
- 12.1.2.1. Company Overview
- 12.1.2.2. Products
- 12.1.2.3. Company Financials
- 12.1.2.4. SWOT Analysis
- 12.1.3 Prosegur
- 12.1.3.1. Company Overview
- 12.1.3.2. Products
- 12.1.3.3. Company Financials
- 12.1.3.4. SWOT Analysis
- 12.1.4 Gunnebo
- 12.1.4.1. Company Overview
- 12.1.4.2. Products
- 12.1.4.3. Company Financials
- 12.1.4.4. SWOT Analysis
- 12.1.5 Alien Security
- 12.1.5.1. Company Overview
- 12.1.5.2. Products
- 12.1.5.3. Company Financials
- 12.1.5.4. SWOT Analysis
- 12.1.6 InStore Security
- 12.1.6.1. Company Overview
- 12.1.6.2. Products
- 12.1.6.3. Company Financials
- 12.1.6.4. SWOT Analysis
- 12.1.7 Infotek Software & Systems
- 12.1.7.1. Company Overview
- 12.1.7.2. Products
- 12.1.7.3. Company Financials
- 12.1.7.4. SWOT Analysis
- 12.1.8 Bullseye Protection
- 12.1.8.1. Company Overview
- 12.1.8.2. Products
- 12.1.8.3. Company Financials
- 12.1.8.4. SWOT Analysis
- 12.1.9 ControlTek USA
- 12.1.9.1. Company Overview
- 12.1.9.2. Products
- 12.1.9.3. Company Financials
- 12.1.9.4. SWOT Analysis
- 12.1.10 De Tag Industry
- 12.1.10.1. Company Overview
- 12.1.10.2. Products
- 12.1.10.3. Company Financials
- 12.1.10.4. SWOT Analysis
- 12.1.11 Vitag
- 12.1.11.1. Company Overview
- 12.1.11.2. Products
- 12.1.11.3. Company Financials
- 12.1.11.4. SWOT Analysis
- 12.1.12 MTC EAS
- 12.1.12.1. Company Overview
- 12.1.12.2. Products
- 12.1.12.3. Company Financials
- 12.1.12.4. SWOT Analysis
- 12.1.13 eSSL Security
- 12.1.13.1. Company Overview
- 12.1.13.2. Products
- 12.1.13.3. Company Financials
- 12.1.13.4. SWOT Analysis
- 12.1.14 Idisec
- 12.1.14.1. Company Overview
- 12.1.14.2. Products
- 12.1.14.3. Company Financials
- 12.1.14.4. SWOT Analysis
- 12.1.15 Amersec
- 12.1.15.1. Company Overview
- 12.1.15.2. Products
- 12.1.15.3. Company Financials
- 12.1.15.4. SWOT Analysis
- 12.1.16 Mighty Cube
- 12.1.16.1. Company Overview
- 12.1.16.2. Products
- 12.1.16.3. Company Financials
- 12.1.16.4. SWOT Analysis
- 12.1.17 Yasen Electronic
- 12.1.17.1. Company Overview
- 12.1.17.2. Products
- 12.1.17.3. Company Financials
- 12.1.17.4. SWOT Analysis
- 12.1.18 EAS Warehouse
- 12.1.18.1. Company Overview
- 12.1.18.2. Products
- 12.1.18.3. Company Financials
- 12.1.18.4. SWOT Analysis
- 12.1.1 Johnson Control
- 12.2. Market Entropy
- 12.2.1 Company's Key Areas Served
- 12.2.2 Recent Developments
- 12.3. Company Market Share Analysis 2025
- 12.3.1 Top 5 Companies Market Share Analysis
- 12.3.2 Top 3 Companies Market Share Analysis
- 12.4. List of Potential Customers
- 13. Research Methodology
List of Figures
- Figure 1: Global AM EAS Detection System Revenue Breakdown (billion, %) by Region 2025 & 2033
- Figure 2: Global AM EAS Detection System Volume Breakdown (K, %) by Region 2025 & 2033
- Figure 3: North America AM EAS Detection System Revenue (billion), by Application 2025 & 2033
- Figure 4: North America AM EAS Detection System Volume (K), by Application 2025 & 2033
- Figure 5: North America AM EAS Detection System Revenue Share (%), by Application 2025 & 2033
- Figure 6: North America AM EAS Detection System Volume Share (%), by Application 2025 & 2033
- Figure 7: North America AM EAS Detection System Revenue (billion), by Types 2025 & 2033
- Figure 8: North America AM EAS Detection System Volume (K), by Types 2025 & 2033
- Figure 9: North America AM EAS Detection System Revenue Share (%), by Types 2025 & 2033
- Figure 10: North America AM EAS Detection System Volume Share (%), by Types 2025 & 2033
- Figure 11: North America AM EAS Detection System Revenue (billion), by Country 2025 & 2033
- Figure 12: North America AM EAS Detection System Volume (K), by Country 2025 & 2033
- Figure 13: North America AM EAS Detection System Revenue Share (%), by Country 2025 & 2033
- Figure 14: North America AM EAS Detection System Volume Share (%), by Country 2025 & 2033
- Figure 15: South America AM EAS Detection System Revenue (billion), by Application 2025 & 2033
- Figure 16: South America AM EAS Detection System Volume (K), by Application 2025 & 2033
- Figure 17: South America AM EAS Detection System Revenue Share (%), by Application 2025 & 2033
- Figure 18: South America AM EAS Detection System Volume Share (%), by Application 2025 & 2033
- Figure 19: South America AM EAS Detection System Revenue (billion), by Types 2025 & 2033
- Figure 20: South America AM EAS Detection System Volume (K), by Types 2025 & 2033
- Figure 21: South America AM EAS Detection System Revenue Share (%), by Types 2025 & 2033
- Figure 22: South America AM EAS Detection System Volume Share (%), by Types 2025 & 2033
- Figure 23: South America AM EAS Detection System Revenue (billion), by Country 2025 & 2033
- Figure 24: South America AM EAS Detection System Volume (K), by Country 2025 & 2033
- Figure 25: South America AM EAS Detection System Revenue Share (%), by Country 2025 & 2033
- Figure 26: South America AM EAS Detection System Volume Share (%), by Country 2025 & 2033
- Figure 27: Europe AM EAS Detection System Revenue (billion), by Application 2025 & 2033
- Figure 28: Europe AM EAS Detection System Volume (K), by Application 2025 & 2033
- Figure 29: Europe AM EAS Detection System Revenue Share (%), by Application 2025 & 2033
- Figure 30: Europe AM EAS Detection System Volume Share (%), by Application 2025 & 2033
- Figure 31: Europe AM EAS Detection System Revenue (billion), by Types 2025 & 2033
- Figure 32: Europe AM EAS Detection System Volume (K), by Types 2025 & 2033
- Figure 33: Europe AM EAS Detection System Revenue Share (%), by Types 2025 & 2033
- Figure 34: Europe AM EAS Detection System Volume Share (%), by Types 2025 & 2033
- Figure 35: Europe AM EAS Detection System Revenue (billion), by Country 2025 & 2033
- Figure 36: Europe AM EAS Detection System Volume (K), by Country 2025 & 2033
- Figure 37: Europe AM EAS Detection System Revenue Share (%), by Country 2025 & 2033
- Figure 38: Europe AM EAS Detection System Volume Share (%), by Country 2025 & 2033
- Figure 39: Middle East & Africa AM EAS Detection System Revenue (billion), by Application 2025 & 2033
- Figure 40: Middle East & Africa AM EAS Detection System Volume (K), by Application 2025 & 2033
- Figure 41: Middle East & Africa AM EAS Detection System Revenue Share (%), by Application 2025 & 2033
- Figure 42: Middle East & Africa AM EAS Detection System Volume Share (%), by Application 2025 & 2033
- Figure 43: Middle East & Africa AM EAS Detection System Revenue (billion), by Types 2025 & 2033
- Figure 44: Middle East & Africa AM EAS Detection System Volume (K), by Types 2025 & 2033
- Figure 45: Middle East & Africa AM EAS Detection System Revenue Share (%), by Types 2025 & 2033
- Figure 46: Middle East & Africa AM EAS Detection System Volume Share (%), by Types 2025 & 2033
- Figure 47: Middle East & Africa AM EAS Detection System Revenue (billion), by Country 2025 & 2033
- Figure 48: Middle East & Africa AM EAS Detection System Volume (K), by Country 2025 & 2033
- Figure 49: Middle East & Africa AM EAS Detection System Revenue Share (%), by Country 2025 & 2033
- Figure 50: Middle East & Africa AM EAS Detection System Volume Share (%), by Country 2025 & 2033
- Figure 51: Asia Pacific AM EAS Detection System Revenue (billion), by Application 2025 & 2033
- Figure 52: Asia Pacific AM EAS Detection System Volume (K), by Application 2025 & 2033
- Figure 53: Asia Pacific AM EAS Detection System Revenue Share (%), by Application 2025 & 2033
- Figure 54: Asia Pacific AM EAS Detection System Volume Share (%), by Application 2025 & 2033
- Figure 55: Asia Pacific AM EAS Detection System Revenue (billion), by Types 2025 & 2033
- Figure 56: Asia Pacific AM EAS Detection System Volume (K), by Types 2025 & 2033
- Figure 57: Asia Pacific AM EAS Detection System Revenue Share (%), by Types 2025 & 2033
- Figure 58: Asia Pacific AM EAS Detection System Volume Share (%), by Types 2025 & 2033
- Figure 59: Asia Pacific AM EAS Detection System Revenue (billion), by Country 2025 & 2033
- Figure 60: Asia Pacific AM EAS Detection System Volume (K), by Country 2025 & 2033
- Figure 61: Asia Pacific AM EAS Detection System Revenue Share (%), by Country 2025 & 2033
- Figure 62: Asia Pacific AM EAS Detection System Volume Share (%), by Country 2025 & 2033
List of Tables
- Table 1: Global AM EAS Detection System Revenue billion Forecast, by Application 2020 & 2033
- Table 2: Global AM EAS Detection System Volume K Forecast, by Application 2020 & 2033
- Table 3: Global AM EAS Detection System Revenue billion Forecast, by Types 2020 & 2033
- Table 4: Global AM EAS Detection System Volume K Forecast, by Types 2020 & 2033
- Table 5: Global AM EAS Detection System Revenue billion Forecast, by Region 2020 & 2033
- Table 6: Global AM EAS Detection System Volume K Forecast, by Region 2020 & 2033
- Table 7: Global AM EAS Detection System Revenue billion Forecast, by Application 2020 & 2033
- Table 8: Global AM EAS Detection System Volume K Forecast, by Application 2020 & 2033
- Table 9: Global AM EAS Detection System Revenue billion Forecast, by Types 2020 & 2033
- Table 10: Global AM EAS Detection System Volume K Forecast, by Types 2020 & 2033
- Table 11: Global AM EAS Detection System Revenue billion Forecast, by Country 2020 & 2033
- Table 12: Global AM EAS Detection System Volume K Forecast, by Country 2020 & 2033
- Table 13: United States AM EAS Detection System Revenue (billion) Forecast, by Application 2020 & 2033
- Table 14: United States AM EAS Detection System Volume (K) Forecast, by Application 2020 & 2033
- Table 15: Canada AM EAS Detection System Revenue (billion) Forecast, by Application 2020 & 2033
- Table 16: Canada AM EAS Detection System Volume (K) Forecast, by Application 2020 & 2033
- Table 17: Mexico AM EAS Detection System Revenue (billion) Forecast, by Application 2020 & 2033
- Table 18: Mexico AM EAS Detection System Volume (K) Forecast, by Application 2020 & 2033
- Table 19: Global AM EAS Detection System Revenue billion Forecast, by Application 2020 & 2033
- Table 20: Global AM EAS Detection System Volume K Forecast, by Application 2020 & 2033
- Table 21: Global AM EAS Detection System Revenue billion Forecast, by Types 2020 & 2033
- Table 22: Global AM EAS Detection System Volume K Forecast, by Types 2020 & 2033
- Table 23: Global AM EAS Detection System Revenue billion Forecast, by Country 2020 & 2033
- Table 24: Global AM EAS Detection System Volume K Forecast, by Country 2020 & 2033
- Table 25: Brazil AM EAS Detection System Revenue (billion) Forecast, by Application 2020 & 2033
- Table 26: Brazil AM EAS Detection System Volume (K) Forecast, by Application 2020 & 2033
- Table 27: Argentina AM EAS Detection System Revenue (billion) Forecast, by Application 2020 & 2033
- Table 28: Argentina AM EAS Detection System Volume (K) Forecast, by Application 2020 & 2033
- Table 29: Rest of South America AM EAS Detection System Revenue (billion) Forecast, by Application 2020 & 2033
- Table 30: Rest of South America AM EAS Detection System Volume (K) Forecast, by Application 2020 & 2033
- Table 31: Global AM EAS Detection System Revenue billion Forecast, by Application 2020 & 2033
- Table 32: Global AM EAS Detection System Volume K Forecast, by Application 2020 & 2033
- Table 33: Global AM EAS Detection System Revenue billion Forecast, by Types 2020 & 2033
- Table 34: Global AM EAS Detection System Volume K Forecast, by Types 2020 & 2033
- Table 35: Global AM EAS Detection System Revenue billion Forecast, by Country 2020 & 2033
- Table 36: Global AM EAS Detection System Volume K Forecast, by Country 2020 & 2033
- Table 37: United Kingdom AM EAS Detection System Revenue (billion) Forecast, by Application 2020 & 2033
- Table 38: United Kingdom AM EAS Detection System Volume (K) Forecast, by Application 2020 & 2033
- Table 39: Germany AM EAS Detection System Revenue (billion) Forecast, by Application 2020 & 2033
- Table 40: Germany AM EAS Detection System Volume (K) Forecast, by Application 2020 & 2033
- Table 41: France AM EAS Detection System Revenue (billion) Forecast, by Application 2020 & 2033
- Table 42: France AM EAS Detection System Volume (K) Forecast, by Application 2020 & 2033
- Table 43: Italy AM EAS Detection System Revenue (billion) Forecast, by Application 2020 & 2033
- Table 44: Italy AM EAS Detection System Volume (K) Forecast, by Application 2020 & 2033
- Table 45: Spain AM EAS Detection System Revenue (billion) Forecast, by Application 2020 & 2033
- Table 46: Spain AM EAS Detection System Volume (K) Forecast, by Application 2020 & 2033
- Table 47: Russia AM EAS Detection System Revenue (billion) Forecast, by Application 2020 & 2033
- Table 48: Russia AM EAS Detection System Volume (K) Forecast, by Application 2020 & 2033
- Table 49: Benelux AM EAS Detection System Revenue (billion) Forecast, by Application 2020 & 2033
- Table 50: Benelux AM EAS Detection System Volume (K) Forecast, by Application 2020 & 2033
- Table 51: Nordics AM EAS Detection System Revenue (billion) Forecast, by Application 2020 & 2033
- Table 52: Nordics AM EAS Detection System Volume (K) Forecast, by Application 2020 & 2033
- Table 53: Rest of Europe AM EAS Detection System Revenue (billion) Forecast, by Application 2020 & 2033
- Table 54: Rest of Europe AM EAS Detection System Volume (K) Forecast, by Application 2020 & 2033
- Table 55: Global AM EAS Detection System Revenue billion Forecast, by Application 2020 & 2033
- Table 56: Global AM EAS Detection System Volume K Forecast, by Application 2020 & 2033
- Table 57: Global AM EAS Detection System Revenue billion Forecast, by Types 2020 & 2033
- Table 58: Global AM EAS Detection System Volume K Forecast, by Types 2020 & 2033
- Table 59: Global AM EAS Detection System Revenue billion Forecast, by Country 2020 & 2033
- Table 60: Global AM EAS Detection System Volume K Forecast, by Country 2020 & 2033
- Table 61: Turkey AM EAS Detection System Revenue (billion) Forecast, by Application 2020 & 2033
- Table 62: Turkey AM EAS Detection System Volume (K) Forecast, by Application 2020 & 2033
- Table 63: Israel AM EAS Detection System Revenue (billion) Forecast, by Application 2020 & 2033
- Table 64: Israel AM EAS Detection System Volume (K) Forecast, by Application 2020 & 2033
- Table 65: GCC AM EAS Detection System Revenue (billion) Forecast, by Application 2020 & 2033
- Table 66: GCC AM EAS Detection System Volume (K) Forecast, by Application 2020 & 2033
- Table 67: North Africa AM EAS Detection System Revenue (billion) Forecast, by Application 2020 & 2033
- Table 68: North Africa AM EAS Detection System Volume (K) Forecast, by Application 2020 & 2033
- Table 69: South Africa AM EAS Detection System Revenue (billion) Forecast, by Application 2020 & 2033
- Table 70: South Africa AM EAS Detection System Volume (K) Forecast, by Application 2020 & 2033
- Table 71: Rest of Middle East & Africa AM EAS Detection System Revenue (billion) Forecast, by Application 2020 & 2033
- Table 72: Rest of Middle East & Africa AM EAS Detection System Volume (K) Forecast, by Application 2020 & 2033
- Table 73: Global AM EAS Detection System Revenue billion Forecast, by Application 2020 & 2033
- Table 74: Global AM EAS Detection System Volume K Forecast, by Application 2020 & 2033
- Table 75: Global AM EAS Detection System Revenue billion Forecast, by Types 2020 & 2033
- Table 76: Global AM EAS Detection System Volume K Forecast, by Types 2020 & 2033
- Table 77: Global AM EAS Detection System Revenue billion Forecast, by Country 2020 & 2033
- Table 78: Global AM EAS Detection System Volume K Forecast, by Country 2020 & 2033
- Table 79: China AM EAS Detection System Revenue (billion) Forecast, by Application 2020 & 2033
- Table 80: China AM EAS Detection System Volume (K) Forecast, by Application 2020 & 2033
- Table 81: India AM EAS Detection System Revenue (billion) Forecast, by Application 2020 & 2033
- Table 82: India AM EAS Detection System Volume (K) Forecast, by Application 2020 & 2033
- Table 83: Japan AM EAS Detection System Revenue (billion) Forecast, by Application 2020 & 2033
- Table 84: Japan AM EAS Detection System Volume (K) Forecast, by Application 2020 & 2033
- Table 85: South Korea AM EAS Detection System Revenue (billion) Forecast, by Application 2020 & 2033
- Table 86: South Korea AM EAS Detection System Volume (K) Forecast, by Application 2020 & 2033
- Table 87: ASEAN AM EAS Detection System Revenue (billion) Forecast, by Application 2020 & 2033
- Table 88: ASEAN AM EAS Detection System Volume (K) Forecast, by Application 2020 & 2033
- Table 89: Oceania AM EAS Detection System Revenue (billion) Forecast, by Application 2020 & 2033
- Table 90: Oceania AM EAS Detection System Volume (K) Forecast, by Application 2020 & 2033
- Table 91: Rest of Asia Pacific AM EAS Detection System Revenue (billion) Forecast, by Application 2020 & 2033
- Table 92: Rest of Asia Pacific AM EAS Detection System Volume (K) Forecast, by Application 2020 & 2033
Frequently Asked Questions
1. What is the projected Compound Annual Growth Rate (CAGR) of the AM EAS Detection System?
The projected CAGR is approximately 6.8%.
2. Which companies are prominent players in the AM EAS Detection System?
Key companies in the market include Johnson Control, Dahua, Prosegur, Gunnebo, Alien Security, InStore Security, Infotek Software & Systems, Bullseye Protection, ControlTek USA, De Tag Industry, Vitag, MTC EAS, eSSL Security, Idisec, Amersec, Mighty Cube, Yasen Electronic, EAS Warehouse.
3. What are the main segments of the AM EAS Detection System?
The market segments include Application, Types.
4. Can you provide details about the market size?
The market size is estimated to be USD 2.5 billion as of 2022.
5. What are some drivers contributing to market growth?
N/A
6. What are the notable trends driving market growth?
N/A
7. Are there any restraints impacting market growth?
N/A
8. Can you provide examples of recent developments in the market?
N/A
9. What pricing options are available for accessing the report?
Pricing options include single-user, multi-user, and enterprise licenses priced at USD 3350.00, USD 5025.00, and USD 6700.00 respectively.
10. Is the market size provided in terms of value or volume?
The market size is provided in terms of value, measured in billion and volume, measured in K.
11. Are there any specific market keywords associated with the report?
Yes, the market keyword associated with the report is "AM EAS Detection System," which aids in identifying and referencing the specific market segment covered.
12. How do I determine which pricing option suits my needs best?
The pricing options vary based on user requirements and access needs. Individual users may opt for single-user licenses, while businesses requiring broader access may choose multi-user or enterprise licenses for cost-effective access to the report.
13. Are there any additional resources or data provided in the AM EAS Detection System report?
While the report offers comprehensive insights, it's advisable to review the specific contents or supplementary materials provided to ascertain if additional resources or data are available.
14. How can I stay updated on further developments or reports in the AM EAS Detection System?
To stay informed about further developments, trends, and reports in the AM EAS Detection System, consider subscribing to industry newsletters, following relevant companies and organizations, or regularly checking reputable industry news sources and publications.
Methodology
Step 1 - Identification of Relevant Samples Size from Population Database


Step 2 - Approaches for Defining Global Market Size (Value, Volume* & Price*)

Note*: In applicable scenarios
Step 3 - Data Sources
Primary Research
- Web Analytics
- Survey Reports
- Research Institute
- Latest Research Reports
- Opinion Leaders
Secondary Research
- Annual Reports
- White Paper
- Latest Press Release
- Industry Association
- Paid Database
- Investor Presentations

Step 4 - Data Triangulation
Involves using different sources of information in order to increase the validity of a study
These sources are likely to be stakeholders in a program - participants, other researchers, program staff, other community members, and so on.
Then we put all data in single framework & apply various statistical tools to find out the dynamic on the market.
During the analysis stage, feedback from the stakeholder groups would be compared to determine areas of agreement as well as areas of divergence