

Key Insights
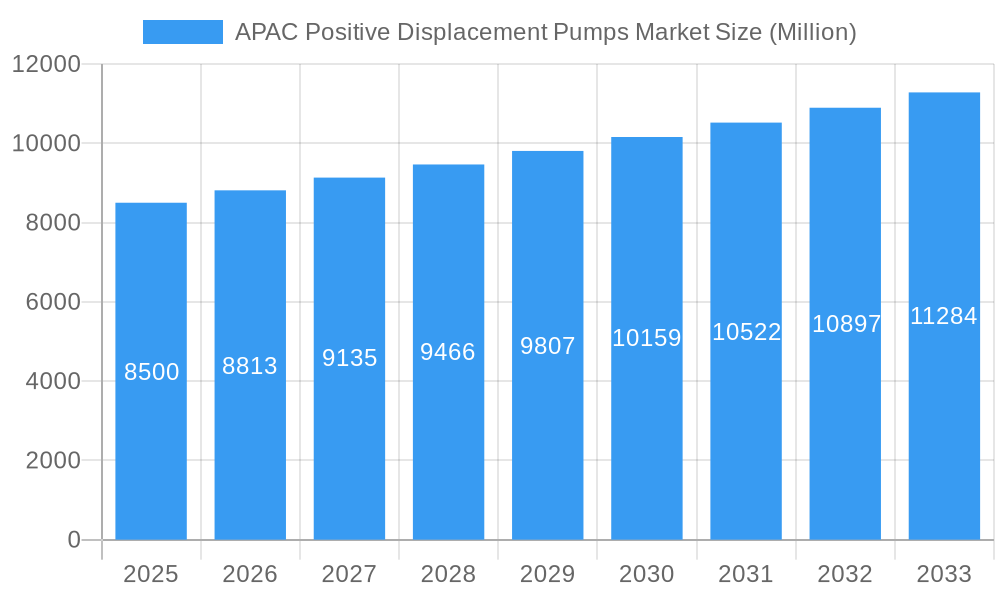
The Asia Pacific Positive Displacement Pumps Market is projected for significant expansion, driven by robust industrialization and infrastructure development. The market is anticipated to reach a size of $20721.9 million by 2025, growing at a CAGR of 5.4% from 2025 to 2033. Key demand stems from the oil & gas sector for efficient hydrocarbon extraction, the chemicals industry for handling corrosive fluids, and the food & beverage sector for processing and packaging. Growing investments in sanitation and water management infrastructure also fuel demand in the waste & wastewater treatment segment.
APAC Positive Displacement Pumps Market Market Size (In Billion)
Technological advancements, including IoT-enabled pumps for enhanced monitoring and predictive maintenance, are shaping market dynamics. Progressive cavity and screw pumps are gaining popularity for viscous and shear-sensitive fluid applications in pharmaceuticals and food processing. While initial investment costs for advanced technologies and the availability of lower-cost alternatives present challenges, continuous innovation by leading manufacturers in developing cost-effective and energy-efficient solutions is expected to drive sustained market growth and widespread adoption across diverse end-user industries.
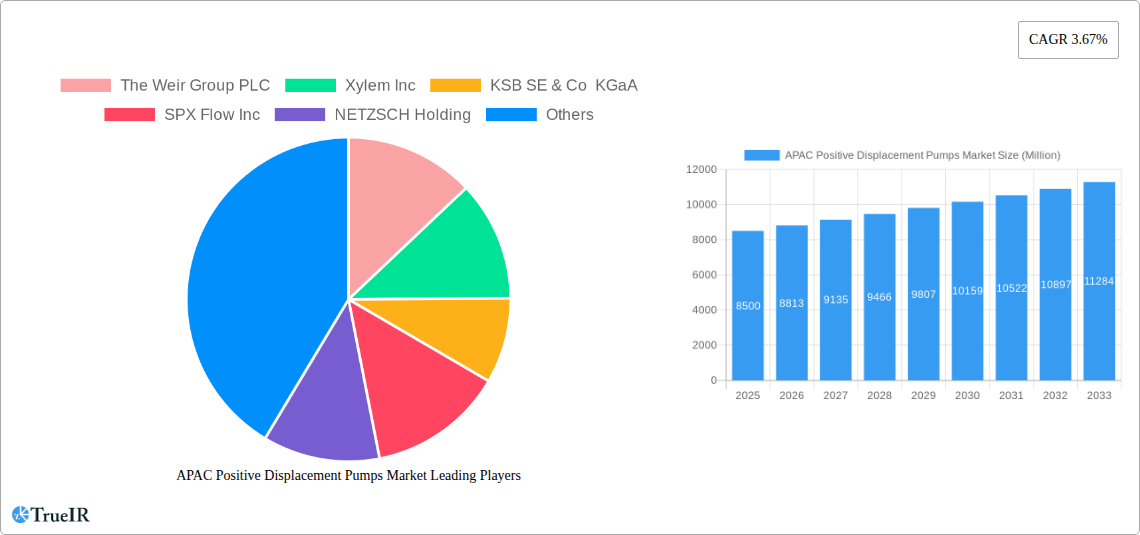
APAC Positive Displacement Pumps Market Company Market Share
This comprehensive market research report delivers an in-depth analysis of the APAC Positive Displacement Pumps Market, providing critical insights into market dynamics, competitive strategies, and future growth trajectories. The study, spanning from 2019 to 2033 with a base year of 2025, is an essential resource for stakeholders seeking to capitalize on emerging opportunities. It details market size projections, technological advancements, and the strategic landscape of key players within the positive displacement pumps Asia Pacific market.
APAC Positive Displacement Pumps Market Market Structure & Competitive Landscape
The APAC Positive Displacement Pumps market exhibits a moderately concentrated structure, with a blend of global giants and regional specialists vying for market share. Innovation serves as a primary driver, with companies continuously investing in R&D to develop more efficient, robust, and specialized pump solutions. Regulatory impacts, particularly concerning environmental compliance and safety standards in industries like Oil & Gas and Chemicals, also shape product development and market entry strategies. The availability of product substitutes, such as dynamic pumps in certain lower-demand applications, influences market segmentation. End-user segmentation is diverse, with the Oil & Gas, Chemicals, and Food & Beverage industries being significant contributors. Mergers and Acquisitions (M&A) activity, while not excessively high, plays a role in market consolidation and expansion of product portfolios. For instance, the Asia Pacific positive displacement pump market sees strategic alliances and acquisitions aimed at bolstering technological capabilities and geographical reach. Quantitative insights, such as estimated market concentration ratios of around 60-70% among the top five players, alongside several smaller, specialized manufacturers, highlight the competitive intensity. M&A volumes, though variable year-on-year, are driven by the desire to acquire advanced technologies or expand into high-growth sub-regions within APAC.
APAC Positive Displacement Pumps Market Market Trends & Opportunities
The APAC Positive Displacement Pumps market is poised for substantial growth, driven by escalating industrialization, increasing infrastructure development, and a growing emphasis on efficient fluid handling across diverse sectors. The projected market size for the APAC Positive Displacement Pumps market is estimated to reach approximately US$ 7,500 Million by 2025, with a robust Compound Annual Growth Rate (CAGR) of 6.8% during the forecast period of 2025–2033. Technological shifts are prominently featured, with advancements in materials science leading to pumps with enhanced durability and chemical resistance, crucial for the chemical industry positive displacement pumps segment. Furthermore, the integration of smart technologies and IoT capabilities in pumps is gaining traction, enabling remote monitoring, predictive maintenance, and optimized operational efficiency, a key trend in the smart positive displacement pumps APAC landscape. Consumer preferences are increasingly leaning towards energy-efficient and environmentally friendly solutions, pushing manufacturers to develop pumps with lower power consumption and reduced emissions. This aligns with stringent environmental regulations across many APAC nations. Competitive dynamics are intensifying as both established players and new entrants strive to capture market share by offering differentiated products and comprehensive service packages. The oil & gas positive displacement pumps Asia Pacific sector, despite global energy transition efforts, continues to represent a significant market due to ongoing exploration and production activities, especially in regions like Southeast Asia and Australia. The food & beverage positive displacement pumps market is experiencing accelerated growth due to rising demand for processed foods and beverages, requiring hygienic and precise pumping solutions. Opportunities abound in catering to the growing waste and wastewater management positive displacement pumps sector, driven by urbanization and increased investments in water treatment infrastructure. The pharmaceutical industry, with its demand for sterile and high-purity fluid transfer, also presents lucrative prospects. The progressing cavity pumps APAC and screw pumps Asia Pacific segments are expected to witness considerable expansion due to their suitability for handling viscous and abrasive media. The diaphragm pumps Asia Pacific market will benefit from their widespread application in chemical and pharmaceutical industries. The overall market penetration for positive displacement pumps in the APAC region is steadily increasing, indicating a strong demand for these essential industrial components.
Dominant Markets & Segments in APAC Positive Displacement Pumps Market
The Oil & Gas end-user industry stands as a dominant force within the APAC Positive Displacement Pumps market, driven by substantial ongoing exploration, extraction, and refining activities across the region, particularly in countries like China, India, and Southeast Asian nations. This segment's growth is fueled by the need for reliable pumps to handle crude oil, refined products, and associated fluids, often under challenging conditions.
- Key Growth Drivers in Oil & Gas:
- Infrastructure Development: Continued investment in offshore and onshore oil and gas infrastructure projects.
- Resource Exploration: Ongoing exploration for new reserves, especially in emerging markets.
- Refining Capacity Expansion: Governments and private entities investing in expanding refining capabilities to meet domestic and export demands.
- Technological Advancements: Adoption of advanced pumps capable of handling high pressures, corrosive fluids, and extreme temperatures.
The Chemicals industry is another significant contributor to the APAC Positive Displacement Pumps market. The region's robust chemical manufacturing base, serving diverse downstream industries like textiles, plastics, and agriculture, necessitates the precise and safe transfer of a wide array of chemicals, including corrosive and hazardous substances.
- Key Growth Drivers in Chemicals:
- Growing Manufacturing Sector: Expansion of chemical manufacturing facilities to support various industrial applications.
- Specialty Chemical Demand: Increasing demand for specialty chemicals in pharmaceuticals, electronics, and automotive sectors.
- Environmental Regulations: Stringent regulations promoting the use of leak-free and efficient pumps for hazardous material handling.
The Food & Beverage sector is witnessing rapid expansion, driven by a burgeoning middle class, urbanization, and evolving consumer preferences for processed and packaged foods. Positive displacement pumps are crucial for hygienic and efficient fluid transfer in processes like mixing, filling, and dispensing.
- Key Growth Drivers in Food & Beverage:
- Rising Consumer Demand: Increased consumption of processed foods and beverages.
- Hygiene Standards: Growing emphasis on food safety and hygiene, favoring specialized positive displacement pumps.
- Automation in Food Processing: Integration of automated systems in food manufacturing.
The Waste & Wastewater segment is also a key growth area, fueled by significant government initiatives and investments in improving water treatment infrastructure and sanitation across APAC. Positive displacement pumps are vital for sludge transfer, chemical dosing, and various treatment processes.
- Dominant Segments by Type:
- Progressive Cavity Pumps: Widely used in oil & gas, waste & wastewater, and chemical industries for handling viscous, abrasive, and solids-laden fluids. Their ability to provide consistent flow rates makes them ideal for these demanding applications.
- Gear Pumps: Integral to the chemical and food & beverage industries for their precision and ability to handle a range of fluid viscosities.
- Diaphragm Pumps: Valued for their leak-free operation and suitability for abrasive and sensitive fluids, finding extensive use in chemical, pharmaceutical, and waste & wastewater treatment.
- Screw Pumps: Increasingly adopted in oil & gas and industrial applications for their self-priming capabilities and efficient handling of high-viscosity fluids.
Emerging markets within APAC, such as India and Vietnam, are showing particularly strong growth potential due to ongoing industrial expansion and infrastructure development, making them key focus areas for market players.
APAC Positive Displacement Pumps Market Product Analysis
Product innovation in the APAC Positive Displacement Pumps market is primarily focused on enhancing energy efficiency, improving material durability for corrosive environments, and developing smart functionalities for remote monitoring and predictive maintenance. Companies are actively introducing pump models with advanced sealing technologies, corrosion-resistant alloys, and optimized impeller designs to cater to specific industry demands. For example, the recent launch of the PERIPRO peristaltic pump by NETZSCH highlights a trend towards specialized solutions for chemical, industrial, and food applications, complementing existing product lines like NEMO progressing cavity pumps. These advancements ensure a better market fit for applications requiring precise dosing, high-purity handling, and robust performance in challenging conditions.
Key Drivers, Barriers & Challenges in APAC Positive Displacement Pumps Market
Key Drivers: The APAC Positive Displacement Pumps market is propelled by robust industrial growth across sectors like Oil & Gas, Chemicals, and Food & Beverage, driven by increasing regional demand and manufacturing output. Technological advancements, including the development of energy-efficient, low-maintenance, and smart-enabled pumps, are crucial growth catalysts. Supportive government policies aimed at industrial development, infrastructure enhancement, and environmental compliance further bolster market expansion. For instance, the increasing focus on water treatment infrastructure in various APAC nations directly translates to higher demand for positive displacement pumps in the waste and wastewater segment.
Barriers & Challenges: Supply chain disruptions, exacerbated by geopolitical factors and logistical complexities, pose a significant challenge to manufacturers and end-users alike, potentially impacting lead times and material costs. Stringent and evolving regulatory landscapes across different APAC countries, particularly concerning environmental emissions and safety standards, require continuous product adaptation and compliance investments. Intense competition among both global and local players can lead to price pressures and margin erosion, particularly in mature segments. Furthermore, the initial capital expenditure for advanced positive displacement pumps can be a barrier for some smaller enterprises.
Growth Drivers in the APAC Positive Displacement Pumps Market Market
The APAC Positive Displacement Pumps market is experiencing robust growth fueled by several key drivers. Technologically, advancements in pump design, leading to increased efficiency, reduced energy consumption, and enhanced durability in harsh environments, are critical. Economic factors such as rapid industrialization across emerging economies within APAC, coupled with significant investments in infrastructure projects like water treatment facilities and oil and gas exploration, directly translate into higher demand for these pumps. Policy-driven factors, including government initiatives promoting manufacturing excellence, stricter environmental regulations requiring cleaner fluid handling, and incentives for adopting advanced industrial technologies, also play a vital role. For example, the "Make in India" initiative has spurred domestic manufacturing, indirectly benefiting the pump industry.
Challenges Impacting APAC Positive Displacement Pumps Market Growth
Several challenges are impacting the growth trajectory of the APAC Positive Displacement Pumps market. Regulatory complexities, with varying standards and compliance requirements across different countries within the region, can hinder seamless market entry and product standardization. Supply chain issues, including the sourcing of raw materials and the timely delivery of finished products, continue to be a significant concern, often leading to extended lead times and increased costs. Competitive pressures from both established international players and rapidly growing local manufacturers can result in price wars and put pressure on profit margins. Furthermore, the upfront capital investment required for sophisticated positive displacement pump systems can be a deterrent for some small and medium-sized enterprises (SMEs) in certain developing economies.
Key Players Shaping the APAC Positive Displacement Pumps Market Market
- The Weir Group PLC
- Xylem Inc
- KSB SE & Co KGaA
- SPX Flow Inc
- NETZSCH Holding
- TSURUMI MANUFACTURING CO LTD
- Sulzer AG
- Pentair PLC
- Atlas Copco
- GRUNDFOS
Significant APAC Positive Displacement Pumps Market Industry Milestones
- February 2022: NETZSCH Pumps and Systems announced the expansion of its product portfolio with the launch of the PERIPRO peristaltic pump. This new model is available in chemical, industrial, and food versions, complementing the company's existing lines of NEMO progressing cavity pumps, NOTOS multi screw pumps, and TORNADO rotary lobe pumps. This launch signifies a strategic move to offer a broader range of pumping solutions catering to specific application needs and further solidifies NETZSCH's position in the peristaltic pump segment within APAC.
Future Outlook for APAC Positive Displacement Pumps Market Market
The future outlook for the APAC Positive Displacement Pumps market is exceptionally promising, driven by continued industrial expansion, increasing urbanization, and a global push towards more sustainable and efficient fluid management solutions. Strategic opportunities lie in catering to the growing demand for specialized pumps in sectors like pharmaceuticals and advanced materials, as well as the ongoing need for robust solutions in the energy and water treatment sectors. The market potential is further amplified by the adoption of Industry 4.0 technologies, leading to the development of smart pumps with enhanced connectivity and predictive maintenance capabilities. As regional economies continue to grow, the demand for high-performance and reliable positive displacement pumps is expected to surge, offering significant growth prospects for manufacturers and suppliers.
APAC Positive Displacement Pumps Market Segmentation
-
1. Type
- 1.1. Diaphragm
- 1.2. Piston
- 1.3. Gear
- 1.4. Lobe
- 1.5. Progressive Cavity
- 1.6. Screw
- 1.7. Vane
- 1.8. Peristaltic
-
2. End-user Industry
- 2.1. Oil & Gas
- 2.2. Chemicals
- 2.3. Food & Beverage
- 2.4. Waste & Wastewater
- 2.5. Pharmaceutical
- 2.6. Power
- 2.7. Other End-user Industries
APAC Positive Displacement Pumps Market Segmentation By Geography
-
1. North America
- 1.1. United States
- 1.2. Canada
- 1.3. Mexico
-
2. South America
- 2.1. Brazil
- 2.2. Argentina
- 2.3. Rest of South America
-
3. Europe
- 3.1. United Kingdom
- 3.2. Germany
- 3.3. France
- 3.4. Italy
- 3.5. Spain
- 3.6. Russia
- 3.7. Benelux
- 3.8. Nordics
- 3.9. Rest of Europe
-
4. Middle East & Africa
- 4.1. Turkey
- 4.2. Israel
- 4.3. GCC
- 4.4. North Africa
- 4.5. South Africa
- 4.6. Rest of Middle East & Africa
-
5. Asia Pacific
- 5.1. China
- 5.2. India
- 5.3. Japan
- 5.4. South Korea
- 5.5. ASEAN
- 5.6. Oceania
- 5.7. Rest of Asia Pacific
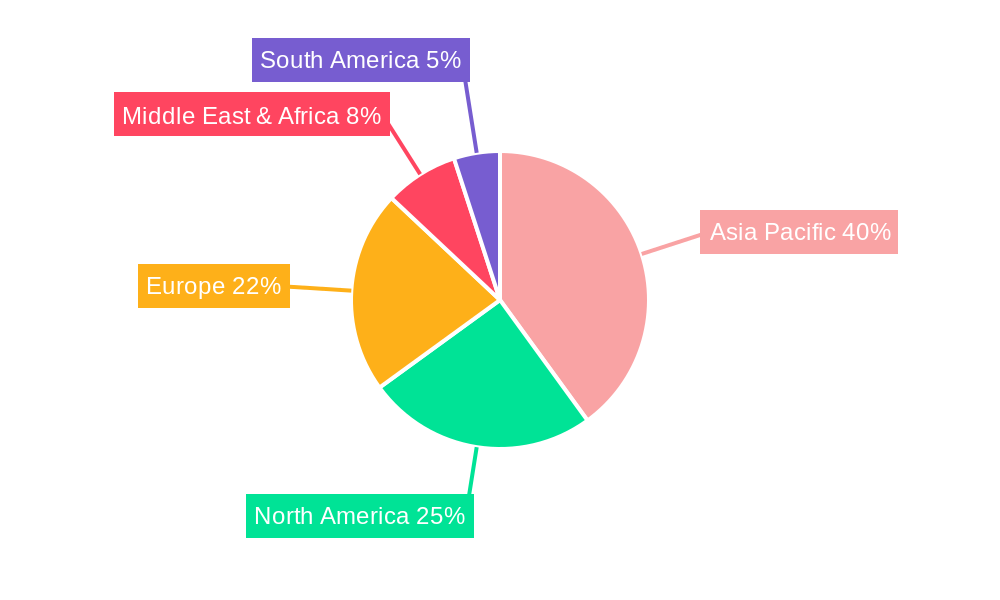
APAC Positive Displacement Pumps Market Regional Market Share
Geographic Coverage of APAC Positive Displacement Pumps Market
APAC Positive Displacement Pumps Market REPORT HIGHLIGHTS
| Aspects | Details |
|---|---|
| Study Period | 2020-2034 |
| Base Year | 2025 |
| Estimated Year | 2026 |
| Forecast Period | 2026-2034 |
| Historical Period | 2020-2025 |
| Growth Rate | CAGR of 5.4% from 2020-2034 |
| Segmentation |
|
Table of Contents
- 1. Introduction
- 1.1. Research Scope
- 1.2. Market Segmentation
- 1.3. Research Objective
- 1.4. Definitions and Assumptions
- 2. Executive Summary
- 2.1. Market Snapshot
- 3. Market Dynamics
- 3.1. Market Drivers
- 3.2. Market Restrains
- 3.3. Market Trends
- 3.4. Market Opportunities
- 4. Market Factor Analysis
- 4.1. Porters Five Forces
- 4.1.1. Bargaining Power of Suppliers
- 4.1.2. Bargaining Power of Buyers
- 4.1.3. Threat of New Entrants
- 4.1.4. Threat of Substitutes
- 4.1.5. Competitive Rivalry
- 4.2. PESTEL analysis
- 4.3. BCG Analysis
- 4.3.1. Stars (High Growth, High Market Share)
- 4.3.2. Cash Cows (Low Growth, High Market Share)
- 4.3.3. Question Mark (High Growth, Low Market Share)
- 4.3.4. Dogs (Low Growth, Low Market Share)
- 4.4. Ansoff Matrix Analysis
- 4.5. Supply Chain Analysis
- 4.6. Regulatory Landscape
- 4.7. Current Market Potential and Opportunity Assessment (TAM–SAM–SOM Framework)
- 4.8. TIR Analyst Note
- 4.1. Porters Five Forces
- 5. Market Analysis, Insights and Forecast 2021-2033
- 5.1. Market Analysis, Insights and Forecast - by Type
- 5.1.1. Diaphragm
- 5.1.2. Piston
- 5.1.3. Gear
- 5.1.4. Lobe
- 5.1.5. Progressive Cavity
- 5.1.6. Screw
- 5.1.7. Vane
- 5.1.8. Peristaltic
- 5.2. Market Analysis, Insights and Forecast - by End-user Industry
- 5.2.1. Oil & Gas
- 5.2.2. Chemicals
- 5.2.3. Food & Beverage
- 5.2.4. Waste & Wastewater
- 5.2.5. Pharmaceutical
- 5.2.6. Power
- 5.2.7. Other End-user Industries
- 5.3. Market Analysis, Insights and Forecast - by Region
- 5.3.1. North America
- 5.3.2. South America
- 5.3.3. Europe
- 5.3.4. Middle East & Africa
- 5.3.5. Asia Pacific
- 5.1. Market Analysis, Insights and Forecast - by Type
- 6. Global APAC Positive Displacement Pumps Market Analysis, Insights and Forecast, 2021-2033
- 6.1. Market Analysis, Insights and Forecast - by Type
- 6.1.1. Diaphragm
- 6.1.2. Piston
- 6.1.3. Gear
- 6.1.4. Lobe
- 6.1.5. Progressive Cavity
- 6.1.6. Screw
- 6.1.7. Vane
- 6.1.8. Peristaltic
- 6.2. Market Analysis, Insights and Forecast - by End-user Industry
- 6.2.1. Oil & Gas
- 6.2.2. Chemicals
- 6.2.3. Food & Beverage
- 6.2.4. Waste & Wastewater
- 6.2.5. Pharmaceutical
- 6.2.6. Power
- 6.2.7. Other End-user Industries
- 6.1. Market Analysis, Insights and Forecast - by Type
- 7. North America APAC Positive Displacement Pumps Market Analysis, Insights and Forecast, 2020-2032
- 7.1. Market Analysis, Insights and Forecast - by Type
- 7.1.1. Diaphragm
- 7.1.2. Piston
- 7.1.3. Gear
- 7.1.4. Lobe
- 7.1.5. Progressive Cavity
- 7.1.6. Screw
- 7.1.7. Vane
- 7.1.8. Peristaltic
- 7.2. Market Analysis, Insights and Forecast - by End-user Industry
- 7.2.1. Oil & Gas
- 7.2.2. Chemicals
- 7.2.3. Food & Beverage
- 7.2.4. Waste & Wastewater
- 7.2.5. Pharmaceutical
- 7.2.6. Power
- 7.2.7. Other End-user Industries
- 7.1. Market Analysis, Insights and Forecast - by Type
- 8. South America APAC Positive Displacement Pumps Market Analysis, Insights and Forecast, 2020-2032
- 8.1. Market Analysis, Insights and Forecast - by Type
- 8.1.1. Diaphragm
- 8.1.2. Piston
- 8.1.3. Gear
- 8.1.4. Lobe
- 8.1.5. Progressive Cavity
- 8.1.6. Screw
- 8.1.7. Vane
- 8.1.8. Peristaltic
- 8.2. Market Analysis, Insights and Forecast - by End-user Industry
- 8.2.1. Oil & Gas
- 8.2.2. Chemicals
- 8.2.3. Food & Beverage
- 8.2.4. Waste & Wastewater
- 8.2.5. Pharmaceutical
- 8.2.6. Power
- 8.2.7. Other End-user Industries
- 8.1. Market Analysis, Insights and Forecast - by Type
- 9. Europe APAC Positive Displacement Pumps Market Analysis, Insights and Forecast, 2020-2032
- 9.1. Market Analysis, Insights and Forecast - by Type
- 9.1.1. Diaphragm
- 9.1.2. Piston
- 9.1.3. Gear
- 9.1.4. Lobe
- 9.1.5. Progressive Cavity
- 9.1.6. Screw
- 9.1.7. Vane
- 9.1.8. Peristaltic
- 9.2. Market Analysis, Insights and Forecast - by End-user Industry
- 9.2.1. Oil & Gas
- 9.2.2. Chemicals
- 9.2.3. Food & Beverage
- 9.2.4. Waste & Wastewater
- 9.2.5. Pharmaceutical
- 9.2.6. Power
- 9.2.7. Other End-user Industries
- 9.1. Market Analysis, Insights and Forecast - by Type
- 10. Middle East & Africa APAC Positive Displacement Pumps Market Analysis, Insights and Forecast, 2020-2032
- 10.1. Market Analysis, Insights and Forecast - by Type
- 10.1.1. Diaphragm
- 10.1.2. Piston
- 10.1.3. Gear
- 10.1.4. Lobe
- 10.1.5. Progressive Cavity
- 10.1.6. Screw
- 10.1.7. Vane
- 10.1.8. Peristaltic
- 10.2. Market Analysis, Insights and Forecast - by End-user Industry
- 10.2.1. Oil & Gas
- 10.2.2. Chemicals
- 10.2.3. Food & Beverage
- 10.2.4. Waste & Wastewater
- 10.2.5. Pharmaceutical
- 10.2.6. Power
- 10.2.7. Other End-user Industries
- 10.1. Market Analysis, Insights and Forecast - by Type
- 11. Asia Pacific APAC Positive Displacement Pumps Market Analysis, Insights and Forecast, 2020-2032
- 11.1. Market Analysis, Insights and Forecast - by Type
- 11.1.1. Diaphragm
- 11.1.2. Piston
- 11.1.3. Gear
- 11.1.4. Lobe
- 11.1.5. Progressive Cavity
- 11.1.6. Screw
- 11.1.7. Vane
- 11.1.8. Peristaltic
- 11.2. Market Analysis, Insights and Forecast - by End-user Industry
- 11.2.1. Oil & Gas
- 11.2.2. Chemicals
- 11.2.3. Food & Beverage
- 11.2.4. Waste & Wastewater
- 11.2.5. Pharmaceutical
- 11.2.6. Power
- 11.2.7. Other End-user Industries
- 11.1. Market Analysis, Insights and Forecast - by Type
- 12. Competitive Analysis
- 12.1. Company Profiles
- 12.1.1 The Weir Group PLC
- 12.1.1.1. Company Overview
- 12.1.1.2. Products
- 12.1.1.3. Company Financials
- 12.1.1.4. SWOT Analysis
- 12.1.2 Xylem Inc
- 12.1.2.1. Company Overview
- 12.1.2.2. Products
- 12.1.2.3. Company Financials
- 12.1.2.4. SWOT Analysis
- 12.1.3 KSB SE & Co KGaA
- 12.1.3.1. Company Overview
- 12.1.3.2. Products
- 12.1.3.3. Company Financials
- 12.1.3.4. SWOT Analysis
- 12.1.4 SPX Flow Inc
- 12.1.4.1. Company Overview
- 12.1.4.2. Products
- 12.1.4.3. Company Financials
- 12.1.4.4. SWOT Analysis
- 12.1.5 NETZSCH Holding
- 12.1.5.1. Company Overview
- 12.1.5.2. Products
- 12.1.5.3. Company Financials
- 12.1.5.4. SWOT Analysis
- 12.1.6 TSURUMI MANUFACTURING CO LTD
- 12.1.6.1. Company Overview
- 12.1.6.2. Products
- 12.1.6.3. Company Financials
- 12.1.6.4. SWOT Analysis
- 12.1.7 Sulzer AG
- 12.1.7.1. Company Overview
- 12.1.7.2. Products
- 12.1.7.3. Company Financials
- 12.1.7.4. SWOT Analysis
- 12.1.8 Pentair PLC
- 12.1.8.1. Company Overview
- 12.1.8.2. Products
- 12.1.8.3. Company Financials
- 12.1.8.4. SWOT Analysis
- 12.1.9 Atlas Copco
- 12.1.9.1. Company Overview
- 12.1.9.2. Products
- 12.1.9.3. Company Financials
- 12.1.9.4. SWOT Analysis
- 12.1.10 GRUNDFOS
- 12.1.10.1. Company Overview
- 12.1.10.2. Products
- 12.1.10.3. Company Financials
- 12.1.10.4. SWOT Analysis
- 12.1.1 The Weir Group PLC
- 12.2. Market Entropy
- 12.2.1 Company's Key Areas Served
- 12.2.2 Recent Developments
- 12.3. Company Market Share Analysis 2025
- 12.3.1 Top 5 Companies Market Share Analysis
- 12.3.2 Top 3 Companies Market Share Analysis
- 12.4. List of Potential Customers
- 13. Research Methodology
List of Figures
- Figure 1: Global APAC Positive Displacement Pumps Market Revenue Breakdown (million, %) by Region 2025 & 2033
- Figure 2: Global APAC Positive Displacement Pumps Market Volume Breakdown (K Unit, %) by Region 2025 & 2033
- Figure 3: North America APAC Positive Displacement Pumps Market Revenue (million), by Type 2025 & 2033
- Figure 4: North America APAC Positive Displacement Pumps Market Volume (K Unit), by Type 2025 & 2033
- Figure 5: North America APAC Positive Displacement Pumps Market Revenue Share (%), by Type 2025 & 2033
- Figure 6: North America APAC Positive Displacement Pumps Market Volume Share (%), by Type 2025 & 2033
- Figure 7: North America APAC Positive Displacement Pumps Market Revenue (million), by End-user Industry 2025 & 2033
- Figure 8: North America APAC Positive Displacement Pumps Market Volume (K Unit), by End-user Industry 2025 & 2033
- Figure 9: North America APAC Positive Displacement Pumps Market Revenue Share (%), by End-user Industry 2025 & 2033
- Figure 10: North America APAC Positive Displacement Pumps Market Volume Share (%), by End-user Industry 2025 & 2033
- Figure 11: North America APAC Positive Displacement Pumps Market Revenue (million), by Country 2025 & 2033
- Figure 12: North America APAC Positive Displacement Pumps Market Volume (K Unit), by Country 2025 & 2033
- Figure 13: North America APAC Positive Displacement Pumps Market Revenue Share (%), by Country 2025 & 2033
- Figure 14: North America APAC Positive Displacement Pumps Market Volume Share (%), by Country 2025 & 2033
- Figure 15: South America APAC Positive Displacement Pumps Market Revenue (million), by Type 2025 & 2033
- Figure 16: South America APAC Positive Displacement Pumps Market Volume (K Unit), by Type 2025 & 2033
- Figure 17: South America APAC Positive Displacement Pumps Market Revenue Share (%), by Type 2025 & 2033
- Figure 18: South America APAC Positive Displacement Pumps Market Volume Share (%), by Type 2025 & 2033
- Figure 19: South America APAC Positive Displacement Pumps Market Revenue (million), by End-user Industry 2025 & 2033
- Figure 20: South America APAC Positive Displacement Pumps Market Volume (K Unit), by End-user Industry 2025 & 2033
- Figure 21: South America APAC Positive Displacement Pumps Market Revenue Share (%), by End-user Industry 2025 & 2033
- Figure 22: South America APAC Positive Displacement Pumps Market Volume Share (%), by End-user Industry 2025 & 2033
- Figure 23: South America APAC Positive Displacement Pumps Market Revenue (million), by Country 2025 & 2033
- Figure 24: South America APAC Positive Displacement Pumps Market Volume (K Unit), by Country 2025 & 2033
- Figure 25: South America APAC Positive Displacement Pumps Market Revenue Share (%), by Country 2025 & 2033
- Figure 26: South America APAC Positive Displacement Pumps Market Volume Share (%), by Country 2025 & 2033
- Figure 27: Europe APAC Positive Displacement Pumps Market Revenue (million), by Type 2025 & 2033
- Figure 28: Europe APAC Positive Displacement Pumps Market Volume (K Unit), by Type 2025 & 2033
- Figure 29: Europe APAC Positive Displacement Pumps Market Revenue Share (%), by Type 2025 & 2033
- Figure 30: Europe APAC Positive Displacement Pumps Market Volume Share (%), by Type 2025 & 2033
- Figure 31: Europe APAC Positive Displacement Pumps Market Revenue (million), by End-user Industry 2025 & 2033
- Figure 32: Europe APAC Positive Displacement Pumps Market Volume (K Unit), by End-user Industry 2025 & 2033
- Figure 33: Europe APAC Positive Displacement Pumps Market Revenue Share (%), by End-user Industry 2025 & 2033
- Figure 34: Europe APAC Positive Displacement Pumps Market Volume Share (%), by End-user Industry 2025 & 2033
- Figure 35: Europe APAC Positive Displacement Pumps Market Revenue (million), by Country 2025 & 2033
- Figure 36: Europe APAC Positive Displacement Pumps Market Volume (K Unit), by Country 2025 & 2033
- Figure 37: Europe APAC Positive Displacement Pumps Market Revenue Share (%), by Country 2025 & 2033
- Figure 38: Europe APAC Positive Displacement Pumps Market Volume Share (%), by Country 2025 & 2033
- Figure 39: Middle East & Africa APAC Positive Displacement Pumps Market Revenue (million), by Type 2025 & 2033
- Figure 40: Middle East & Africa APAC Positive Displacement Pumps Market Volume (K Unit), by Type 2025 & 2033
- Figure 41: Middle East & Africa APAC Positive Displacement Pumps Market Revenue Share (%), by Type 2025 & 2033
- Figure 42: Middle East & Africa APAC Positive Displacement Pumps Market Volume Share (%), by Type 2025 & 2033
- Figure 43: Middle East & Africa APAC Positive Displacement Pumps Market Revenue (million), by End-user Industry 2025 & 2033
- Figure 44: Middle East & Africa APAC Positive Displacement Pumps Market Volume (K Unit), by End-user Industry 2025 & 2033
- Figure 45: Middle East & Africa APAC Positive Displacement Pumps Market Revenue Share (%), by End-user Industry 2025 & 2033
- Figure 46: Middle East & Africa APAC Positive Displacement Pumps Market Volume Share (%), by End-user Industry 2025 & 2033
- Figure 47: Middle East & Africa APAC Positive Displacement Pumps Market Revenue (million), by Country 2025 & 2033
- Figure 48: Middle East & Africa APAC Positive Displacement Pumps Market Volume (K Unit), by Country 2025 & 2033
- Figure 49: Middle East & Africa APAC Positive Displacement Pumps Market Revenue Share (%), by Country 2025 & 2033
- Figure 50: Middle East & Africa APAC Positive Displacement Pumps Market Volume Share (%), by Country 2025 & 2033
- Figure 51: Asia Pacific APAC Positive Displacement Pumps Market Revenue (million), by Type 2025 & 2033
- Figure 52: Asia Pacific APAC Positive Displacement Pumps Market Volume (K Unit), by Type 2025 & 2033
- Figure 53: Asia Pacific APAC Positive Displacement Pumps Market Revenue Share (%), by Type 2025 & 2033
- Figure 54: Asia Pacific APAC Positive Displacement Pumps Market Volume Share (%), by Type 2025 & 2033
- Figure 55: Asia Pacific APAC Positive Displacement Pumps Market Revenue (million), by End-user Industry 2025 & 2033
- Figure 56: Asia Pacific APAC Positive Displacement Pumps Market Volume (K Unit), by End-user Industry 2025 & 2033
- Figure 57: Asia Pacific APAC Positive Displacement Pumps Market Revenue Share (%), by End-user Industry 2025 & 2033
- Figure 58: Asia Pacific APAC Positive Displacement Pumps Market Volume Share (%), by End-user Industry 2025 & 2033
- Figure 59: Asia Pacific APAC Positive Displacement Pumps Market Revenue (million), by Country 2025 & 2033
- Figure 60: Asia Pacific APAC Positive Displacement Pumps Market Volume (K Unit), by Country 2025 & 2033
- Figure 61: Asia Pacific APAC Positive Displacement Pumps Market Revenue Share (%), by Country 2025 & 2033
- Figure 62: Asia Pacific APAC Positive Displacement Pumps Market Volume Share (%), by Country 2025 & 2033
List of Tables
- Table 1: Global APAC Positive Displacement Pumps Market Revenue million Forecast, by Type 2020 & 2033
- Table 2: Global APAC Positive Displacement Pumps Market Volume K Unit Forecast, by Type 2020 & 2033
- Table 3: Global APAC Positive Displacement Pumps Market Revenue million Forecast, by End-user Industry 2020 & 2033
- Table 4: Global APAC Positive Displacement Pumps Market Volume K Unit Forecast, by End-user Industry 2020 & 2033
- Table 5: Global APAC Positive Displacement Pumps Market Revenue million Forecast, by Region 2020 & 2033
- Table 6: Global APAC Positive Displacement Pumps Market Volume K Unit Forecast, by Region 2020 & 2033
- Table 7: Global APAC Positive Displacement Pumps Market Revenue million Forecast, by Type 2020 & 2033
- Table 8: Global APAC Positive Displacement Pumps Market Volume K Unit Forecast, by Type 2020 & 2033
- Table 9: Global APAC Positive Displacement Pumps Market Revenue million Forecast, by End-user Industry 2020 & 2033
- Table 10: Global APAC Positive Displacement Pumps Market Volume K Unit Forecast, by End-user Industry 2020 & 2033
- Table 11: Global APAC Positive Displacement Pumps Market Revenue million Forecast, by Country 2020 & 2033
- Table 12: Global APAC Positive Displacement Pumps Market Volume K Unit Forecast, by Country 2020 & 2033
- Table 13: United States APAC Positive Displacement Pumps Market Revenue (million) Forecast, by Application 2020 & 2033
- Table 14: United States APAC Positive Displacement Pumps Market Volume (K Unit) Forecast, by Application 2020 & 2033
- Table 15: Canada APAC Positive Displacement Pumps Market Revenue (million) Forecast, by Application 2020 & 2033
- Table 16: Canada APAC Positive Displacement Pumps Market Volume (K Unit) Forecast, by Application 2020 & 2033
- Table 17: Mexico APAC Positive Displacement Pumps Market Revenue (million) Forecast, by Application 2020 & 2033
- Table 18: Mexico APAC Positive Displacement Pumps Market Volume (K Unit) Forecast, by Application 2020 & 2033
- Table 19: Global APAC Positive Displacement Pumps Market Revenue million Forecast, by Type 2020 & 2033
- Table 20: Global APAC Positive Displacement Pumps Market Volume K Unit Forecast, by Type 2020 & 2033
- Table 21: Global APAC Positive Displacement Pumps Market Revenue million Forecast, by End-user Industry 2020 & 2033
- Table 22: Global APAC Positive Displacement Pumps Market Volume K Unit Forecast, by End-user Industry 2020 & 2033
- Table 23: Global APAC Positive Displacement Pumps Market Revenue million Forecast, by Country 2020 & 2033
- Table 24: Global APAC Positive Displacement Pumps Market Volume K Unit Forecast, by Country 2020 & 2033
- Table 25: Brazil APAC Positive Displacement Pumps Market Revenue (million) Forecast, by Application 2020 & 2033
- Table 26: Brazil APAC Positive Displacement Pumps Market Volume (K Unit) Forecast, by Application 2020 & 2033
- Table 27: Argentina APAC Positive Displacement Pumps Market Revenue (million) Forecast, by Application 2020 & 2033
- Table 28: Argentina APAC Positive Displacement Pumps Market Volume (K Unit) Forecast, by Application 2020 & 2033
- Table 29: Rest of South America APAC Positive Displacement Pumps Market Revenue (million) Forecast, by Application 2020 & 2033
- Table 30: Rest of South America APAC Positive Displacement Pumps Market Volume (K Unit) Forecast, by Application 2020 & 2033
- Table 31: Global APAC Positive Displacement Pumps Market Revenue million Forecast, by Type 2020 & 2033
- Table 32: Global APAC Positive Displacement Pumps Market Volume K Unit Forecast, by Type 2020 & 2033
- Table 33: Global APAC Positive Displacement Pumps Market Revenue million Forecast, by End-user Industry 2020 & 2033
- Table 34: Global APAC Positive Displacement Pumps Market Volume K Unit Forecast, by End-user Industry 2020 & 2033
- Table 35: Global APAC Positive Displacement Pumps Market Revenue million Forecast, by Country 2020 & 2033
- Table 36: Global APAC Positive Displacement Pumps Market Volume K Unit Forecast, by Country 2020 & 2033
- Table 37: United Kingdom APAC Positive Displacement Pumps Market Revenue (million) Forecast, by Application 2020 & 2033
- Table 38: United Kingdom APAC Positive Displacement Pumps Market Volume (K Unit) Forecast, by Application 2020 & 2033
- Table 39: Germany APAC Positive Displacement Pumps Market Revenue (million) Forecast, by Application 2020 & 2033
- Table 40: Germany APAC Positive Displacement Pumps Market Volume (K Unit) Forecast, by Application 2020 & 2033
- Table 41: France APAC Positive Displacement Pumps Market Revenue (million) Forecast, by Application 2020 & 2033
- Table 42: France APAC Positive Displacement Pumps Market Volume (K Unit) Forecast, by Application 2020 & 2033
- Table 43: Italy APAC Positive Displacement Pumps Market Revenue (million) Forecast, by Application 2020 & 2033
- Table 44: Italy APAC Positive Displacement Pumps Market Volume (K Unit) Forecast, by Application 2020 & 2033
- Table 45: Spain APAC Positive Displacement Pumps Market Revenue (million) Forecast, by Application 2020 & 2033
- Table 46: Spain APAC Positive Displacement Pumps Market Volume (K Unit) Forecast, by Application 2020 & 2033
- Table 47: Russia APAC Positive Displacement Pumps Market Revenue (million) Forecast, by Application 2020 & 2033
- Table 48: Russia APAC Positive Displacement Pumps Market Volume (K Unit) Forecast, by Application 2020 & 2033
- Table 49: Benelux APAC Positive Displacement Pumps Market Revenue (million) Forecast, by Application 2020 & 2033
- Table 50: Benelux APAC Positive Displacement Pumps Market Volume (K Unit) Forecast, by Application 2020 & 2033
- Table 51: Nordics APAC Positive Displacement Pumps Market Revenue (million) Forecast, by Application 2020 & 2033
- Table 52: Nordics APAC Positive Displacement Pumps Market Volume (K Unit) Forecast, by Application 2020 & 2033
- Table 53: Rest of Europe APAC Positive Displacement Pumps Market Revenue (million) Forecast, by Application 2020 & 2033
- Table 54: Rest of Europe APAC Positive Displacement Pumps Market Volume (K Unit) Forecast, by Application 2020 & 2033
- Table 55: Global APAC Positive Displacement Pumps Market Revenue million Forecast, by Type 2020 & 2033
- Table 56: Global APAC Positive Displacement Pumps Market Volume K Unit Forecast, by Type 2020 & 2033
- Table 57: Global APAC Positive Displacement Pumps Market Revenue million Forecast, by End-user Industry 2020 & 2033
- Table 58: Global APAC Positive Displacement Pumps Market Volume K Unit Forecast, by End-user Industry 2020 & 2033
- Table 59: Global APAC Positive Displacement Pumps Market Revenue million Forecast, by Country 2020 & 2033
- Table 60: Global APAC Positive Displacement Pumps Market Volume K Unit Forecast, by Country 2020 & 2033
- Table 61: Turkey APAC Positive Displacement Pumps Market Revenue (million) Forecast, by Application 2020 & 2033
- Table 62: Turkey APAC Positive Displacement Pumps Market Volume (K Unit) Forecast, by Application 2020 & 2033
- Table 63: Israel APAC Positive Displacement Pumps Market Revenue (million) Forecast, by Application 2020 & 2033
- Table 64: Israel APAC Positive Displacement Pumps Market Volume (K Unit) Forecast, by Application 2020 & 2033
- Table 65: GCC APAC Positive Displacement Pumps Market Revenue (million) Forecast, by Application 2020 & 2033
- Table 66: GCC APAC Positive Displacement Pumps Market Volume (K Unit) Forecast, by Application 2020 & 2033
- Table 67: North Africa APAC Positive Displacement Pumps Market Revenue (million) Forecast, by Application 2020 & 2033
- Table 68: North Africa APAC Positive Displacement Pumps Market Volume (K Unit) Forecast, by Application 2020 & 2033
- Table 69: South Africa APAC Positive Displacement Pumps Market Revenue (million) Forecast, by Application 2020 & 2033
- Table 70: South Africa APAC Positive Displacement Pumps Market Volume (K Unit) Forecast, by Application 2020 & 2033
- Table 71: Rest of Middle East & Africa APAC Positive Displacement Pumps Market Revenue (million) Forecast, by Application 2020 & 2033
- Table 72: Rest of Middle East & Africa APAC Positive Displacement Pumps Market Volume (K Unit) Forecast, by Application 2020 & 2033
- Table 73: Global APAC Positive Displacement Pumps Market Revenue million Forecast, by Type 2020 & 2033
- Table 74: Global APAC Positive Displacement Pumps Market Volume K Unit Forecast, by Type 2020 & 2033
- Table 75: Global APAC Positive Displacement Pumps Market Revenue million Forecast, by End-user Industry 2020 & 2033
- Table 76: Global APAC Positive Displacement Pumps Market Volume K Unit Forecast, by End-user Industry 2020 & 2033
- Table 77: Global APAC Positive Displacement Pumps Market Revenue million Forecast, by Country 2020 & 2033
- Table 78: Global APAC Positive Displacement Pumps Market Volume K Unit Forecast, by Country 2020 & 2033
- Table 79: China APAC Positive Displacement Pumps Market Revenue (million) Forecast, by Application 2020 & 2033
- Table 80: China APAC Positive Displacement Pumps Market Volume (K Unit) Forecast, by Application 2020 & 2033
- Table 81: India APAC Positive Displacement Pumps Market Revenue (million) Forecast, by Application 2020 & 2033
- Table 82: India APAC Positive Displacement Pumps Market Volume (K Unit) Forecast, by Application 2020 & 2033
- Table 83: Japan APAC Positive Displacement Pumps Market Revenue (million) Forecast, by Application 2020 & 2033
- Table 84: Japan APAC Positive Displacement Pumps Market Volume (K Unit) Forecast, by Application 2020 & 2033
- Table 85: South Korea APAC Positive Displacement Pumps Market Revenue (million) Forecast, by Application 2020 & 2033
- Table 86: South Korea APAC Positive Displacement Pumps Market Volume (K Unit) Forecast, by Application 2020 & 2033
- Table 87: ASEAN APAC Positive Displacement Pumps Market Revenue (million) Forecast, by Application 2020 & 2033
- Table 88: ASEAN APAC Positive Displacement Pumps Market Volume (K Unit) Forecast, by Application 2020 & 2033
- Table 89: Oceania APAC Positive Displacement Pumps Market Revenue (million) Forecast, by Application 2020 & 2033
- Table 90: Oceania APAC Positive Displacement Pumps Market Volume (K Unit) Forecast, by Application 2020 & 2033
- Table 91: Rest of Asia Pacific APAC Positive Displacement Pumps Market Revenue (million) Forecast, by Application 2020 & 2033
- Table 92: Rest of Asia Pacific APAC Positive Displacement Pumps Market Volume (K Unit) Forecast, by Application 2020 & 2033
Frequently Asked Questions
1. What is the projected Compound Annual Growth Rate (CAGR) of the APAC Positive Displacement Pumps Market?
The projected CAGR is approximately 5.4%.
2. Which companies are prominent players in the APAC Positive Displacement Pumps Market?
Key companies in the market include The Weir Group PLC, Xylem Inc, KSB SE & Co KGaA, SPX Flow Inc, NETZSCH Holding, TSURUMI MANUFACTURING CO LTD , Sulzer AG, Pentair PLC, Atlas Copco, GRUNDFOS.
3. What are the main segments of the APAC Positive Displacement Pumps Market?
The market segments include Type, End-user Industry.
4. Can you provide details about the market size?
The market size is estimated to be USD 20721.9 million as of 2022.
5. What are some drivers contributing to market growth?
Increased Focus on Wastewater Management.
6. What are the notable trends driving market growth?
Waste and Wastewater Industry is Expected to Register Significant Growth.
7. Are there any restraints impacting market growth?
Environmental and Safe Use Concerns.
8. Can you provide examples of recent developments in the market?
February 2022 - NETZSCH Pumps and Systems announced the expansion of its product portfolio with the launch of the PERIPRO peristaltic pump. The pump model is available in chemical, industrial, and food versions. Moreover, the newly launched product complements the company's well-known technologies of NEMO progressing cavity pumps, NOTOS multi screw pumps, and TORNADO rotary lobe pumps.
9. What pricing options are available for accessing the report?
Pricing options include single-user, multi-user, and enterprise licenses priced at USD 4750, USD 4950, and USD 6800 respectively.
10. Is the market size provided in terms of value or volume?
The market size is provided in terms of value, measured in million and volume, measured in K Unit.
11. Are there any specific market keywords associated with the report?
Yes, the market keyword associated with the report is "APAC Positive Displacement Pumps Market," which aids in identifying and referencing the specific market segment covered.
12. How do I determine which pricing option suits my needs best?
The pricing options vary based on user requirements and access needs. Individual users may opt for single-user licenses, while businesses requiring broader access may choose multi-user or enterprise licenses for cost-effective access to the report.
13. Are there any additional resources or data provided in the APAC Positive Displacement Pumps Market report?
While the report offers comprehensive insights, it's advisable to review the specific contents or supplementary materials provided to ascertain if additional resources or data are available.
14. How can I stay updated on further developments or reports in the APAC Positive Displacement Pumps Market?
To stay informed about further developments, trends, and reports in the APAC Positive Displacement Pumps Market, consider subscribing to industry newsletters, following relevant companies and organizations, or regularly checking reputable industry news sources and publications.
Methodology
Step 1 - Identification of Relevant Samples Size from Population Database


Step 2 - Approaches for Defining Global Market Size (Value, Volume* & Price*)

Note*: In applicable scenarios
Step 3 - Data Sources
Primary Research
- Web Analytics
- Survey Reports
- Research Institute
- Latest Research Reports
- Opinion Leaders
Secondary Research
- Annual Reports
- White Paper
- Latest Press Release
- Industry Association
- Paid Database
- Investor Presentations

Step 4 - Data Triangulation
Involves using different sources of information in order to increase the validity of a study
These sources are likely to be stakeholders in a program - participants, other researchers, program staff, other community members, and so on.
Then we put all data in single framework & apply various statistical tools to find out the dynamic on the market.
During the analysis stage, feedback from the stakeholder groups would be compared to determine areas of agreement as well as areas of divergence