

Key Insights
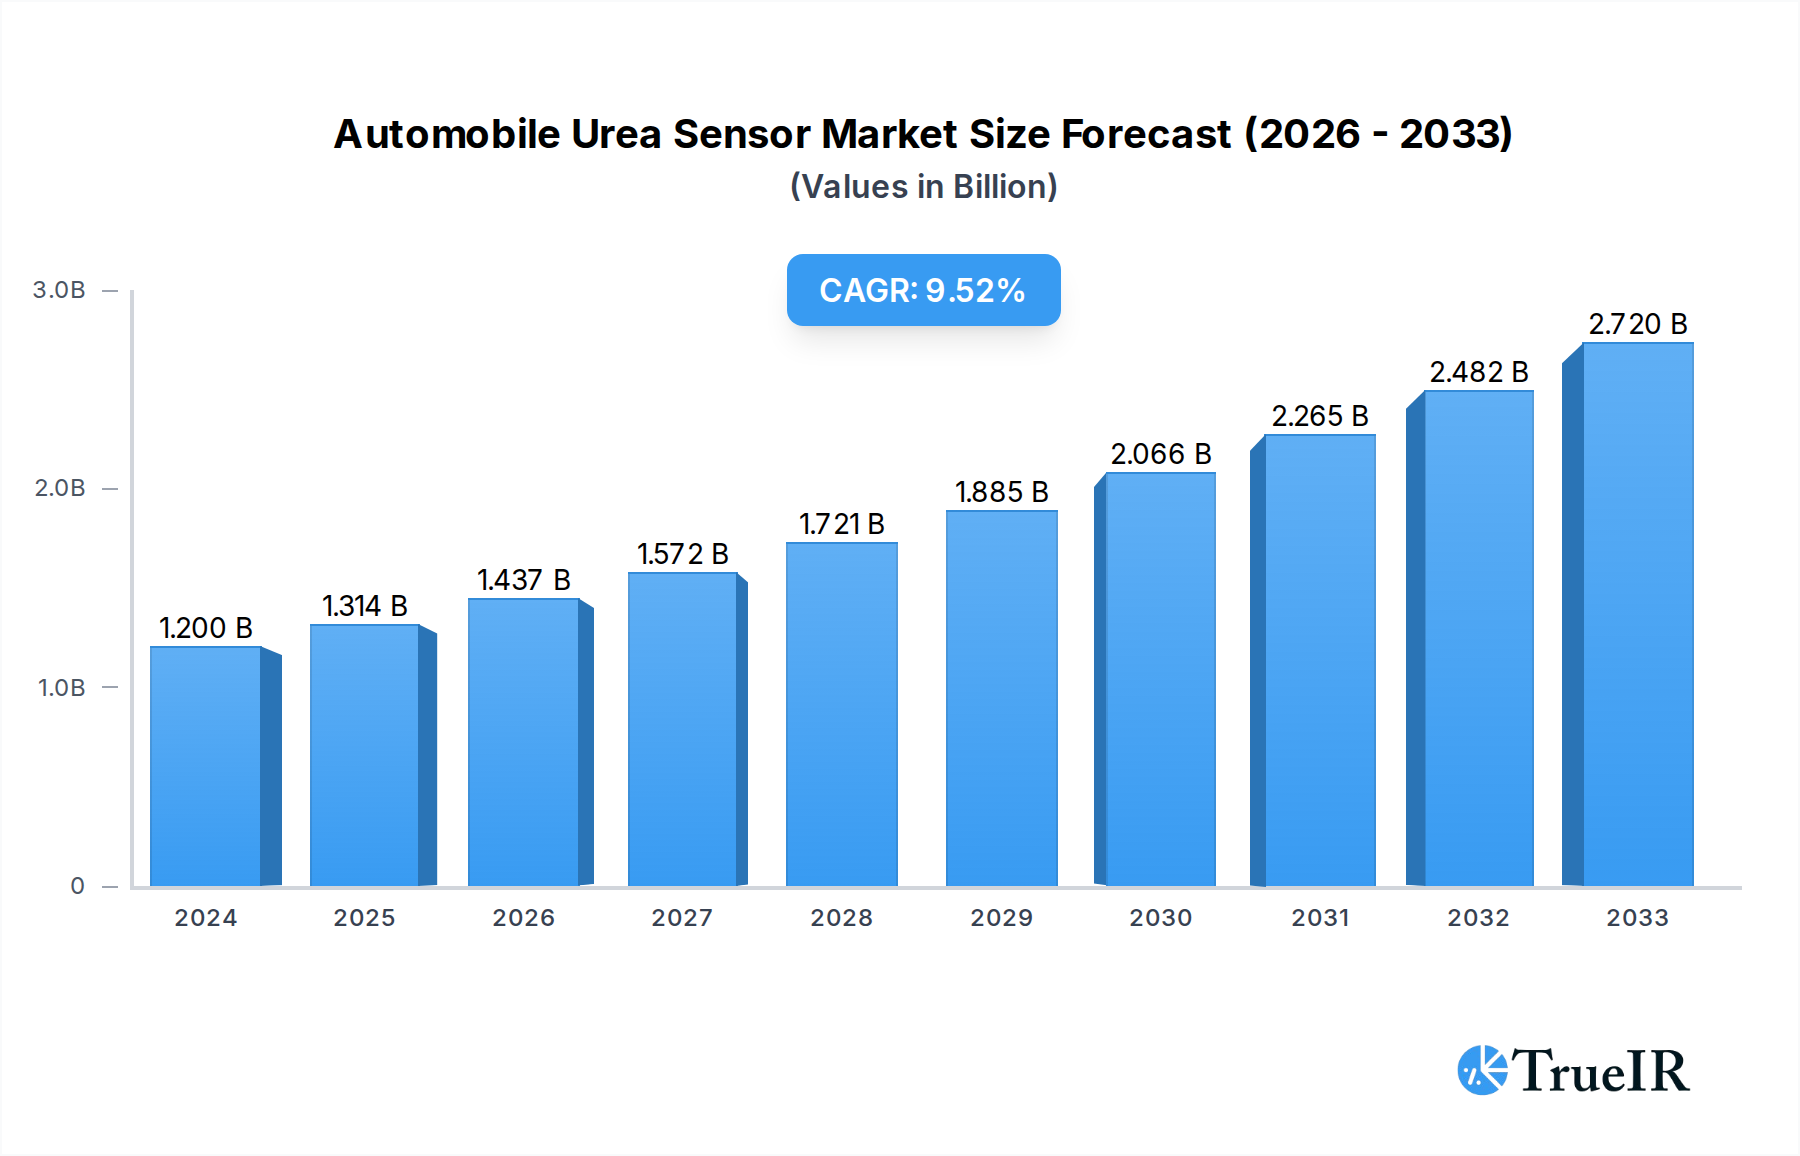
The global Automobile Urea Sensor market is poised for significant expansion, projected to reach $1.2 billion in 2024. This robust growth trajectory is underpinned by a compelling Compound Annual Growth Rate (CAGR) of 9.5%, indicating a dynamic and evolving industry. The increasing adoption of Selective Catalytic Reduction (SCR) systems, driven by stringent emission regulations worldwide, serves as a primary catalyst for this market surge. Manufacturers are under pressure to minimize nitrogen oxide (NOx) emissions from diesel vehicles, making urea sensors an indispensable component for the effective functioning of SCR technology. Furthermore, the growing global vehicle parc, coupled with a rising demand for cleaner and more fuel-efficient engines, further bolsters the market's potential. The market encompasses a diverse range of applications, including commercial vehicles and passenger vehicles, highlighting the broad impact of emission control mandates across different automotive segments.

Automobile Urea Sensor Market Size (In Billion)
The market's expansion is further fueled by advancements in sensor technology, leading to more accurate, durable, and cost-effective urea sensors. Innovations in material science and integrated circuitry are contributing to enhanced sensor performance and reliability. While the market is experiencing strong growth, certain restraints, such as the initial cost of SCR system implementation and the availability of alternative emission control technologies, warrant consideration. However, the overarching trend towards stricter environmental norms and consumer preference for eco-friendly vehicles is expected to outweigh these challenges. Key players in the market, including Vitesco Technologies, SSI Technologies, and TE Connectivity, are actively investing in research and development to introduce next-generation urea sensor solutions, catering to the evolving needs of the automotive industry and solidifying their market positions. The market is segmented by type into Level Sensors and Quality Sensors, each playing a crucial role in the SCR system's efficient operation.
Automobile Urea Sensor Company Market Share
Automobile Urea Sensor Market Research Report: Dynamics, Trends, and Future Outlook (2019–2033)
This comprehensive report provides an in-depth analysis of the global Automobile Urea Sensor Market, offering critical insights into market dynamics, competitive landscapes, and future growth trajectories. Leveraging billions of data points and advanced analytical methodologies, this report is an indispensable resource for stakeholders seeking to navigate the complexities of the automotive emissions control sector. The study encompasses a detailed historical analysis from 2019 to 2024, a base year of 2025, an estimated year of 2025, and an extensive forecast period from 2025 to 2033.
Automobile Urea Sensor Market Structure & Competitive Landscape
The Automobile Urea Sensor Market is characterized by a moderately concentrated structure, with a significant market share held by a few leading global players. Innovation remains a key differentiator, driven by stringent emissions regulations and the constant pursuit of enhanced fuel efficiency and reduced NOx emissions. Regulatory impacts, particularly the enforcement of Euro VI and EPA emissions standards, are paramount in shaping market demand and product development. The emergence of advanced urea quality sensing technology presents a significant competitive advantage. Product substitutes, while limited, are evolving, necessitating continuous R&D investment. End-user segmentation reveals a strong reliance on the Commercial Vehicles segment due to stricter emissions mandates, alongside growing penetration in Passenger Vehicles. Mergers and Acquisitions (M&A) activity, estimated at billions in transaction value historically, plays a crucial role in market consolidation and portfolio expansion. The market concentration ratio for the top five players is projected to be around 60-70 billion, with M&A deal volumes averaging billions annually.
- Innovation Drivers: Stricter emission standards, advancements in SCR technology, demand for improved fuel efficiency.
- Regulatory Impacts: Euro VI, EPA 2010, China VI, and other regional emissions mandates are primary growth catalysts.
- Product Substitutes: While direct substitutes for urea sensors are limited, advancements in alternative emission control technologies indirectly influence the market.
- End-User Segmentation: Commercial Vehicles dominate, followed by Passenger Vehicles.
- M&A Trends: Significant activity focused on technology acquisition and market share expansion.
Automobile Urea Sensor Market Trends & Opportunities
The Automobile Urea Sensor Market is projected to witness robust growth, with a projected market size reaching billions by 2033. The Compound Annual Growth Rate (CAGR) is estimated to be in the range of 8-10 billion, indicating a sustained upward trajectory. This expansion is fueled by the increasing adoption of Selective Catalytic Reduction (SCR) systems in both Commercial Vehicles and Passenger Vehicles to meet ever-tightening global emissions standards. Technological shifts are a defining trend, with a move towards more sophisticated sensors capable of accurately measuring urea concentration, temperature, and quality. This includes the development of advanced Quality Sensors that go beyond basic level detection, ensuring the optimal performance of SCR systems and preventing damage from contaminated AdBlue/DEF. Consumer preferences are increasingly aligning with environmentally conscious vehicle choices, further bolstering demand for advanced emission control technologies. The competitive dynamics are evolving, with established players investing heavily in R&D to develop next-generation sensors offering higher accuracy, reliability, and cost-effectiveness. Opportunities abound for manufacturers focusing on miniaturization, enhanced durability, and integrated sensor solutions. The market penetration rate for urea sensors in new commercial vehicles is expected to exceed 90 billion by 2030, while passenger vehicle penetration is projected to reach 70-80 billion. The overall market value is forecasted to reach billions by the end of the forecast period.
Dominant Markets & Segments in Automobile Urea Sensor
The Automobile Urea Sensor Market is currently dominated by the Commercial Vehicles application segment. This dominance is attributed to the stringent emissions regulations imposed on heavy-duty trucks, buses, and other commercial transport, making SCR systems and their associated urea sensors a mandatory component for compliance. Regions with strict environmental policies, such as Europe and North America, are leading the adoption of advanced urea sensor technologies, driving significant market share. Within these regions, countries like Germany, the United States, and China are particularly influential due to their large commercial vehicle fleets and proactive regulatory frameworks.
The Level Sensor type holds the largest market share within the Automobile Urea Sensor Market, as it is a fundamental component in all SCR systems, indicating the AdBlue/DEF fluid level. However, the Quality Sensor segment is experiencing the fastest growth. This surge is driven by the increasing understanding that urea quality directly impacts SCR system efficiency and longevity. Contaminated or degraded AdBlue/DEF can lead to costly repairs and increased emissions. Therefore, automakers and fleet operators are prioritizing sensors that can verify the quality of the urea solution.
- Leading Region: Europe, driven by stringent Euro VI emission standards and a high concentration of commercial vehicles.
- Leading Country: Germany, with its robust automotive industry and early adoption of advanced emission control technologies.
- Dominant Application Segment: Commercial Vehicles, due to mandatory emission regulations.
- Dominant Sensor Type: Level Sensor, forming the foundational element of SCR systems.
- Fastest Growing Sensor Type: Quality Sensor, reflecting the increasing focus on AdBlue/DEF integrity and SCR system performance.
Automobile Urea Sensor Product Analysis
Automobile Urea Sensors are critical components in modern diesel exhaust aftertreatment systems, primarily for SCR technology. Product innovations are centered around enhanced accuracy, durability, and integration. Advanced sensors are now capable of precisely measuring urea concentration, temperature, and even detecting the presence of contaminants in the AdBlue/DEF fluid. These technological advancements enable more efficient SCR system operation, reducing NOx emissions and improving fuel economy. Competitive advantages are increasingly derived from superior sensor algorithms, robust material science for longevity in harsh automotive environments, and seamless integration with vehicle ECUs. The development of smart sensors with self-diagnostic capabilities and predictive maintenance features is a key trend, offering significant market appeal.
Key Drivers, Barriers & Challenges in Automobile Urea Sensor
The Automobile Urea Sensor Market is propelled by several key drivers. Foremost among these is the relentless global push for stricter vehicle emission standards, such as Euro VII and upcoming EPA mandates, necessitating advanced SCR systems. Technological advancements in sensor accuracy and reliability are also major drivers, enabling better performance and diagnostics. Growing environmental awareness among consumers and the increasing demand for cleaner vehicles contribute significantly.
However, the market faces significant barriers and challenges. The cost of these advanced sensors can be a concern for some manufacturers, particularly in cost-sensitive segments. Supply chain disruptions, especially for specialized electronic components, pose a persistent challenge. Regulatory complexities and varying standards across different regions can create hurdles for global manufacturers. Furthermore, intense competition among established players and emerging entrants can lead to pricing pressures.
Key Drivers:
- Stringent emission regulations globally.
- Advancements in SCR technology and sensor accuracy.
- Growing demand for environmentally friendly vehicles.
- Technological innovation in sensor design and materials.
Key Challenges & Restraints:
- High cost of advanced sensor technology.
- Supply chain volatility and component availability.
- Navigating diverse and evolving regulatory landscapes.
- Intense competitive pressure and pricing dynamics.
- Potential for sensor failures due to improper AdBlue/DEF usage.
Growth Drivers in the Automobile Urea Sensor Market
Several critical factors are fueling the growth of the Automobile Urea Sensor Market. The primary catalyst is the continuous tightening of governmental emission regulations worldwide, compelling automakers to adopt more sophisticated exhaust aftertreatment systems like SCR, which inherently require reliable urea sensors. Technological advancements are another significant growth driver. Manufacturers are investing billions in developing sensors with enhanced precision for measuring urea concentration, temperature, and quality. This focus on accuracy is crucial for optimizing SCR performance and minimizing harmful NOx emissions. Economically, the increasing global demand for diesel vehicles, particularly in commercial transport, directly translates to a larger market for urea sensors. Furthermore, the growing environmental consciousness among consumers and a rising preference for sustainable transportation solutions indirectly bolster the market by encouraging the adoption of cleaner vehicle technologies.
Challenges Impacting Automobile Urea Sensor Growth
Despite the strong growth prospects, the Automobile Urea Sensor Market faces several significant challenges that could impact its expansion trajectory. The inherent complexity and associated costs of advanced urea sensor technology remain a considerable barrier for some market participants and vehicle segments, potentially slowing down widespread adoption. Global supply chain vulnerabilities, particularly concerning specialized electronic components and raw materials, can lead to production delays and increased manufacturing costs, impacting product availability and pricing. Navigating the intricate and often disparate regulatory frameworks across different countries and regions adds another layer of complexity for manufacturers aiming for global market reach. Moreover, the competitive landscape is intense, with established players and emerging companies vying for market share, which can exert downward pressure on pricing and profit margins, posing a challenge to sustained profitability.
Key Players Shaping the Automobile Urea Sensor Market
- Vitesco Technologies
- SSI Technologies
- TE Connectivity
- Measurement Specialties
- TT Electronics
- SUN-A Corporation
- Flowline
- Sandeep Automobiles
Significant Automobile Urea Sensor Industry Milestones
- 2019: Introduction of advanced NOx sensor integration for enhanced SCR system control.
- 2020: Increased focus on urea quality sensing capabilities to prevent system damage.
- 2021: Significant investments in R&D for next-generation, highly durable urea sensors.
- 2022: Development of smart urea sensors with predictive maintenance features.
- 2023: Stringent Euro VII emission standards proposed, increasing demand for advanced aftertreatment solutions.
- 2024: Expansion of urea sensor applications into hybrid and potentially some electric vehicle powertrain components requiring emission control.
Future Outlook for Automobile Urea Sensor Market
The future outlook for the Automobile Urea Sensor Market is exceptionally positive, driven by persistent global demand for cleaner transportation. Strategic opportunities lie in further enhancing sensor miniaturization, improving diagnostic capabilities, and developing integrated sensor solutions that combine level and quality sensing. The increasing adoption of advanced SCR systems in emerging economies and the development of more stringent emission standards globally will continue to be significant growth catalysts. The market is poised for substantial expansion, with continued innovation in materials science and digital integration expected to define the next generation of urea sensor technology.
Automobile Urea Sensor Segmentation
-
1. Application
- 1.1. Commercial Vehicles
- 1.2. Passenger Vehicles
-
2. Type
- 2.1. Level Sensor
- 2.2. Quality Sensor
Automobile Urea Sensor Segmentation By Geography
-
1. North America
- 1.1. United States
- 1.2. Canada
- 1.3. Mexico
-
2. South America
- 2.1. Brazil
- 2.2. Argentina
- 2.3. Rest of South America
-
3. Europe
- 3.1. United Kingdom
- 3.2. Germany
- 3.3. France
- 3.4. Italy
- 3.5. Spain
- 3.6. Russia
- 3.7. Benelux
- 3.8. Nordics
- 3.9. Rest of Europe
-
4. Middle East & Africa
- 4.1. Turkey
- 4.2. Israel
- 4.3. GCC
- 4.4. North Africa
- 4.5. South Africa
- 4.6. Rest of Middle East & Africa
-
5. Asia Pacific
- 5.1. China
- 5.2. India
- 5.3. Japan
- 5.4. South Korea
- 5.5. ASEAN
- 5.6. Oceania
- 5.7. Rest of Asia Pacific
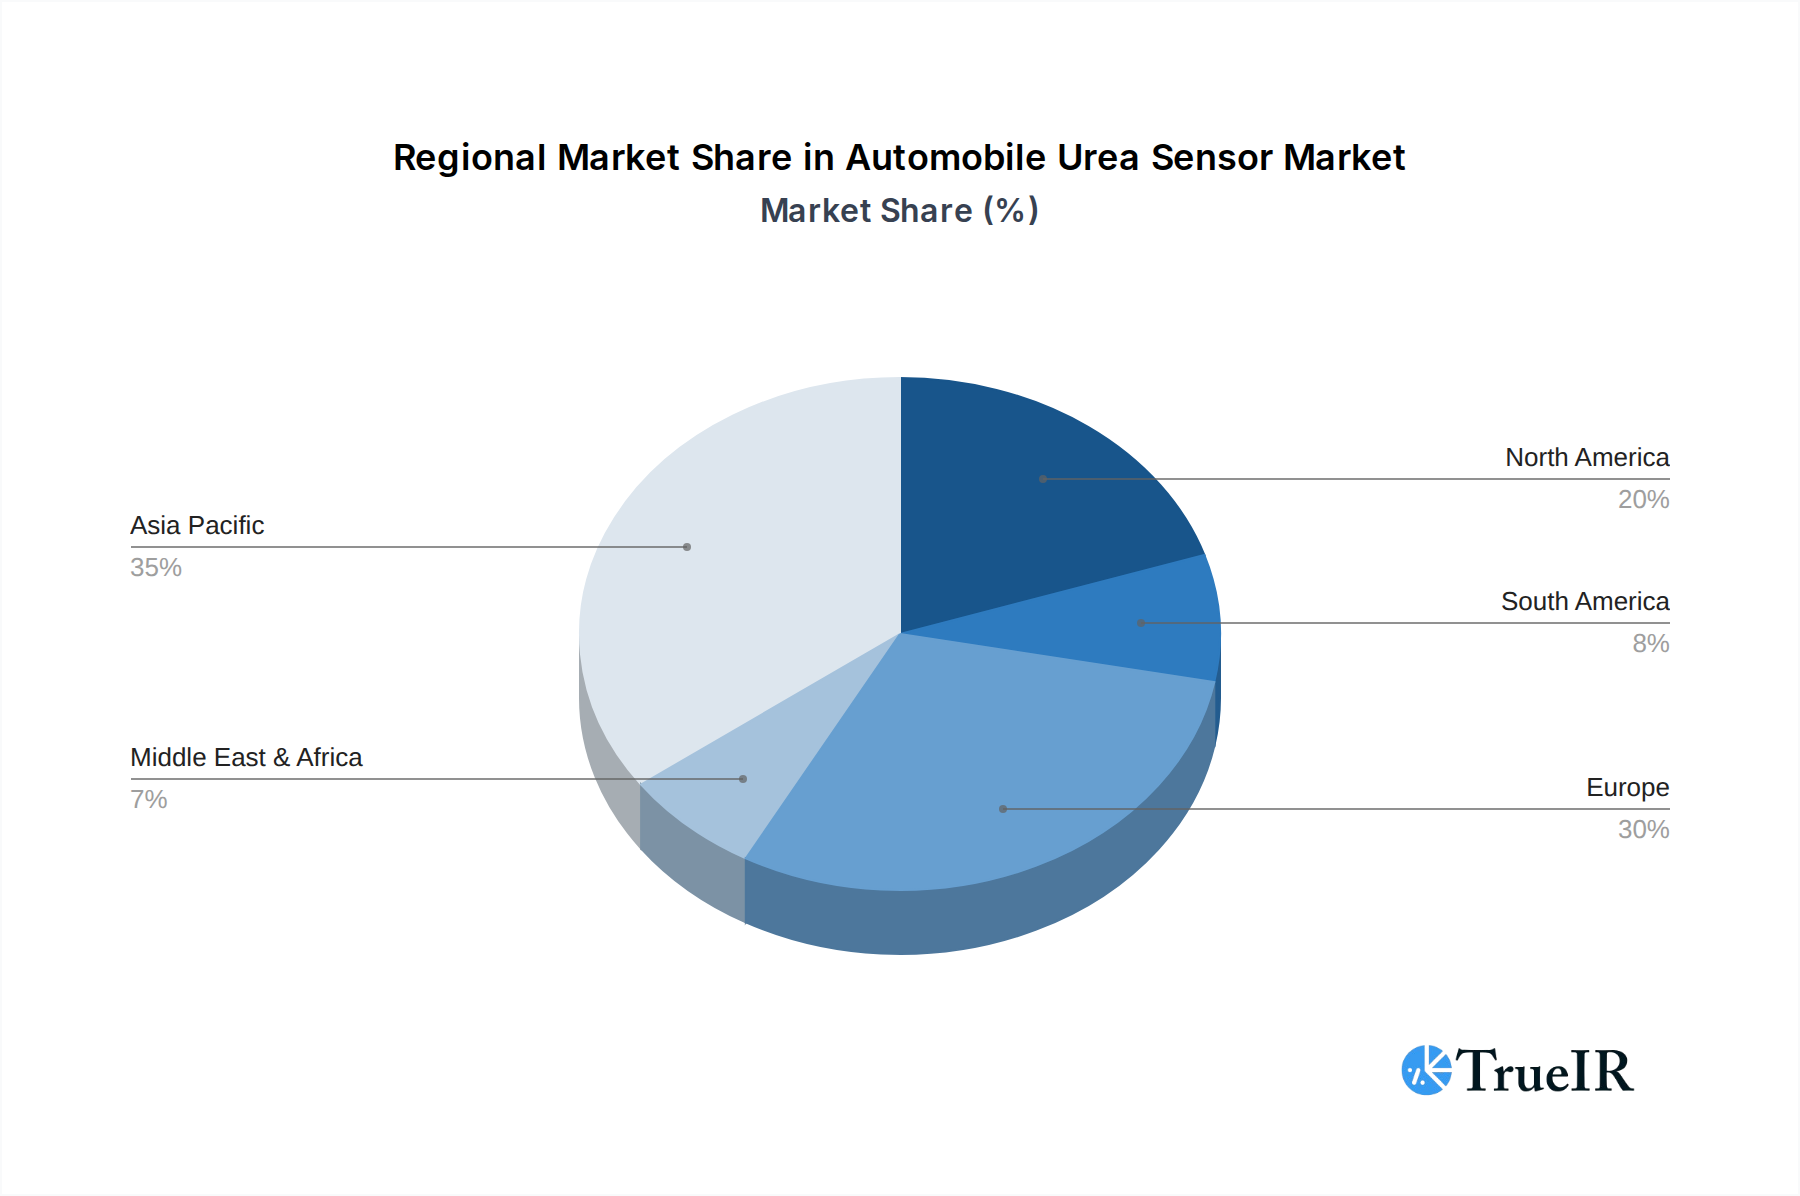
Automobile Urea Sensor Regional Market Share
Geographic Coverage of Automobile Urea Sensor
Automobile Urea Sensor REPORT HIGHLIGHTS
| Aspects | Details |
|---|---|
| Study Period | 2020-2034 |
| Base Year | 2025 |
| Estimated Year | 2026 |
| Forecast Period | 2026-2034 |
| Historical Period | 2020-2025 |
| Growth Rate | CAGR of 9.5% from 2020-2034 |
| Segmentation |
|
Table of Contents
- 1. Introduction
- 1.1. Research Scope
- 1.2. Market Segmentation
- 1.3. Research Methodology
- 1.4. Definitions and Assumptions
- 2. Executive Summary
- 2.1. Introduction
- 3. Market Dynamics
- 3.1. Introduction
- 3.2. Market Drivers
- 3.3. Market Restrains
- 3.4. Market Trends
- 4. Market Factor Analysis
- 4.1. Porters Five Forces
- 4.2. Supply/Value Chain
- 4.3. PESTEL analysis
- 4.4. Market Entropy
- 4.5. Patent/Trademark Analysis
- 5. Global Automobile Urea Sensor Analysis, Insights and Forecast, 2020-2032
- 5.1. Market Analysis, Insights and Forecast - by Application
- 5.1.1. Commercial Vehicles
- 5.1.2. Passenger Vehicles
- 5.2. Market Analysis, Insights and Forecast - by Type
- 5.2.1. Level Sensor
- 5.2.2. Quality Sensor
- 5.3. Market Analysis, Insights and Forecast - by Region
- 5.3.1. North America
- 5.3.2. South America
- 5.3.3. Europe
- 5.3.4. Middle East & Africa
- 5.3.5. Asia Pacific
- 5.1. Market Analysis, Insights and Forecast - by Application
- 6. North America Automobile Urea Sensor Analysis, Insights and Forecast, 2020-2032
- 6.1. Market Analysis, Insights and Forecast - by Application
- 6.1.1. Commercial Vehicles
- 6.1.2. Passenger Vehicles
- 6.2. Market Analysis, Insights and Forecast - by Type
- 6.2.1. Level Sensor
- 6.2.2. Quality Sensor
- 6.1. Market Analysis, Insights and Forecast - by Application
- 7. South America Automobile Urea Sensor Analysis, Insights and Forecast, 2020-2032
- 7.1. Market Analysis, Insights and Forecast - by Application
- 7.1.1. Commercial Vehicles
- 7.1.2. Passenger Vehicles
- 7.2. Market Analysis, Insights and Forecast - by Type
- 7.2.1. Level Sensor
- 7.2.2. Quality Sensor
- 7.1. Market Analysis, Insights and Forecast - by Application
- 8. Europe Automobile Urea Sensor Analysis, Insights and Forecast, 2020-2032
- 8.1. Market Analysis, Insights and Forecast - by Application
- 8.1.1. Commercial Vehicles
- 8.1.2. Passenger Vehicles
- 8.2. Market Analysis, Insights and Forecast - by Type
- 8.2.1. Level Sensor
- 8.2.2. Quality Sensor
- 8.1. Market Analysis, Insights and Forecast - by Application
- 9. Middle East & Africa Automobile Urea Sensor Analysis, Insights and Forecast, 2020-2032
- 9.1. Market Analysis, Insights and Forecast - by Application
- 9.1.1. Commercial Vehicles
- 9.1.2. Passenger Vehicles
- 9.2. Market Analysis, Insights and Forecast - by Type
- 9.2.1. Level Sensor
- 9.2.2. Quality Sensor
- 9.1. Market Analysis, Insights and Forecast - by Application
- 10. Asia Pacific Automobile Urea Sensor Analysis, Insights and Forecast, 2020-2032
- 10.1. Market Analysis, Insights and Forecast - by Application
- 10.1.1. Commercial Vehicles
- 10.1.2. Passenger Vehicles
- 10.2. Market Analysis, Insights and Forecast - by Type
- 10.2.1. Level Sensor
- 10.2.2. Quality Sensor
- 10.1. Market Analysis, Insights and Forecast - by Application
- 11. Competitive Analysis
- 11.1. Global Market Share Analysis 2025
- 11.2. Company Profiles
- 11.2.1 Vitesco Technologies
- 11.2.1.1. Overview
- 11.2.1.2. Products
- 11.2.1.3. SWOT Analysis
- 11.2.1.4. Recent Developments
- 11.2.1.5. Financials (Based on Availability)
- 11.2.2 SSI Technologies
- 11.2.2.1. Overview
- 11.2.2.2. Products
- 11.2.2.3. SWOT Analysis
- 11.2.2.4. Recent Developments
- 11.2.2.5. Financials (Based on Availability)
- 11.2.3 TE Connectivity
- 11.2.3.1. Overview
- 11.2.3.2. Products
- 11.2.3.3. SWOT Analysis
- 11.2.3.4. Recent Developments
- 11.2.3.5. Financials (Based on Availability)
- 11.2.4 Measurement Specialties
- 11.2.4.1. Overview
- 11.2.4.2. Products
- 11.2.4.3. SWOT Analysis
- 11.2.4.4. Recent Developments
- 11.2.4.5. Financials (Based on Availability)
- 11.2.5 TT Electronics
- 11.2.5.1. Overview
- 11.2.5.2. Products
- 11.2.5.3. SWOT Analysis
- 11.2.5.4. Recent Developments
- 11.2.5.5. Financials (Based on Availability)
- 11.2.6 SUN-A Corporation
- 11.2.6.1. Overview
- 11.2.6.2. Products
- 11.2.6.3. SWOT Analysis
- 11.2.6.4. Recent Developments
- 11.2.6.5. Financials (Based on Availability)
- 11.2.7 Flowline
- 11.2.7.1. Overview
- 11.2.7.2. Products
- 11.2.7.3. SWOT Analysis
- 11.2.7.4. Recent Developments
- 11.2.7.5. Financials (Based on Availability)
- 11.2.8 Sandeep Automobiles
- 11.2.8.1. Overview
- 11.2.8.2. Products
- 11.2.8.3. SWOT Analysis
- 11.2.8.4. Recent Developments
- 11.2.8.5. Financials (Based on Availability)
- 11.2.1 Vitesco Technologies
List of Figures
- Figure 1: Global Automobile Urea Sensor Revenue Breakdown (undefined, %) by Region 2025 & 2033
- Figure 2: Global Automobile Urea Sensor Volume Breakdown (K, %) by Region 2025 & 2033
- Figure 3: North America Automobile Urea Sensor Revenue (undefined), by Application 2025 & 2033
- Figure 4: North America Automobile Urea Sensor Volume (K), by Application 2025 & 2033
- Figure 5: North America Automobile Urea Sensor Revenue Share (%), by Application 2025 & 2033
- Figure 6: North America Automobile Urea Sensor Volume Share (%), by Application 2025 & 2033
- Figure 7: North America Automobile Urea Sensor Revenue (undefined), by Type 2025 & 2033
- Figure 8: North America Automobile Urea Sensor Volume (K), by Type 2025 & 2033
- Figure 9: North America Automobile Urea Sensor Revenue Share (%), by Type 2025 & 2033
- Figure 10: North America Automobile Urea Sensor Volume Share (%), by Type 2025 & 2033
- Figure 11: North America Automobile Urea Sensor Revenue (undefined), by Country 2025 & 2033
- Figure 12: North America Automobile Urea Sensor Volume (K), by Country 2025 & 2033
- Figure 13: North America Automobile Urea Sensor Revenue Share (%), by Country 2025 & 2033
- Figure 14: North America Automobile Urea Sensor Volume Share (%), by Country 2025 & 2033
- Figure 15: South America Automobile Urea Sensor Revenue (undefined), by Application 2025 & 2033
- Figure 16: South America Automobile Urea Sensor Volume (K), by Application 2025 & 2033
- Figure 17: South America Automobile Urea Sensor Revenue Share (%), by Application 2025 & 2033
- Figure 18: South America Automobile Urea Sensor Volume Share (%), by Application 2025 & 2033
- Figure 19: South America Automobile Urea Sensor Revenue (undefined), by Type 2025 & 2033
- Figure 20: South America Automobile Urea Sensor Volume (K), by Type 2025 & 2033
- Figure 21: South America Automobile Urea Sensor Revenue Share (%), by Type 2025 & 2033
- Figure 22: South America Automobile Urea Sensor Volume Share (%), by Type 2025 & 2033
- Figure 23: South America Automobile Urea Sensor Revenue (undefined), by Country 2025 & 2033
- Figure 24: South America Automobile Urea Sensor Volume (K), by Country 2025 & 2033
- Figure 25: South America Automobile Urea Sensor Revenue Share (%), by Country 2025 & 2033
- Figure 26: South America Automobile Urea Sensor Volume Share (%), by Country 2025 & 2033
- Figure 27: Europe Automobile Urea Sensor Revenue (undefined), by Application 2025 & 2033
- Figure 28: Europe Automobile Urea Sensor Volume (K), by Application 2025 & 2033
- Figure 29: Europe Automobile Urea Sensor Revenue Share (%), by Application 2025 & 2033
- Figure 30: Europe Automobile Urea Sensor Volume Share (%), by Application 2025 & 2033
- Figure 31: Europe Automobile Urea Sensor Revenue (undefined), by Type 2025 & 2033
- Figure 32: Europe Automobile Urea Sensor Volume (K), by Type 2025 & 2033
- Figure 33: Europe Automobile Urea Sensor Revenue Share (%), by Type 2025 & 2033
- Figure 34: Europe Automobile Urea Sensor Volume Share (%), by Type 2025 & 2033
- Figure 35: Europe Automobile Urea Sensor Revenue (undefined), by Country 2025 & 2033
- Figure 36: Europe Automobile Urea Sensor Volume (K), by Country 2025 & 2033
- Figure 37: Europe Automobile Urea Sensor Revenue Share (%), by Country 2025 & 2033
- Figure 38: Europe Automobile Urea Sensor Volume Share (%), by Country 2025 & 2033
- Figure 39: Middle East & Africa Automobile Urea Sensor Revenue (undefined), by Application 2025 & 2033
- Figure 40: Middle East & Africa Automobile Urea Sensor Volume (K), by Application 2025 & 2033
- Figure 41: Middle East & Africa Automobile Urea Sensor Revenue Share (%), by Application 2025 & 2033
- Figure 42: Middle East & Africa Automobile Urea Sensor Volume Share (%), by Application 2025 & 2033
- Figure 43: Middle East & Africa Automobile Urea Sensor Revenue (undefined), by Type 2025 & 2033
- Figure 44: Middle East & Africa Automobile Urea Sensor Volume (K), by Type 2025 & 2033
- Figure 45: Middle East & Africa Automobile Urea Sensor Revenue Share (%), by Type 2025 & 2033
- Figure 46: Middle East & Africa Automobile Urea Sensor Volume Share (%), by Type 2025 & 2033
- Figure 47: Middle East & Africa Automobile Urea Sensor Revenue (undefined), by Country 2025 & 2033
- Figure 48: Middle East & Africa Automobile Urea Sensor Volume (K), by Country 2025 & 2033
- Figure 49: Middle East & Africa Automobile Urea Sensor Revenue Share (%), by Country 2025 & 2033
- Figure 50: Middle East & Africa Automobile Urea Sensor Volume Share (%), by Country 2025 & 2033
- Figure 51: Asia Pacific Automobile Urea Sensor Revenue (undefined), by Application 2025 & 2033
- Figure 52: Asia Pacific Automobile Urea Sensor Volume (K), by Application 2025 & 2033
- Figure 53: Asia Pacific Automobile Urea Sensor Revenue Share (%), by Application 2025 & 2033
- Figure 54: Asia Pacific Automobile Urea Sensor Volume Share (%), by Application 2025 & 2033
- Figure 55: Asia Pacific Automobile Urea Sensor Revenue (undefined), by Type 2025 & 2033
- Figure 56: Asia Pacific Automobile Urea Sensor Volume (K), by Type 2025 & 2033
- Figure 57: Asia Pacific Automobile Urea Sensor Revenue Share (%), by Type 2025 & 2033
- Figure 58: Asia Pacific Automobile Urea Sensor Volume Share (%), by Type 2025 & 2033
- Figure 59: Asia Pacific Automobile Urea Sensor Revenue (undefined), by Country 2025 & 2033
- Figure 60: Asia Pacific Automobile Urea Sensor Volume (K), by Country 2025 & 2033
- Figure 61: Asia Pacific Automobile Urea Sensor Revenue Share (%), by Country 2025 & 2033
- Figure 62: Asia Pacific Automobile Urea Sensor Volume Share (%), by Country 2025 & 2033
List of Tables
- Table 1: Global Automobile Urea Sensor Revenue undefined Forecast, by Application 2020 & 2033
- Table 2: Global Automobile Urea Sensor Volume K Forecast, by Application 2020 & 2033
- Table 3: Global Automobile Urea Sensor Revenue undefined Forecast, by Type 2020 & 2033
- Table 4: Global Automobile Urea Sensor Volume K Forecast, by Type 2020 & 2033
- Table 5: Global Automobile Urea Sensor Revenue undefined Forecast, by Region 2020 & 2033
- Table 6: Global Automobile Urea Sensor Volume K Forecast, by Region 2020 & 2033
- Table 7: Global Automobile Urea Sensor Revenue undefined Forecast, by Application 2020 & 2033
- Table 8: Global Automobile Urea Sensor Volume K Forecast, by Application 2020 & 2033
- Table 9: Global Automobile Urea Sensor Revenue undefined Forecast, by Type 2020 & 2033
- Table 10: Global Automobile Urea Sensor Volume K Forecast, by Type 2020 & 2033
- Table 11: Global Automobile Urea Sensor Revenue undefined Forecast, by Country 2020 & 2033
- Table 12: Global Automobile Urea Sensor Volume K Forecast, by Country 2020 & 2033
- Table 13: United States Automobile Urea Sensor Revenue (undefined) Forecast, by Application 2020 & 2033
- Table 14: United States Automobile Urea Sensor Volume (K) Forecast, by Application 2020 & 2033
- Table 15: Canada Automobile Urea Sensor Revenue (undefined) Forecast, by Application 2020 & 2033
- Table 16: Canada Automobile Urea Sensor Volume (K) Forecast, by Application 2020 & 2033
- Table 17: Mexico Automobile Urea Sensor Revenue (undefined) Forecast, by Application 2020 & 2033
- Table 18: Mexico Automobile Urea Sensor Volume (K) Forecast, by Application 2020 & 2033
- Table 19: Global Automobile Urea Sensor Revenue undefined Forecast, by Application 2020 & 2033
- Table 20: Global Automobile Urea Sensor Volume K Forecast, by Application 2020 & 2033
- Table 21: Global Automobile Urea Sensor Revenue undefined Forecast, by Type 2020 & 2033
- Table 22: Global Automobile Urea Sensor Volume K Forecast, by Type 2020 & 2033
- Table 23: Global Automobile Urea Sensor Revenue undefined Forecast, by Country 2020 & 2033
- Table 24: Global Automobile Urea Sensor Volume K Forecast, by Country 2020 & 2033
- Table 25: Brazil Automobile Urea Sensor Revenue (undefined) Forecast, by Application 2020 & 2033
- Table 26: Brazil Automobile Urea Sensor Volume (K) Forecast, by Application 2020 & 2033
- Table 27: Argentina Automobile Urea Sensor Revenue (undefined) Forecast, by Application 2020 & 2033
- Table 28: Argentina Automobile Urea Sensor Volume (K) Forecast, by Application 2020 & 2033
- Table 29: Rest of South America Automobile Urea Sensor Revenue (undefined) Forecast, by Application 2020 & 2033
- Table 30: Rest of South America Automobile Urea Sensor Volume (K) Forecast, by Application 2020 & 2033
- Table 31: Global Automobile Urea Sensor Revenue undefined Forecast, by Application 2020 & 2033
- Table 32: Global Automobile Urea Sensor Volume K Forecast, by Application 2020 & 2033
- Table 33: Global Automobile Urea Sensor Revenue undefined Forecast, by Type 2020 & 2033
- Table 34: Global Automobile Urea Sensor Volume K Forecast, by Type 2020 & 2033
- Table 35: Global Automobile Urea Sensor Revenue undefined Forecast, by Country 2020 & 2033
- Table 36: Global Automobile Urea Sensor Volume K Forecast, by Country 2020 & 2033
- Table 37: United Kingdom Automobile Urea Sensor Revenue (undefined) Forecast, by Application 2020 & 2033
- Table 38: United Kingdom Automobile Urea Sensor Volume (K) Forecast, by Application 2020 & 2033
- Table 39: Germany Automobile Urea Sensor Revenue (undefined) Forecast, by Application 2020 & 2033
- Table 40: Germany Automobile Urea Sensor Volume (K) Forecast, by Application 2020 & 2033
- Table 41: France Automobile Urea Sensor Revenue (undefined) Forecast, by Application 2020 & 2033
- Table 42: France Automobile Urea Sensor Volume (K) Forecast, by Application 2020 & 2033
- Table 43: Italy Automobile Urea Sensor Revenue (undefined) Forecast, by Application 2020 & 2033
- Table 44: Italy Automobile Urea Sensor Volume (K) Forecast, by Application 2020 & 2033
- Table 45: Spain Automobile Urea Sensor Revenue (undefined) Forecast, by Application 2020 & 2033
- Table 46: Spain Automobile Urea Sensor Volume (K) Forecast, by Application 2020 & 2033
- Table 47: Russia Automobile Urea Sensor Revenue (undefined) Forecast, by Application 2020 & 2033
- Table 48: Russia Automobile Urea Sensor Volume (K) Forecast, by Application 2020 & 2033
- Table 49: Benelux Automobile Urea Sensor Revenue (undefined) Forecast, by Application 2020 & 2033
- Table 50: Benelux Automobile Urea Sensor Volume (K) Forecast, by Application 2020 & 2033
- Table 51: Nordics Automobile Urea Sensor Revenue (undefined) Forecast, by Application 2020 & 2033
- Table 52: Nordics Automobile Urea Sensor Volume (K) Forecast, by Application 2020 & 2033
- Table 53: Rest of Europe Automobile Urea Sensor Revenue (undefined) Forecast, by Application 2020 & 2033
- Table 54: Rest of Europe Automobile Urea Sensor Volume (K) Forecast, by Application 2020 & 2033
- Table 55: Global Automobile Urea Sensor Revenue undefined Forecast, by Application 2020 & 2033
- Table 56: Global Automobile Urea Sensor Volume K Forecast, by Application 2020 & 2033
- Table 57: Global Automobile Urea Sensor Revenue undefined Forecast, by Type 2020 & 2033
- Table 58: Global Automobile Urea Sensor Volume K Forecast, by Type 2020 & 2033
- Table 59: Global Automobile Urea Sensor Revenue undefined Forecast, by Country 2020 & 2033
- Table 60: Global Automobile Urea Sensor Volume K Forecast, by Country 2020 & 2033
- Table 61: Turkey Automobile Urea Sensor Revenue (undefined) Forecast, by Application 2020 & 2033
- Table 62: Turkey Automobile Urea Sensor Volume (K) Forecast, by Application 2020 & 2033
- Table 63: Israel Automobile Urea Sensor Revenue (undefined) Forecast, by Application 2020 & 2033
- Table 64: Israel Automobile Urea Sensor Volume (K) Forecast, by Application 2020 & 2033
- Table 65: GCC Automobile Urea Sensor Revenue (undefined) Forecast, by Application 2020 & 2033
- Table 66: GCC Automobile Urea Sensor Volume (K) Forecast, by Application 2020 & 2033
- Table 67: North Africa Automobile Urea Sensor Revenue (undefined) Forecast, by Application 2020 & 2033
- Table 68: North Africa Automobile Urea Sensor Volume (K) Forecast, by Application 2020 & 2033
- Table 69: South Africa Automobile Urea Sensor Revenue (undefined) Forecast, by Application 2020 & 2033
- Table 70: South Africa Automobile Urea Sensor Volume (K) Forecast, by Application 2020 & 2033
- Table 71: Rest of Middle East & Africa Automobile Urea Sensor Revenue (undefined) Forecast, by Application 2020 & 2033
- Table 72: Rest of Middle East & Africa Automobile Urea Sensor Volume (K) Forecast, by Application 2020 & 2033
- Table 73: Global Automobile Urea Sensor Revenue undefined Forecast, by Application 2020 & 2033
- Table 74: Global Automobile Urea Sensor Volume K Forecast, by Application 2020 & 2033
- Table 75: Global Automobile Urea Sensor Revenue undefined Forecast, by Type 2020 & 2033
- Table 76: Global Automobile Urea Sensor Volume K Forecast, by Type 2020 & 2033
- Table 77: Global Automobile Urea Sensor Revenue undefined Forecast, by Country 2020 & 2033
- Table 78: Global Automobile Urea Sensor Volume K Forecast, by Country 2020 & 2033
- Table 79: China Automobile Urea Sensor Revenue (undefined) Forecast, by Application 2020 & 2033
- Table 80: China Automobile Urea Sensor Volume (K) Forecast, by Application 2020 & 2033
- Table 81: India Automobile Urea Sensor Revenue (undefined) Forecast, by Application 2020 & 2033
- Table 82: India Automobile Urea Sensor Volume (K) Forecast, by Application 2020 & 2033
- Table 83: Japan Automobile Urea Sensor Revenue (undefined) Forecast, by Application 2020 & 2033
- Table 84: Japan Automobile Urea Sensor Volume (K) Forecast, by Application 2020 & 2033
- Table 85: South Korea Automobile Urea Sensor Revenue (undefined) Forecast, by Application 2020 & 2033
- Table 86: South Korea Automobile Urea Sensor Volume (K) Forecast, by Application 2020 & 2033
- Table 87: ASEAN Automobile Urea Sensor Revenue (undefined) Forecast, by Application 2020 & 2033
- Table 88: ASEAN Automobile Urea Sensor Volume (K) Forecast, by Application 2020 & 2033
- Table 89: Oceania Automobile Urea Sensor Revenue (undefined) Forecast, by Application 2020 & 2033
- Table 90: Oceania Automobile Urea Sensor Volume (K) Forecast, by Application 2020 & 2033
- Table 91: Rest of Asia Pacific Automobile Urea Sensor Revenue (undefined) Forecast, by Application 2020 & 2033
- Table 92: Rest of Asia Pacific Automobile Urea Sensor Volume (K) Forecast, by Application 2020 & 2033
Frequently Asked Questions
1. What is the projected Compound Annual Growth Rate (CAGR) of the Automobile Urea Sensor?
The projected CAGR is approximately 9.5%.
2. Which companies are prominent players in the Automobile Urea Sensor?
Key companies in the market include Vitesco Technologies, SSI Technologies, TE Connectivity, Measurement Specialties, TT Electronics, SUN-A Corporation, Flowline, Sandeep Automobiles.
3. What are the main segments of the Automobile Urea Sensor?
The market segments include Application, Type.
4. Can you provide details about the market size?
The market size is estimated to be USD XXX N/A as of 2022.
5. What are some drivers contributing to market growth?
N/A
6. What are the notable trends driving market growth?
N/A
7. Are there any restraints impacting market growth?
N/A
8. Can you provide examples of recent developments in the market?
N/A
9. What pricing options are available for accessing the report?
Pricing options include single-user, multi-user, and enterprise licenses priced at USD 3950.00, USD 5925.00, and USD 7900.00 respectively.
10. Is the market size provided in terms of value or volume?
The market size is provided in terms of value, measured in N/A and volume, measured in K.
11. Are there any specific market keywords associated with the report?
Yes, the market keyword associated with the report is "Automobile Urea Sensor," which aids in identifying and referencing the specific market segment covered.
12. How do I determine which pricing option suits my needs best?
The pricing options vary based on user requirements and access needs. Individual users may opt for single-user licenses, while businesses requiring broader access may choose multi-user or enterprise licenses for cost-effective access to the report.
13. Are there any additional resources or data provided in the Automobile Urea Sensor report?
While the report offers comprehensive insights, it's advisable to review the specific contents or supplementary materials provided to ascertain if additional resources or data are available.
14. How can I stay updated on further developments or reports in the Automobile Urea Sensor?
To stay informed about further developments, trends, and reports in the Automobile Urea Sensor, consider subscribing to industry newsletters, following relevant companies and organizations, or regularly checking reputable industry news sources and publications.
Methodology
Step 1 - Identification of Relevant Samples Size from Population Database


Step 2 - Approaches for Defining Global Market Size (Value, Volume* & Price*)

Note*: In applicable scenarios
Step 3 - Data Sources
Primary Research
- Web Analytics
- Survey Reports
- Research Institute
- Latest Research Reports
- Opinion Leaders
Secondary Research
- Annual Reports
- White Paper
- Latest Press Release
- Industry Association
- Paid Database
- Investor Presentations

Step 4 - Data Triangulation
Involves using different sources of information in order to increase the validity of a study
These sources are likely to be stakeholders in a program - participants, other researchers, program staff, other community members, and so on.
Then we put all data in single framework & apply various statistical tools to find out the dynamic on the market.
During the analysis stage, feedback from the stakeholder groups would be compared to determine areas of agreement as well as areas of divergence