

Key Insights
The Azotobacter market, exhibiting a robust Compound Annual Growth Rate (CAGR) of 9.02%, presents a significant opportunity for investors and stakeholders. Driven by the increasing demand for sustainable and eco-friendly agricultural practices, the market is experiencing considerable growth. Farmers are increasingly adopting biofertilizers like Azotobacter to reduce reliance on chemical fertilizers, mitigating environmental concerns and enhancing crop yields. This shift is particularly pronounced in regions with burgeoning agricultural sectors and growing populations, such as Asia-Pacific and Africa. Key market segments include cash crops, horticultural crops, and row crops, with substantial contributions from major economies like India, China, the United States, and Brazil. The market is further segmented geographically, reflecting varying levels of agricultural intensity and adoption rates of biofertilizers. While challenges remain, such as the relatively low awareness of Azotobacter's benefits in certain regions and the need for consistent product quality, the overall market trajectory remains positive, fueled by supportive government policies promoting sustainable agriculture and the growing demand for organic and sustainably produced food.
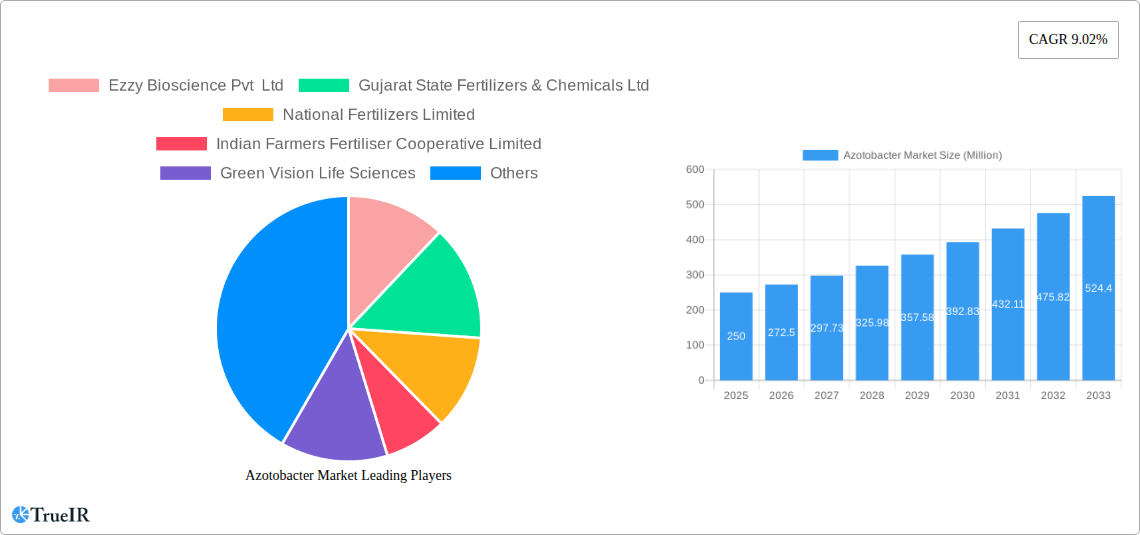
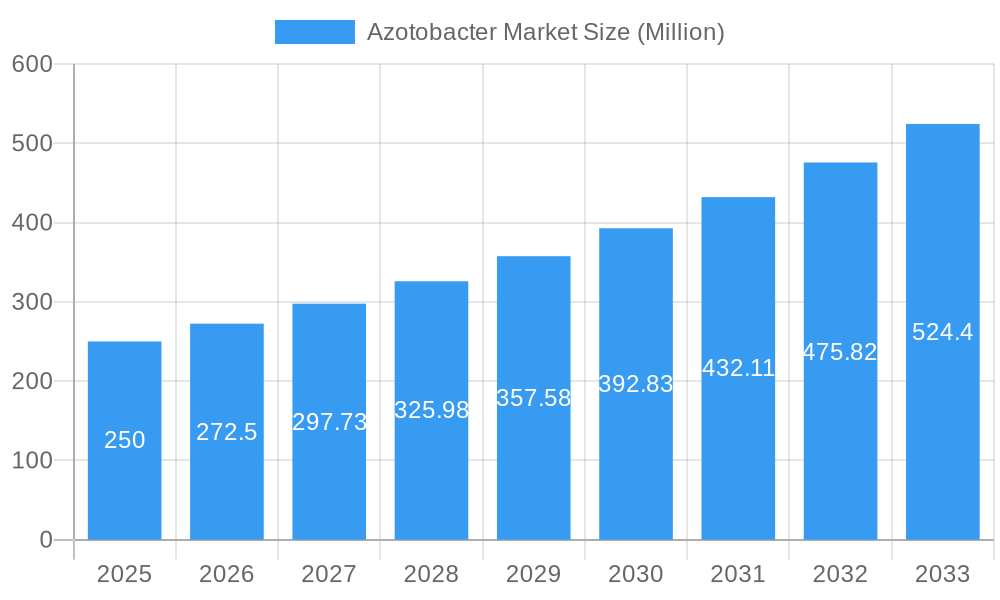
Azotobacter Market Market Size (In Million)
The competitive landscape is characterized by a mix of established players and emerging companies, indicating considerable innovation and investment in the sector. Companies are focusing on research and development to improve Azotobacter strains, formulate effective product delivery systems, and expand their market reach. The future growth of the Azotobacter market is likely to be shaped by technological advancements in biofertilizer production, effective marketing and distribution strategies, and continued government support for sustainable agriculture initiatives. Further research into optimizing Azotobacter's efficacy for specific crop types and environmental conditions will be crucial for maximizing its impact and expanding its market penetration. Strategic partnerships between biofertilizer companies and agricultural stakeholders will also be essential to accelerate market adoption and address the challenges related to awareness and product standardization.
Azotobacter Market Company Market Share
Azotobacter Market: A Comprehensive Analysis & Forecast (2019-2033)
This comprehensive report provides an in-depth analysis of the global Azotobacter market, offering invaluable insights for stakeholders across the agricultural biotechnology industry. With a study period spanning 2019-2033, a base year of 2025, and a forecast period from 2025-2033, this report meticulously examines market trends, competitive landscapes, and future growth prospects. The report leverages extensive data analysis and expert insights to provide a clear understanding of the market's dynamics and potential. The market is segmented by crop type (cash crops, horticultural crops, row crops), region (Africa, Asia-Pacific, Europe, Middle East, North America, South America), and individual countries within those regions. Key players like Ezzy Bioscience Pvt Ltd, Gujarat State Fertilizers & Chemicals Ltd, and National Fertilizers Limited are analyzed to provide a complete market picture. The report’s estimated market value in 2025 is expected to reach xx Million, with a projected CAGR of xx% during the forecast period.
Azotobacter Market Market Structure & Competitive Landscape
The Azotobacter market exhibits a moderately fragmented structure, with several key players vying for market share. Market concentration is estimated at xx% in 2025, as indicated by the Herfindahl-Hirschman Index (HHI) of xx. Innovation within the sector is primarily driven by the need for sustainable and environmentally friendly agricultural solutions. Stringent regulatory frameworks governing biofertilizer usage influence market dynamics significantly. While there are limited direct substitutes, alternative nitrogen-fixing methods pose some competitive pressure. End-user segmentation is primarily driven by the agricultural sector, with varied demands from different crop types and farming practices. M&A activity in the industry is moderate, with approximately xx deals recorded between 2019 and 2024, primarily focused on expanding product portfolios and market reach.
- Market Concentration: Moderately fragmented (HHI: xx)
- Innovation Drivers: Sustainability, environmental concerns, yield enhancement.
- Regulatory Impacts: Stringent regulations governing biofertilizer production and application.
- Product Substitutes: Limited direct substitutes; indirect competition from alternative nitrogen-fixing technologies.
- End-User Segmentation: Primarily the agricultural sector, further segmented by crop type and farming practices.
- M&A Trends: Moderate activity, focused on portfolio expansion and market access.
Azotobacter Market Market Trends & Opportunities
The Azotobacter market is experiencing robust growth, driven by increasing demand for sustainable agriculture practices and the growing need to reduce reliance on chemical fertilizers. The global market size is expected to expand from xx Million in 2025 to xx Million by 2033, exhibiting a CAGR of xx%. Technological advancements, particularly in product formulation and delivery systems, are enhancing the efficacy and usability of Azotobacter-based biofertilizers. Consumer preferences are increasingly shifting towards organic and sustainable agricultural practices, creating a fertile ground for market expansion. Competitive dynamics are characterized by product differentiation, focusing on improved efficacy, cost-effectiveness, and ease of application. The market penetration rate is anticipated to reach xx% by 2033, driven by increased awareness and adoption of sustainable agricultural practices among farmers globally.
Dominant Markets & Segments in Azotobacter Market
The Asia-Pacific region dominates the Azotobacter market, driven by a large agricultural sector, increasing demand for high-yield crops, and supportive government policies promoting sustainable agriculture. Within Asia-Pacific, India emerges as a major market, fueled by extensive arable land, a large farming population, and rising awareness of the benefits of biofertilizers. Significant growth is also anticipated in other regions such as Africa, particularly in countries like Egypt, Nigeria, and South Africa, due to rising agricultural activities and favorable climatic conditions.
Key Growth Drivers in Asia-Pacific (especially India):
- Large agricultural sector and extensive arable land.
- Growing demand for sustainable and high-yield farming practices.
- Supportive government policies promoting biofertilizer adoption.
- Increasing farmer awareness and adoption rates.
Key Growth Drivers in Africa (Egypt, Nigeria, South Africa):
- Rising agricultural production and land under cultivation.
- Government initiatives promoting sustainable farming practices.
- Favorable climatic conditions suitable for Azotobacter application.
Other significant markets: China, Brazil, and the United States also exhibit significant, albeit smaller, market shares.
Azotobacter Market Product Analysis
Azotobacter-based biofertilizers are experiencing continuous innovation, with the development of advanced formulations featuring enhanced nitrogen-fixing capabilities and improved shelf life. These products are applied across a range of crops, including cash crops, horticultural crops, and row crops, offering a sustainable and cost-effective alternative to chemical fertilizers. The key competitive advantages lie in their environmental friendliness, enhanced crop yields, and reduced reliance on synthetic inputs. The growing emphasis on sustainable agriculture is further bolstering the market demand for these innovative products, improving market fit.
Key Drivers, Barriers & Challenges in Azotobacter Market
Key Drivers: Growing demand for sustainable agriculture, stringent regulations against chemical fertilizers in some regions, increasing awareness of the environmental benefits of biofertilizers, technological advancements leading to improved product efficacy.
Challenges & Restraints: High initial investment costs for adopting biofertilizers, inconsistent product quality from some manufacturers, lack of awareness among farmers in certain regions, competition from established chemical fertilizer companies, and limitations in supply chain infrastructure for efficient distribution. These factors could potentially restrain market growth by xx% in certain regions during the forecast period.
Growth Drivers in the Azotobacter Market Market
The Azotobacter market is propelled by increasing government support for sustainable agriculture through subsidies and incentive programs. Technological advancements resulting in improved product formulations enhance efficacy and shelf life. The rising awareness among farmers about the environmental and economic benefits of biofertilizers, coupled with the growing demand for organic produce, further boosts market growth.
Challenges Impacting Azotobacter Market Growth
Major challenges include the relatively high cost of biofertilizers compared to chemical fertilizers, impacting adoption rates, especially in developing nations. Inconsistent product quality from certain suppliers can erode farmer trust. Inadequate distribution networks and lack of awareness among farmers in remote areas hamper market penetration. Competition from established chemical fertilizer players represents a significant barrier to rapid market expansion.
Key Players Shaping the Azotobacter Market Market
- Ezzy Bioscience Pvt Ltd
- Gujarat State Fertilizers & Chemicals Ltd
- National Fertilizers Limited
- Indian Farmers Fertiliser Cooperative Limited
- Green Vision Life Sciences
- Samriddhi Crops India Pvt Ltd
- Jaipur Bio Fertilizers
- IPL Biologicals Limited
- Indogulf BioAg LLC (Biotech Division of Indogulf Company)
- T Stanes and Company Limite
Significant Azotobacter Market Industry Milestones
- 2020: Launch of a new Azotobacter-based biofertilizer with enhanced nitrogen-fixing capabilities by Ezzy Bioscience Pvt Ltd.
- 2022: Gujarat State Fertilizers & Chemicals Ltd secures a major contract to supply Azotobacter biofertilizers to a large agricultural cooperative.
- 2023: A significant merger between two key players in the Indian market leads to increased market consolidation. (Further milestones can be added as they become available.)
Future Outlook for Azotobacter Market Market
The Azotobacter market is poised for significant growth, driven by continued innovation in product formulations, increasing government support for sustainable agriculture, and heightened farmer awareness. Strategic partnerships between biofertilizer companies and agricultural input suppliers are expected to facilitate market penetration and distribution. The expanding market for organic and sustainable produce presents significant opportunities for growth. The overall market outlook is extremely promising, with significant potential for expansion across various regions and crop types.
Azotobacter Market Segmentation
- 1. Production Analysis
- 2. Consumption Analysis
- 3. Import Market Analysis (Value & Volume)
- 4. Export Market Analysis (Value & Volume)
- 5. Price Trend Analysis
Azotobacter Market Segmentation By Geography
-
1. North America
- 1.1. United States
- 1.2. Canada
- 1.3. Mexico
-
2. South America
- 2.1. Brazil
- 2.2. Argentina
- 2.3. Rest of South America
-
3. Europe
- 3.1. United Kingdom
- 3.2. Germany
- 3.3. France
- 3.4. Italy
- 3.5. Spain
- 3.6. Russia
- 3.7. Benelux
- 3.8. Nordics
- 3.9. Rest of Europe
-
4. Middle East & Africa
- 4.1. Turkey
- 4.2. Israel
- 4.3. GCC
- 4.4. North Africa
- 4.5. South Africa
- 4.6. Rest of Middle East & Africa
-
5. Asia Pacific
- 5.1. China
- 5.2. India
- 5.3. Japan
- 5.4. South Korea
- 5.5. ASEAN
- 5.6. Oceania
- 5.7. Rest of Asia Pacific
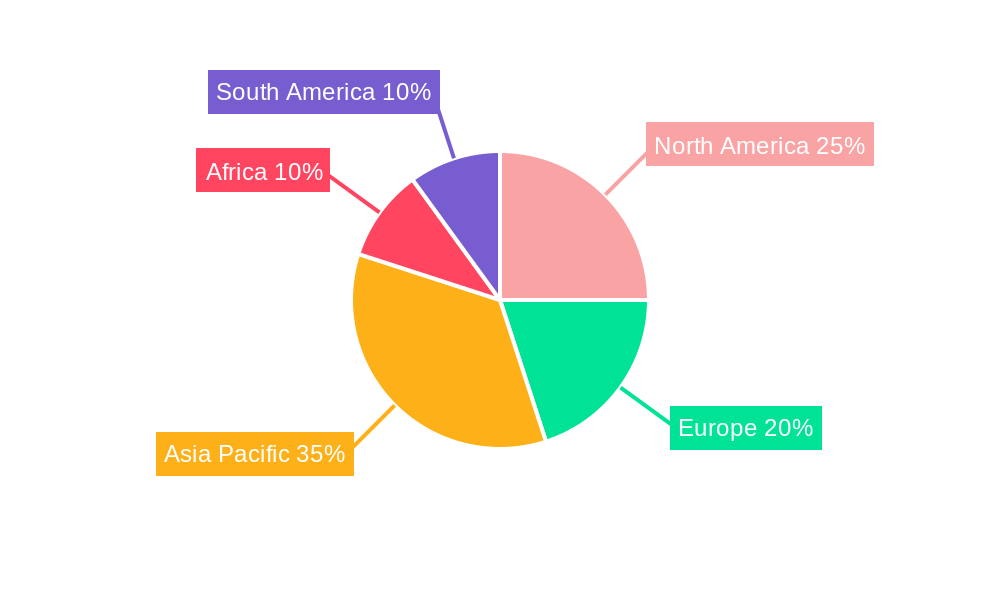
Azotobacter Market Regional Market Share
Geographic Coverage of Azotobacter Market
Azotobacter Market REPORT HIGHLIGHTS
| Aspects | Details |
|---|---|
| Study Period | 2020-2034 |
| Base Year | 2025 |
| Estimated Year | 2026 |
| Forecast Period | 2026-2034 |
| Historical Period | 2020-2025 |
| Growth Rate | CAGR of 11.1% from 2020-2034 |
| Segmentation |
|
Table of Contents
- 1. Introduction
- 1.1. Research Scope
- 1.2. Market Segmentation
- 1.3. Research Objective
- 1.4. Definitions and Assumptions
- 2. Executive Summary
- 2.1. Market Snapshot
- 3. Market Dynamics
- 3.1. Market Drivers
- 3.2. Market Restrains
- 3.3. Market Trends
- 3.4. Market Opportunities
- 4. Market Factor Analysis
- 4.1. Porters Five Forces
- 4.1.1. Bargaining Power of Suppliers
- 4.1.2. Bargaining Power of Buyers
- 4.1.3. Threat of New Entrants
- 4.1.4. Threat of Substitutes
- 4.1.5. Competitive Rivalry
- 4.2. PESTEL analysis
- 4.3. BCG Analysis
- 4.3.1. Stars (High Growth, High Market Share)
- 4.3.2. Cash Cows (Low Growth, High Market Share)
- 4.3.3. Question Mark (High Growth, Low Market Share)
- 4.3.4. Dogs (Low Growth, Low Market Share)
- 4.4. Ansoff Matrix Analysis
- 4.5. Supply Chain Analysis
- 4.6. Regulatory Landscape
- 4.7. Current Market Potential and Opportunity Assessment (TAM–SAM–SOM Framework)
- 4.8. TIR Analyst Note
- 4.1. Porters Five Forces
- 5. Market Analysis, Insights and Forecast 2021-2033
- 5.1. Market Analysis, Insights and Forecast - by Production Analysis
- 5.2. Market Analysis, Insights and Forecast - by Consumption Analysis
- 5.3. Market Analysis, Insights and Forecast - by Import Market Analysis (Value & Volume)
- 5.4. Market Analysis, Insights and Forecast - by Export Market Analysis (Value & Volume)
- 5.5. Market Analysis, Insights and Forecast - by Price Trend Analysis
- 5.6. Market Analysis, Insights and Forecast - by Region
- 5.6.1. North America
- 5.6.2. South America
- 5.6.3. Europe
- 5.6.4. Middle East & Africa
- 5.6.5. Asia Pacific
- 6. Global Azotobacter Market Analysis, Insights and Forecast, 2021-2033
- 6.1. Market Analysis, Insights and Forecast - by Production Analysis
- 6.2. Market Analysis, Insights and Forecast - by Consumption Analysis
- 6.3. Market Analysis, Insights and Forecast - by Import Market Analysis (Value & Volume)
- 6.4. Market Analysis, Insights and Forecast - by Export Market Analysis (Value & Volume)
- 6.5. Market Analysis, Insights and Forecast - by Price Trend Analysis
- 7. North America Azotobacter Market Analysis, Insights and Forecast, 2020-2032
- 7.1. Market Analysis, Insights and Forecast - by Production Analysis
- 7.2. Market Analysis, Insights and Forecast - by Consumption Analysis
- 7.3. Market Analysis, Insights and Forecast - by Import Market Analysis (Value & Volume)
- 7.4. Market Analysis, Insights and Forecast - by Export Market Analysis (Value & Volume)
- 7.5. Market Analysis, Insights and Forecast - by Price Trend Analysis
- 8. South America Azotobacter Market Analysis, Insights and Forecast, 2020-2032
- 8.1. Market Analysis, Insights and Forecast - by Production Analysis
- 8.2. Market Analysis, Insights and Forecast - by Consumption Analysis
- 8.3. Market Analysis, Insights and Forecast - by Import Market Analysis (Value & Volume)
- 8.4. Market Analysis, Insights and Forecast - by Export Market Analysis (Value & Volume)
- 8.5. Market Analysis, Insights and Forecast - by Price Trend Analysis
- 9. Europe Azotobacter Market Analysis, Insights and Forecast, 2020-2032
- 9.1. Market Analysis, Insights and Forecast - by Production Analysis
- 9.2. Market Analysis, Insights and Forecast - by Consumption Analysis
- 9.3. Market Analysis, Insights and Forecast - by Import Market Analysis (Value & Volume)
- 9.4. Market Analysis, Insights and Forecast - by Export Market Analysis (Value & Volume)
- 9.5. Market Analysis, Insights and Forecast - by Price Trend Analysis
- 10. Middle East & Africa Azotobacter Market Analysis, Insights and Forecast, 2020-2032
- 10.1. Market Analysis, Insights and Forecast - by Production Analysis
- 10.2. Market Analysis, Insights and Forecast - by Consumption Analysis
- 10.3. Market Analysis, Insights and Forecast - by Import Market Analysis (Value & Volume)
- 10.4. Market Analysis, Insights and Forecast - by Export Market Analysis (Value & Volume)
- 10.5. Market Analysis, Insights and Forecast - by Price Trend Analysis
- 11. Asia Pacific Azotobacter Market Analysis, Insights and Forecast, 2020-2032
- 11.1. Market Analysis, Insights and Forecast - by Production Analysis
- 11.2. Market Analysis, Insights and Forecast - by Consumption Analysis
- 11.3. Market Analysis, Insights and Forecast - by Import Market Analysis (Value & Volume)
- 11.4. Market Analysis, Insights and Forecast - by Export Market Analysis (Value & Volume)
- 11.5. Market Analysis, Insights and Forecast - by Price Trend Analysis
- 12. Competitive Analysis
- 12.1. Company Profiles
- 12.1.1 Ezzy Bioscience Pvt Ltd
- 12.1.1.1. Company Overview
- 12.1.1.2. Products
- 12.1.1.3. Company Financials
- 12.1.1.4. SWOT Analysis
- 12.1.2 Gujarat State Fertilizers & Chemicals Ltd
- 12.1.2.1. Company Overview
- 12.1.2.2. Products
- 12.1.2.3. Company Financials
- 12.1.2.4. SWOT Analysis
- 12.1.3 National Fertilizers Limited
- 12.1.3.1. Company Overview
- 12.1.3.2. Products
- 12.1.3.3. Company Financials
- 12.1.3.4. SWOT Analysis
- 12.1.4 Indian Farmers Fertiliser Cooperative Limited
- 12.1.4.1. Company Overview
- 12.1.4.2. Products
- 12.1.4.3. Company Financials
- 12.1.4.4. SWOT Analysis
- 12.1.5 Green Vision Life Sciences
- 12.1.5.1. Company Overview
- 12.1.5.2. Products
- 12.1.5.3. Company Financials
- 12.1.5.4. SWOT Analysis
- 12.1.6 Samriddhi Crops India Pvt Ltd
- 12.1.6.1. Company Overview
- 12.1.6.2. Products
- 12.1.6.3. Company Financials
- 12.1.6.4. SWOT Analysis
- 12.1.7 Jaipur Bio Fertilizers
- 12.1.7.1. Company Overview
- 12.1.7.2. Products
- 12.1.7.3. Company Financials
- 12.1.7.4. SWOT Analysis
- 12.1.8 IPL Biologicals Limited
- 12.1.8.1. Company Overview
- 12.1.8.2. Products
- 12.1.8.3. Company Financials
- 12.1.8.4. SWOT Analysis
- 12.1.9 Indogulf BioAg LLC (Biotech Division of Indogulf Company)
- 12.1.9.1. Company Overview
- 12.1.9.2. Products
- 12.1.9.3. Company Financials
- 12.1.9.4. SWOT Analysis
- 12.1.10 T Stanes and Company Limite
- 12.1.10.1. Company Overview
- 12.1.10.2. Products
- 12.1.10.3. Company Financials
- 12.1.10.4. SWOT Analysis
- 12.1.1 Ezzy Bioscience Pvt Ltd
- 12.2. Market Entropy
- 12.2.1 Company's Key Areas Served
- 12.2.2 Recent Developments
- 12.3. Company Market Share Analysis 2025
- 12.3.1 Top 5 Companies Market Share Analysis
- 12.3.2 Top 3 Companies Market Share Analysis
- 12.4. List of Potential Customers
- 13. Research Methodology
List of Figures
- Figure 1: Global Azotobacter Market Revenue Breakdown (million, %) by Region 2025 & 2033
- Figure 2: North America Azotobacter Market Revenue (million), by Production Analysis 2025 & 2033
- Figure 3: North America Azotobacter Market Revenue Share (%), by Production Analysis 2025 & 2033
- Figure 4: North America Azotobacter Market Revenue (million), by Consumption Analysis 2025 & 2033
- Figure 5: North America Azotobacter Market Revenue Share (%), by Consumption Analysis 2025 & 2033
- Figure 6: North America Azotobacter Market Revenue (million), by Import Market Analysis (Value & Volume) 2025 & 2033
- Figure 7: North America Azotobacter Market Revenue Share (%), by Import Market Analysis (Value & Volume) 2025 & 2033
- Figure 8: North America Azotobacter Market Revenue (million), by Export Market Analysis (Value & Volume) 2025 & 2033
- Figure 9: North America Azotobacter Market Revenue Share (%), by Export Market Analysis (Value & Volume) 2025 & 2033
- Figure 10: North America Azotobacter Market Revenue (million), by Price Trend Analysis 2025 & 2033
- Figure 11: North America Azotobacter Market Revenue Share (%), by Price Trend Analysis 2025 & 2033
- Figure 12: North America Azotobacter Market Revenue (million), by Country 2025 & 2033
- Figure 13: North America Azotobacter Market Revenue Share (%), by Country 2025 & 2033
- Figure 14: South America Azotobacter Market Revenue (million), by Production Analysis 2025 & 2033
- Figure 15: South America Azotobacter Market Revenue Share (%), by Production Analysis 2025 & 2033
- Figure 16: South America Azotobacter Market Revenue (million), by Consumption Analysis 2025 & 2033
- Figure 17: South America Azotobacter Market Revenue Share (%), by Consumption Analysis 2025 & 2033
- Figure 18: South America Azotobacter Market Revenue (million), by Import Market Analysis (Value & Volume) 2025 & 2033
- Figure 19: South America Azotobacter Market Revenue Share (%), by Import Market Analysis (Value & Volume) 2025 & 2033
- Figure 20: South America Azotobacter Market Revenue (million), by Export Market Analysis (Value & Volume) 2025 & 2033
- Figure 21: South America Azotobacter Market Revenue Share (%), by Export Market Analysis (Value & Volume) 2025 & 2033
- Figure 22: South America Azotobacter Market Revenue (million), by Price Trend Analysis 2025 & 2033
- Figure 23: South America Azotobacter Market Revenue Share (%), by Price Trend Analysis 2025 & 2033
- Figure 24: South America Azotobacter Market Revenue (million), by Country 2025 & 2033
- Figure 25: South America Azotobacter Market Revenue Share (%), by Country 2025 & 2033
- Figure 26: Europe Azotobacter Market Revenue (million), by Production Analysis 2025 & 2033
- Figure 27: Europe Azotobacter Market Revenue Share (%), by Production Analysis 2025 & 2033
- Figure 28: Europe Azotobacter Market Revenue (million), by Consumption Analysis 2025 & 2033
- Figure 29: Europe Azotobacter Market Revenue Share (%), by Consumption Analysis 2025 & 2033
- Figure 30: Europe Azotobacter Market Revenue (million), by Import Market Analysis (Value & Volume) 2025 & 2033
- Figure 31: Europe Azotobacter Market Revenue Share (%), by Import Market Analysis (Value & Volume) 2025 & 2033
- Figure 32: Europe Azotobacter Market Revenue (million), by Export Market Analysis (Value & Volume) 2025 & 2033
- Figure 33: Europe Azotobacter Market Revenue Share (%), by Export Market Analysis (Value & Volume) 2025 & 2033
- Figure 34: Europe Azotobacter Market Revenue (million), by Price Trend Analysis 2025 & 2033
- Figure 35: Europe Azotobacter Market Revenue Share (%), by Price Trend Analysis 2025 & 2033
- Figure 36: Europe Azotobacter Market Revenue (million), by Country 2025 & 2033
- Figure 37: Europe Azotobacter Market Revenue Share (%), by Country 2025 & 2033
- Figure 38: Middle East & Africa Azotobacter Market Revenue (million), by Production Analysis 2025 & 2033
- Figure 39: Middle East & Africa Azotobacter Market Revenue Share (%), by Production Analysis 2025 & 2033
- Figure 40: Middle East & Africa Azotobacter Market Revenue (million), by Consumption Analysis 2025 & 2033
- Figure 41: Middle East & Africa Azotobacter Market Revenue Share (%), by Consumption Analysis 2025 & 2033
- Figure 42: Middle East & Africa Azotobacter Market Revenue (million), by Import Market Analysis (Value & Volume) 2025 & 2033
- Figure 43: Middle East & Africa Azotobacter Market Revenue Share (%), by Import Market Analysis (Value & Volume) 2025 & 2033
- Figure 44: Middle East & Africa Azotobacter Market Revenue (million), by Export Market Analysis (Value & Volume) 2025 & 2033
- Figure 45: Middle East & Africa Azotobacter Market Revenue Share (%), by Export Market Analysis (Value & Volume) 2025 & 2033
- Figure 46: Middle East & Africa Azotobacter Market Revenue (million), by Price Trend Analysis 2025 & 2033
- Figure 47: Middle East & Africa Azotobacter Market Revenue Share (%), by Price Trend Analysis 2025 & 2033
- Figure 48: Middle East & Africa Azotobacter Market Revenue (million), by Country 2025 & 2033
- Figure 49: Middle East & Africa Azotobacter Market Revenue Share (%), by Country 2025 & 2033
- Figure 50: Asia Pacific Azotobacter Market Revenue (million), by Production Analysis 2025 & 2033
- Figure 51: Asia Pacific Azotobacter Market Revenue Share (%), by Production Analysis 2025 & 2033
- Figure 52: Asia Pacific Azotobacter Market Revenue (million), by Consumption Analysis 2025 & 2033
- Figure 53: Asia Pacific Azotobacter Market Revenue Share (%), by Consumption Analysis 2025 & 2033
- Figure 54: Asia Pacific Azotobacter Market Revenue (million), by Import Market Analysis (Value & Volume) 2025 & 2033
- Figure 55: Asia Pacific Azotobacter Market Revenue Share (%), by Import Market Analysis (Value & Volume) 2025 & 2033
- Figure 56: Asia Pacific Azotobacter Market Revenue (million), by Export Market Analysis (Value & Volume) 2025 & 2033
- Figure 57: Asia Pacific Azotobacter Market Revenue Share (%), by Export Market Analysis (Value & Volume) 2025 & 2033
- Figure 58: Asia Pacific Azotobacter Market Revenue (million), by Price Trend Analysis 2025 & 2033
- Figure 59: Asia Pacific Azotobacter Market Revenue Share (%), by Price Trend Analysis 2025 & 2033
- Figure 60: Asia Pacific Azotobacter Market Revenue (million), by Country 2025 & 2033
- Figure 61: Asia Pacific Azotobacter Market Revenue Share (%), by Country 2025 & 2033
List of Tables
- Table 1: Global Azotobacter Market Revenue million Forecast, by Production Analysis 2020 & 2033
- Table 2: Global Azotobacter Market Revenue million Forecast, by Consumption Analysis 2020 & 2033
- Table 3: Global Azotobacter Market Revenue million Forecast, by Import Market Analysis (Value & Volume) 2020 & 2033
- Table 4: Global Azotobacter Market Revenue million Forecast, by Export Market Analysis (Value & Volume) 2020 & 2033
- Table 5: Global Azotobacter Market Revenue million Forecast, by Price Trend Analysis 2020 & 2033
- Table 6: Global Azotobacter Market Revenue million Forecast, by Region 2020 & 2033
- Table 7: Global Azotobacter Market Revenue million Forecast, by Production Analysis 2020 & 2033
- Table 8: Global Azotobacter Market Revenue million Forecast, by Consumption Analysis 2020 & 2033
- Table 9: Global Azotobacter Market Revenue million Forecast, by Import Market Analysis (Value & Volume) 2020 & 2033
- Table 10: Global Azotobacter Market Revenue million Forecast, by Export Market Analysis (Value & Volume) 2020 & 2033
- Table 11: Global Azotobacter Market Revenue million Forecast, by Price Trend Analysis 2020 & 2033
- Table 12: Global Azotobacter Market Revenue million Forecast, by Country 2020 & 2033
- Table 13: United States Azotobacter Market Revenue (million) Forecast, by Application 2020 & 2033
- Table 14: Canada Azotobacter Market Revenue (million) Forecast, by Application 2020 & 2033
- Table 15: Mexico Azotobacter Market Revenue (million) Forecast, by Application 2020 & 2033
- Table 16: Global Azotobacter Market Revenue million Forecast, by Production Analysis 2020 & 2033
- Table 17: Global Azotobacter Market Revenue million Forecast, by Consumption Analysis 2020 & 2033
- Table 18: Global Azotobacter Market Revenue million Forecast, by Import Market Analysis (Value & Volume) 2020 & 2033
- Table 19: Global Azotobacter Market Revenue million Forecast, by Export Market Analysis (Value & Volume) 2020 & 2033
- Table 20: Global Azotobacter Market Revenue million Forecast, by Price Trend Analysis 2020 & 2033
- Table 21: Global Azotobacter Market Revenue million Forecast, by Country 2020 & 2033
- Table 22: Brazil Azotobacter Market Revenue (million) Forecast, by Application 2020 & 2033
- Table 23: Argentina Azotobacter Market Revenue (million) Forecast, by Application 2020 & 2033
- Table 24: Rest of South America Azotobacter Market Revenue (million) Forecast, by Application 2020 & 2033
- Table 25: Global Azotobacter Market Revenue million Forecast, by Production Analysis 2020 & 2033
- Table 26: Global Azotobacter Market Revenue million Forecast, by Consumption Analysis 2020 & 2033
- Table 27: Global Azotobacter Market Revenue million Forecast, by Import Market Analysis (Value & Volume) 2020 & 2033
- Table 28: Global Azotobacter Market Revenue million Forecast, by Export Market Analysis (Value & Volume) 2020 & 2033
- Table 29: Global Azotobacter Market Revenue million Forecast, by Price Trend Analysis 2020 & 2033
- Table 30: Global Azotobacter Market Revenue million Forecast, by Country 2020 & 2033
- Table 31: United Kingdom Azotobacter Market Revenue (million) Forecast, by Application 2020 & 2033
- Table 32: Germany Azotobacter Market Revenue (million) Forecast, by Application 2020 & 2033
- Table 33: France Azotobacter Market Revenue (million) Forecast, by Application 2020 & 2033
- Table 34: Italy Azotobacter Market Revenue (million) Forecast, by Application 2020 & 2033
- Table 35: Spain Azotobacter Market Revenue (million) Forecast, by Application 2020 & 2033
- Table 36: Russia Azotobacter Market Revenue (million) Forecast, by Application 2020 & 2033
- Table 37: Benelux Azotobacter Market Revenue (million) Forecast, by Application 2020 & 2033
- Table 38: Nordics Azotobacter Market Revenue (million) Forecast, by Application 2020 & 2033
- Table 39: Rest of Europe Azotobacter Market Revenue (million) Forecast, by Application 2020 & 2033
- Table 40: Global Azotobacter Market Revenue million Forecast, by Production Analysis 2020 & 2033
- Table 41: Global Azotobacter Market Revenue million Forecast, by Consumption Analysis 2020 & 2033
- Table 42: Global Azotobacter Market Revenue million Forecast, by Import Market Analysis (Value & Volume) 2020 & 2033
- Table 43: Global Azotobacter Market Revenue million Forecast, by Export Market Analysis (Value & Volume) 2020 & 2033
- Table 44: Global Azotobacter Market Revenue million Forecast, by Price Trend Analysis 2020 & 2033
- Table 45: Global Azotobacter Market Revenue million Forecast, by Country 2020 & 2033
- Table 46: Turkey Azotobacter Market Revenue (million) Forecast, by Application 2020 & 2033
- Table 47: Israel Azotobacter Market Revenue (million) Forecast, by Application 2020 & 2033
- Table 48: GCC Azotobacter Market Revenue (million) Forecast, by Application 2020 & 2033
- Table 49: North Africa Azotobacter Market Revenue (million) Forecast, by Application 2020 & 2033
- Table 50: South Africa Azotobacter Market Revenue (million) Forecast, by Application 2020 & 2033
- Table 51: Rest of Middle East & Africa Azotobacter Market Revenue (million) Forecast, by Application 2020 & 2033
- Table 52: Global Azotobacter Market Revenue million Forecast, by Production Analysis 2020 & 2033
- Table 53: Global Azotobacter Market Revenue million Forecast, by Consumption Analysis 2020 & 2033
- Table 54: Global Azotobacter Market Revenue million Forecast, by Import Market Analysis (Value & Volume) 2020 & 2033
- Table 55: Global Azotobacter Market Revenue million Forecast, by Export Market Analysis (Value & Volume) 2020 & 2033
- Table 56: Global Azotobacter Market Revenue million Forecast, by Price Trend Analysis 2020 & 2033
- Table 57: Global Azotobacter Market Revenue million Forecast, by Country 2020 & 2033
- Table 58: China Azotobacter Market Revenue (million) Forecast, by Application 2020 & 2033
- Table 59: India Azotobacter Market Revenue (million) Forecast, by Application 2020 & 2033
- Table 60: Japan Azotobacter Market Revenue (million) Forecast, by Application 2020 & 2033
- Table 61: South Korea Azotobacter Market Revenue (million) Forecast, by Application 2020 & 2033
- Table 62: ASEAN Azotobacter Market Revenue (million) Forecast, by Application 2020 & 2033
- Table 63: Oceania Azotobacter Market Revenue (million) Forecast, by Application 2020 & 2033
- Table 64: Rest of Asia Pacific Azotobacter Market Revenue (million) Forecast, by Application 2020 & 2033
Frequently Asked Questions
1. What is the projected Compound Annual Growth Rate (CAGR) of the Azotobacter Market?
The projected CAGR is approximately 11.1%.
2. Which companies are prominent players in the Azotobacter Market?
Key companies in the market include Ezzy Bioscience Pvt Ltd, Gujarat State Fertilizers & Chemicals Ltd, National Fertilizers Limited, Indian Farmers Fertiliser Cooperative Limited, Green Vision Life Sciences, Samriddhi Crops India Pvt Ltd, Jaipur Bio Fertilizers, IPL Biologicals Limited, Indogulf BioAg LLC (Biotech Division of Indogulf Company), T Stanes and Company Limite.
3. What are the main segments of the Azotobacter Market?
The market segments include Production Analysis, Consumption Analysis, Import Market Analysis (Value & Volume), Export Market Analysis (Value & Volume), Price Trend Analysis.
4. Can you provide details about the market size?
The market size is estimated to be USD 138 million as of 2022.
5. What are some drivers contributing to market growth?
Need for Custom Product Development; Use of CROs for Regulatory Services.
6. What are the notable trends driving market growth?
Row Crops is the largest Crop Type.
7. Are there any restraints impacting market growth?
Data and Cyber Security Concerns; Lack of Experts and Professionals in this Industry.
8. Can you provide examples of recent developments in the market?
N/A
9. What pricing options are available for accessing the report?
Pricing options include single-user, multi-user, and enterprise licenses priced at USD 3800, USD 4500, and USD 5800 respectively.
10. Is the market size provided in terms of value or volume?
The market size is provided in terms of value, measured in million.
11. Are there any specific market keywords associated with the report?
Yes, the market keyword associated with the report is "Azotobacter Market," which aids in identifying and referencing the specific market segment covered.
12. How do I determine which pricing option suits my needs best?
The pricing options vary based on user requirements and access needs. Individual users may opt for single-user licenses, while businesses requiring broader access may choose multi-user or enterprise licenses for cost-effective access to the report.
13. Are there any additional resources or data provided in the Azotobacter Market report?
While the report offers comprehensive insights, it's advisable to review the specific contents or supplementary materials provided to ascertain if additional resources or data are available.
14. How can I stay updated on further developments or reports in the Azotobacter Market?
To stay informed about further developments, trends, and reports in the Azotobacter Market, consider subscribing to industry newsletters, following relevant companies and organizations, or regularly checking reputable industry news sources and publications.
Methodology
Step 1 - Identification of Relevant Samples Size from Population Database


Step 2 - Approaches for Defining Global Market Size (Value, Volume* & Price*)

Note*: In applicable scenarios
Step 3 - Data Sources
Primary Research
- Web Analytics
- Survey Reports
- Research Institute
- Latest Research Reports
- Opinion Leaders
Secondary Research
- Annual Reports
- White Paper
- Latest Press Release
- Industry Association
- Paid Database
- Investor Presentations

Step 4 - Data Triangulation
Involves using different sources of information in order to increase the validity of a study
These sources are likely to be stakeholders in a program - participants, other researchers, program staff, other community members, and so on.
Then we put all data in single framework & apply various statistical tools to find out the dynamic on the market.
During the analysis stage, feedback from the stakeholder groups would be compared to determine areas of agreement as well as areas of divergence