

Key Insights
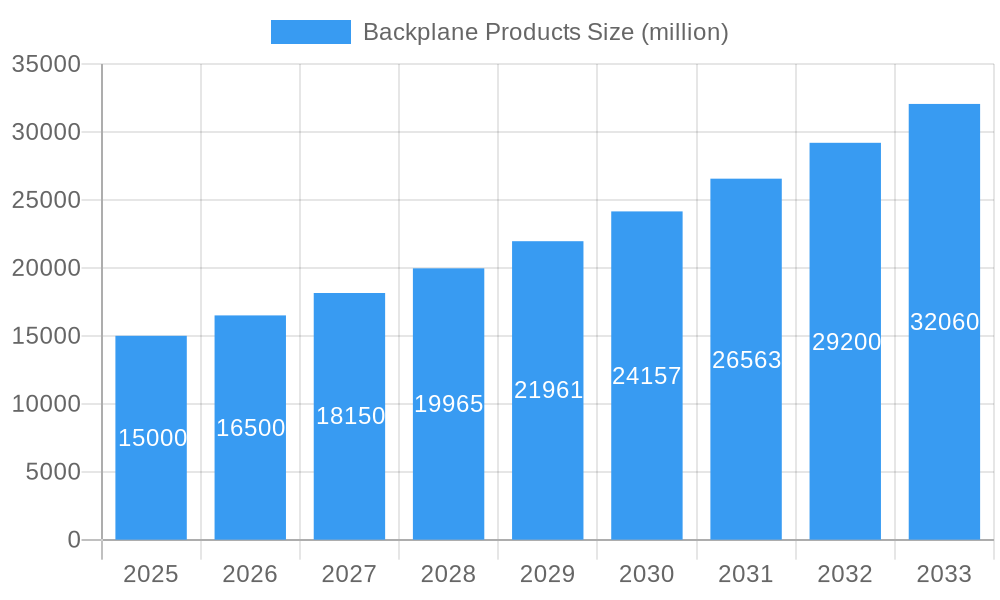
The global backplane market, a critical component for high-speed data transmission and power distribution in electronic systems, is poised for substantial expansion. Fueled by escalating demand for high-bandwidth solutions across data centers, telecommunications, and high-performance computing (HPC), the market is projected to achieve a Compound Annual Growth Rate (CAGR) of 11.56%. The market size was valued at 13.79 billion in the base year 2025 and is expected to reach new heights by 2033. Key growth catalysts include the rapid deployment of 5G networks, the pervasive influence of artificial intelligence (AI), and the continuous trend of electronic device miniaturization. Industry leaders are actively investing in R&D to innovate in material science, connector design, and manufacturing to enhance signal integrity, power efficiency, and system performance. The market is segmented by connector type, application, and region, with data centers and telecommunications currently representing the primary demand drivers.
Backplane Products Market Size (In Billion)
Despite a robust growth outlook, the backplane market faces certain challenges. Supply chain volatility, particularly concerning raw material availability, presents a notable restraint. Additionally, the increasing complexity of backplane designs necessitates significant investment in advanced manufacturing technologies and specialized talent. Nevertheless, the long-term trajectory remains optimistic, driven by the relentless advancement of digital technologies and the ever-growing demand for data across diverse industries. Innovations in high-speed interfaces, such as PCIe Gen 5 and subsequent generations, will continue to define market dynamics and present strategic opportunities for stakeholders. Consolidation through partnerships and M&A activities is anticipated to reshape the competitive arena.
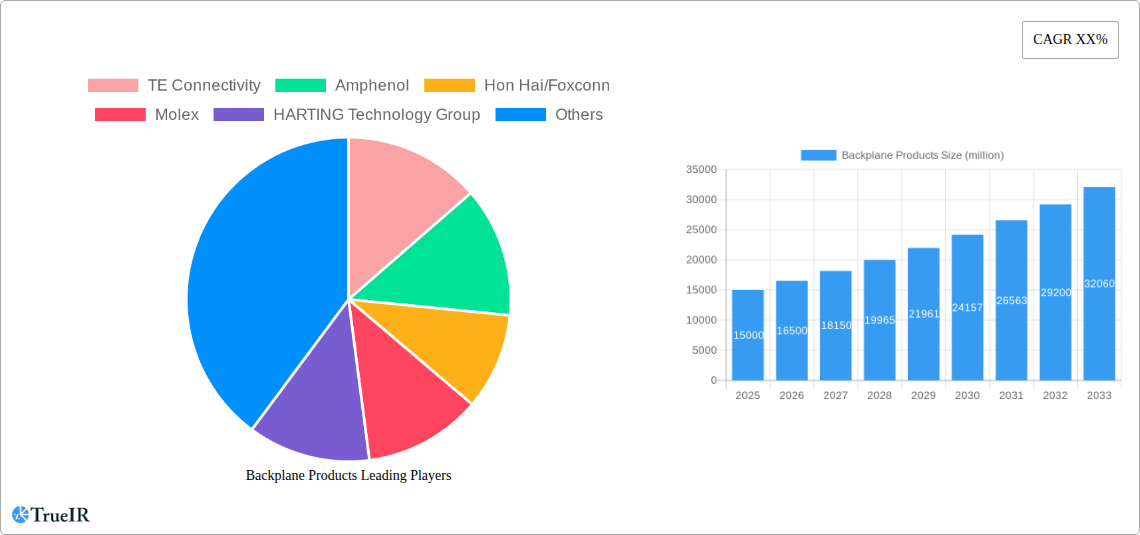
Backplane Products Company Market Share
Backplane Products Market Report: A Comprehensive Analysis (2019-2033)
This comprehensive report provides a detailed analysis of the global backplane products market, offering invaluable insights for industry stakeholders, investors, and strategic decision-makers. The study period covers 2019-2033, with a base year of 2025 and a forecast period of 2025-2033. The report leverages extensive primary and secondary research to deliver a dynamic view of the market, encompassing market size projections exceeding millions, competitive landscapes, and emerging trends.
Backplane Products Market Structure & Competitive Landscape
The global backplane products market is characterized by a moderately concentrated structure, with a few major players commanding significant market share. TE Connectivity, Amphenol, Hon Hai/Foxconn, Molex, HARTING Technology Group, Hirose Electric, JAE, METZ CONNECT, and Rosenberger are key players driving innovation and competition. The Herfindahl-Hirschman Index (HHI) for 2025 is estimated at xx, indicating a moderately concentrated market. Innovation in high-speed data transmission, miniaturization, and improved thermal management are key drivers. Regulatory compliance, particularly regarding environmental standards and safety regulations, significantly impacts market dynamics. Product substitutes, such as advanced PCB technologies, pose a competitive threat. The market is segmented by application (servers, networking, etc.) and geography. M&A activity has been moderate in recent years, with an estimated xx million USD in deal value between 2019 and 2024. Future M&A activity is expected to focus on expanding product portfolios and geographic reach.
- Market Concentration: Moderately concentrated, HHI (2025) estimated at xx.
- Innovation Drivers: High-speed data transmission, miniaturization, improved thermal management.
- Regulatory Impacts: Stringent environmental and safety standards.
- Product Substitutes: Advanced PCB technologies.
- End-User Segmentation: Servers, networking equipment, telecommunications.
- M&A Trends: Moderate activity (xx million USD between 2019-2024), expected to increase.
Backplane Products Market Trends & Opportunities
The global backplane products market is experiencing robust growth, driven by the increasing demand for high-speed data transmission and advanced computing capabilities. The market size is projected to surpass xx million units by 2033, exhibiting a Compound Annual Growth Rate (CAGR) of xx% during the forecast period. Technological advancements, such as the adoption of 5G, AI, and the Internet of Things (IoT), are significantly impacting market dynamics. Consumer preference for high-performance, energy-efficient devices further fuels market growth. The competitive landscape is intense, with key players investing heavily in R&D to maintain their market positions and capture emerging opportunities. Market penetration rates are projected to increase significantly in developing economies, owing to rapid infrastructure development and increasing adoption of advanced technologies.
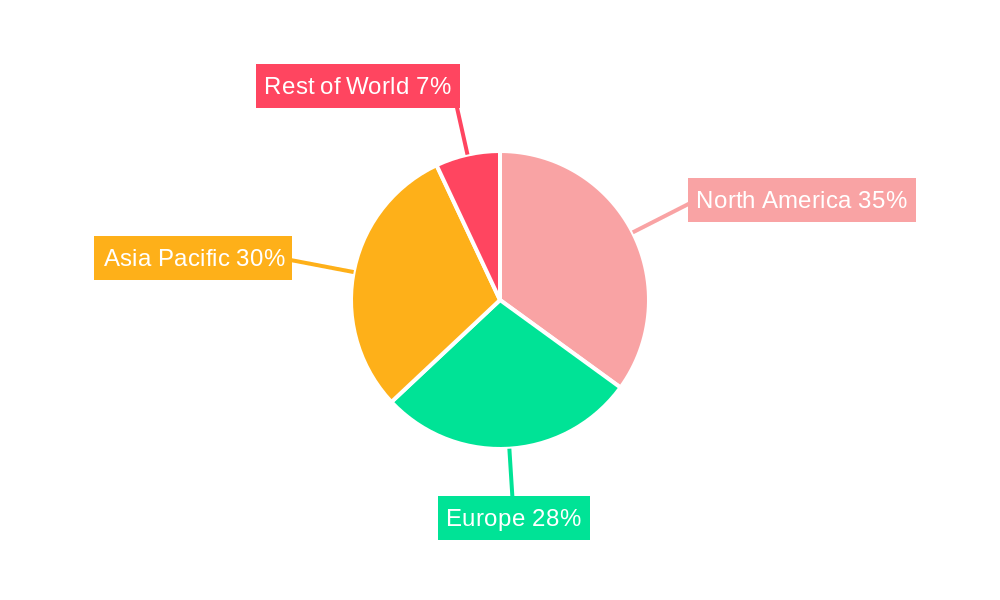
Dominant Markets & Segments in Backplane Products
The North American market currently holds a leading position in the backplane products market, accounting for approximately xx% of the global market share in 2025. This dominance is primarily attributed to the strong presence of major technology companies and a robust infrastructure supporting advanced technologies. Asia-Pacific is expected to witness the fastest growth during the forecast period, driven by increasing demand for high-speed data centers and expanding telecommunications infrastructure.
Key Growth Drivers:
- North America: Strong presence of technology companies, robust infrastructure.
- Asia-Pacific: Rapid infrastructure development, expanding telecommunications.
- Europe: Growing adoption of advanced technologies, supportive government policies.
The server segment is the largest contributor to the market, holding roughly xx% market share in 2025, followed by the networking equipment segment. Growth in these segments is directly linked to the expansion of cloud computing, data centers, and high-performance computing applications.
Backplane Products Product Analysis
The backplane product landscape is marked by continuous innovation, focusing on higher bandwidth, signal integrity, power efficiency, and miniaturization. Advances in materials science, such as the adoption of high-speed copper and optical interconnects, are improving product performance and reliability. The market sees increasing adoption of modular and customizable backplane solutions to meet diverse application requirements. These innovations provide manufacturers with a distinct competitive advantage, allowing them to offer superior performance and efficiency to end users.
Key Drivers, Barriers & Challenges in Backplane Products
Key Drivers:
- The increasing demand for high-speed data transmission and computing power is a key driver, fueled by 5G, AI, and IoT adoption.
- Government investments in infrastructure, particularly in data centers and telecommunications networks, are bolstering market growth.
- Technological advancements, like advanced materials and miniaturization techniques, are improving product capabilities.
Challenges:
- Supply chain disruptions and geopolitical factors can significantly impact the availability of raw materials and components, affecting production costs and timelines.
- Stringent regulatory compliance requirements can increase development costs and time-to-market.
- Intense competition, particularly from established players with extensive resources, poses a challenge to new entrants. This results in reduced profit margins for some players.
Growth Drivers in the Backplane Products Market
The backplane products market is propelled by technological advancements, increasing data traffic, and growing adoption of high-performance computing. The expanding cloud computing infrastructure, coupled with the proliferation of data centers, fuels demand for high-speed, reliable backplane solutions. Government initiatives promoting digital infrastructure further boost market growth. Stringent regulations promoting environmental sustainability are driving innovation in energy-efficient designs.
Challenges Impacting Backplane Products Growth
Significant challenges include supply chain complexities, particularly related to component sourcing and manufacturing capacity. Global trade tensions and geopolitical uncertainties can disrupt supply chains, increasing production costs and lead times. Moreover, intense competition among established players necessitates continuous innovation and investment in R&D to maintain a competitive edge.
Key Players Shaping the Backplane Products Market
Significant Backplane Products Industry Milestones
- 2020, Q4: TE Connectivity launched a new high-speed backplane connector series.
- 2021, Q2: Amphenol acquired a smaller backplane manufacturer, expanding its product portfolio.
- 2022, Q3: Industry-wide supply chain disruptions impacted production timelines for several manufacturers.
- 2023, Q1: Several key players announced significant investments in R&D for next-generation backplane technologies.
Future Outlook for Backplane Products Market
The backplane products market is poised for continued growth, driven by ongoing technological advancements, the expanding digital infrastructure, and the increasing demand for high-performance computing. Strategic partnerships and collaborations will play a crucial role in driving innovation and capturing market share. The market will see increased focus on sustainable and energy-efficient solutions, responding to growing environmental concerns. The long-term outlook remains positive, with significant potential for market expansion across various applications and geographies.
Backplane Products Segmentation
-
1. Application
- 1.1. Data/Communications
- 1.2. Defense
- 1.3. Medical
- 1.4. Others
-
2. Types
- 2.1. High Speed
- 2.2. Standard
Backplane Products Segmentation By Geography
-
1. North America
- 1.1. United States
- 1.2. Canada
- 1.3. Mexico
-
2. South America
- 2.1. Brazil
- 2.2. Argentina
- 2.3. Rest of South America
-
3. Europe
- 3.1. United Kingdom
- 3.2. Germany
- 3.3. France
- 3.4. Italy
- 3.5. Spain
- 3.6. Russia
- 3.7. Benelux
- 3.8. Nordics
- 3.9. Rest of Europe
-
4. Middle East & Africa
- 4.1. Turkey
- 4.2. Israel
- 4.3. GCC
- 4.4. North Africa
- 4.5. South Africa
- 4.6. Rest of Middle East & Africa
-
5. Asia Pacific
- 5.1. China
- 5.2. India
- 5.3. Japan
- 5.4. South Korea
- 5.5. ASEAN
- 5.6. Oceania
- 5.7. Rest of Asia Pacific
Backplane Products Regional Market Share
Geographic Coverage of Backplane Products
Backplane Products REPORT HIGHLIGHTS
| Aspects | Details |
|---|---|
| Study Period | 2020-2034 |
| Base Year | 2025 |
| Estimated Year | 2026 |
| Forecast Period | 2026-2034 |
| Historical Period | 2020-2025 |
| Growth Rate | CAGR of 11.56% from 2020-2034 |
| Segmentation |
|
Table of Contents
- 1. Introduction
- 1.1. Research Scope
- 1.2. Market Segmentation
- 1.3. Research Objective
- 1.4. Definitions and Assumptions
- 2. Executive Summary
- 2.1. Market Snapshot
- 3. Market Dynamics
- 3.1. Market Drivers
- 3.2. Market Restrains
- 3.3. Market Trends
- 3.4. Market Opportunities
- 4. Market Factor Analysis
- 4.1. Porters Five Forces
- 4.1.1. Bargaining Power of Suppliers
- 4.1.2. Bargaining Power of Buyers
- 4.1.3. Threat of New Entrants
- 4.1.4. Threat of Substitutes
- 4.1.5. Competitive Rivalry
- 4.2. PESTEL analysis
- 4.3. BCG Analysis
- 4.3.1. Stars (High Growth, High Market Share)
- 4.3.2. Cash Cows (Low Growth, High Market Share)
- 4.3.3. Question Mark (High Growth, Low Market Share)
- 4.3.4. Dogs (Low Growth, Low Market Share)
- 4.4. Ansoff Matrix Analysis
- 4.5. Supply Chain Analysis
- 4.6. Regulatory Landscape
- 4.7. Current Market Potential and Opportunity Assessment (TAM–SAM–SOM Framework)
- 4.8. TIR Analyst Note
- 4.1. Porters Five Forces
- 5. Market Analysis, Insights and Forecast 2021-2033
- 5.1. Market Analysis, Insights and Forecast - by Application
- 5.1.1. Data/Communications
- 5.1.2. Defense
- 5.1.3. Medical
- 5.1.4. Others
- 5.2. Market Analysis, Insights and Forecast - by Types
- 5.2.1. High Speed
- 5.2.2. Standard
- 5.3. Market Analysis, Insights and Forecast - by Region
- 5.3.1. North America
- 5.3.2. South America
- 5.3.3. Europe
- 5.3.4. Middle East & Africa
- 5.3.5. Asia Pacific
- 5.1. Market Analysis, Insights and Forecast - by Application
- 6. Global Backplane Products Analysis, Insights and Forecast, 2021-2033
- 6.1. Market Analysis, Insights and Forecast - by Application
- 6.1.1. Data/Communications
- 6.1.2. Defense
- 6.1.3. Medical
- 6.1.4. Others
- 6.2. Market Analysis, Insights and Forecast - by Types
- 6.2.1. High Speed
- 6.2.2. Standard
- 6.1. Market Analysis, Insights and Forecast - by Application
- 7. North America Backplane Products Analysis, Insights and Forecast, 2020-2032
- 7.1. Market Analysis, Insights and Forecast - by Application
- 7.1.1. Data/Communications
- 7.1.2. Defense
- 7.1.3. Medical
- 7.1.4. Others
- 7.2. Market Analysis, Insights and Forecast - by Types
- 7.2.1. High Speed
- 7.2.2. Standard
- 7.1. Market Analysis, Insights and Forecast - by Application
- 8. South America Backplane Products Analysis, Insights and Forecast, 2020-2032
- 8.1. Market Analysis, Insights and Forecast - by Application
- 8.1.1. Data/Communications
- 8.1.2. Defense
- 8.1.3. Medical
- 8.1.4. Others
- 8.2. Market Analysis, Insights and Forecast - by Types
- 8.2.1. High Speed
- 8.2.2. Standard
- 8.1. Market Analysis, Insights and Forecast - by Application
- 9. Europe Backplane Products Analysis, Insights and Forecast, 2020-2032
- 9.1. Market Analysis, Insights and Forecast - by Application
- 9.1.1. Data/Communications
- 9.1.2. Defense
- 9.1.3. Medical
- 9.1.4. Others
- 9.2. Market Analysis, Insights and Forecast - by Types
- 9.2.1. High Speed
- 9.2.2. Standard
- 9.1. Market Analysis, Insights and Forecast - by Application
- 10. Middle East & Africa Backplane Products Analysis, Insights and Forecast, 2020-2032
- 10.1. Market Analysis, Insights and Forecast - by Application
- 10.1.1. Data/Communications
- 10.1.2. Defense
- 10.1.3. Medical
- 10.1.4. Others
- 10.2. Market Analysis, Insights and Forecast - by Types
- 10.2.1. High Speed
- 10.2.2. Standard
- 10.1. Market Analysis, Insights and Forecast - by Application
- 11. Asia Pacific Backplane Products Analysis, Insights and Forecast, 2020-2032
- 11.1. Market Analysis, Insights and Forecast - by Application
- 11.1.1. Data/Communications
- 11.1.2. Defense
- 11.1.3. Medical
- 11.1.4. Others
- 11.2. Market Analysis, Insights and Forecast - by Types
- 11.2.1. High Speed
- 11.2.2. Standard
- 11.1. Market Analysis, Insights and Forecast - by Application
- 12. Competitive Analysis
- 12.1. Company Profiles
- 12.1.1 TE Connectivity
- 12.1.1.1. Company Overview
- 12.1.1.2. Products
- 12.1.1.3. Company Financials
- 12.1.1.4. SWOT Analysis
- 12.1.2 Amphenol
- 12.1.2.1. Company Overview
- 12.1.2.2. Products
- 12.1.2.3. Company Financials
- 12.1.2.4. SWOT Analysis
- 12.1.3 Hon Hai/Foxconn
- 12.1.3.1. Company Overview
- 12.1.3.2. Products
- 12.1.3.3. Company Financials
- 12.1.3.4. SWOT Analysis
- 12.1.4 Molex
- 12.1.4.1. Company Overview
- 12.1.4.2. Products
- 12.1.4.3. Company Financials
- 12.1.4.4. SWOT Analysis
- 12.1.5 HARTING Technology Group
- 12.1.5.1. Company Overview
- 12.1.5.2. Products
- 12.1.5.3. Company Financials
- 12.1.5.4. SWOT Analysis
- 12.1.6 Hirose Electric
- 12.1.6.1. Company Overview
- 12.1.6.2. Products
- 12.1.6.3. Company Financials
- 12.1.6.4. SWOT Analysis
- 12.1.7 JAE
- 12.1.7.1. Company Overview
- 12.1.7.2. Products
- 12.1.7.3. Company Financials
- 12.1.7.4. SWOT Analysis
- 12.1.8 METZ CONNECT
- 12.1.8.1. Company Overview
- 12.1.8.2. Products
- 12.1.8.3. Company Financials
- 12.1.8.4. SWOT Analysis
- 12.1.9 Rosenberger
- 12.1.9.1. Company Overview
- 12.1.9.2. Products
- 12.1.9.3. Company Financials
- 12.1.9.4. SWOT Analysis
- 12.1.1 TE Connectivity
- 12.2. Market Entropy
- 12.2.1 Company's Key Areas Served
- 12.2.2 Recent Developments
- 12.3. Company Market Share Analysis 2025
- 12.3.1 Top 5 Companies Market Share Analysis
- 12.3.2 Top 3 Companies Market Share Analysis
- 12.4. List of Potential Customers
- 13. Research Methodology
List of Figures
- Figure 1: Global Backplane Products Revenue Breakdown (billion, %) by Region 2025 & 2033
- Figure 2: North America Backplane Products Revenue (billion), by Application 2025 & 2033
- Figure 3: North America Backplane Products Revenue Share (%), by Application 2025 & 2033
- Figure 4: North America Backplane Products Revenue (billion), by Types 2025 & 2033
- Figure 5: North America Backplane Products Revenue Share (%), by Types 2025 & 2033
- Figure 6: North America Backplane Products Revenue (billion), by Country 2025 & 2033
- Figure 7: North America Backplane Products Revenue Share (%), by Country 2025 & 2033
- Figure 8: South America Backplane Products Revenue (billion), by Application 2025 & 2033
- Figure 9: South America Backplane Products Revenue Share (%), by Application 2025 & 2033
- Figure 10: South America Backplane Products Revenue (billion), by Types 2025 & 2033
- Figure 11: South America Backplane Products Revenue Share (%), by Types 2025 & 2033
- Figure 12: South America Backplane Products Revenue (billion), by Country 2025 & 2033
- Figure 13: South America Backplane Products Revenue Share (%), by Country 2025 & 2033
- Figure 14: Europe Backplane Products Revenue (billion), by Application 2025 & 2033
- Figure 15: Europe Backplane Products Revenue Share (%), by Application 2025 & 2033
- Figure 16: Europe Backplane Products Revenue (billion), by Types 2025 & 2033
- Figure 17: Europe Backplane Products Revenue Share (%), by Types 2025 & 2033
- Figure 18: Europe Backplane Products Revenue (billion), by Country 2025 & 2033
- Figure 19: Europe Backplane Products Revenue Share (%), by Country 2025 & 2033
- Figure 20: Middle East & Africa Backplane Products Revenue (billion), by Application 2025 & 2033
- Figure 21: Middle East & Africa Backplane Products Revenue Share (%), by Application 2025 & 2033
- Figure 22: Middle East & Africa Backplane Products Revenue (billion), by Types 2025 & 2033
- Figure 23: Middle East & Africa Backplane Products Revenue Share (%), by Types 2025 & 2033
- Figure 24: Middle East & Africa Backplane Products Revenue (billion), by Country 2025 & 2033
- Figure 25: Middle East & Africa Backplane Products Revenue Share (%), by Country 2025 & 2033
- Figure 26: Asia Pacific Backplane Products Revenue (billion), by Application 2025 & 2033
- Figure 27: Asia Pacific Backplane Products Revenue Share (%), by Application 2025 & 2033
- Figure 28: Asia Pacific Backplane Products Revenue (billion), by Types 2025 & 2033
- Figure 29: Asia Pacific Backplane Products Revenue Share (%), by Types 2025 & 2033
- Figure 30: Asia Pacific Backplane Products Revenue (billion), by Country 2025 & 2033
- Figure 31: Asia Pacific Backplane Products Revenue Share (%), by Country 2025 & 2033
List of Tables
- Table 1: Global Backplane Products Revenue billion Forecast, by Application 2020 & 2033
- Table 2: Global Backplane Products Revenue billion Forecast, by Types 2020 & 2033
- Table 3: Global Backplane Products Revenue billion Forecast, by Region 2020 & 2033
- Table 4: Global Backplane Products Revenue billion Forecast, by Application 2020 & 2033
- Table 5: Global Backplane Products Revenue billion Forecast, by Types 2020 & 2033
- Table 6: Global Backplane Products Revenue billion Forecast, by Country 2020 & 2033
- Table 7: United States Backplane Products Revenue (billion) Forecast, by Application 2020 & 2033
- Table 8: Canada Backplane Products Revenue (billion) Forecast, by Application 2020 & 2033
- Table 9: Mexico Backplane Products Revenue (billion) Forecast, by Application 2020 & 2033
- Table 10: Global Backplane Products Revenue billion Forecast, by Application 2020 & 2033
- Table 11: Global Backplane Products Revenue billion Forecast, by Types 2020 & 2033
- Table 12: Global Backplane Products Revenue billion Forecast, by Country 2020 & 2033
- Table 13: Brazil Backplane Products Revenue (billion) Forecast, by Application 2020 & 2033
- Table 14: Argentina Backplane Products Revenue (billion) Forecast, by Application 2020 & 2033
- Table 15: Rest of South America Backplane Products Revenue (billion) Forecast, by Application 2020 & 2033
- Table 16: Global Backplane Products Revenue billion Forecast, by Application 2020 & 2033
- Table 17: Global Backplane Products Revenue billion Forecast, by Types 2020 & 2033
- Table 18: Global Backplane Products Revenue billion Forecast, by Country 2020 & 2033
- Table 19: United Kingdom Backplane Products Revenue (billion) Forecast, by Application 2020 & 2033
- Table 20: Germany Backplane Products Revenue (billion) Forecast, by Application 2020 & 2033
- Table 21: France Backplane Products Revenue (billion) Forecast, by Application 2020 & 2033
- Table 22: Italy Backplane Products Revenue (billion) Forecast, by Application 2020 & 2033
- Table 23: Spain Backplane Products Revenue (billion) Forecast, by Application 2020 & 2033
- Table 24: Russia Backplane Products Revenue (billion) Forecast, by Application 2020 & 2033
- Table 25: Benelux Backplane Products Revenue (billion) Forecast, by Application 2020 & 2033
- Table 26: Nordics Backplane Products Revenue (billion) Forecast, by Application 2020 & 2033
- Table 27: Rest of Europe Backplane Products Revenue (billion) Forecast, by Application 2020 & 2033
- Table 28: Global Backplane Products Revenue billion Forecast, by Application 2020 & 2033
- Table 29: Global Backplane Products Revenue billion Forecast, by Types 2020 & 2033
- Table 30: Global Backplane Products Revenue billion Forecast, by Country 2020 & 2033
- Table 31: Turkey Backplane Products Revenue (billion) Forecast, by Application 2020 & 2033
- Table 32: Israel Backplane Products Revenue (billion) Forecast, by Application 2020 & 2033
- Table 33: GCC Backplane Products Revenue (billion) Forecast, by Application 2020 & 2033
- Table 34: North Africa Backplane Products Revenue (billion) Forecast, by Application 2020 & 2033
- Table 35: South Africa Backplane Products Revenue (billion) Forecast, by Application 2020 & 2033
- Table 36: Rest of Middle East & Africa Backplane Products Revenue (billion) Forecast, by Application 2020 & 2033
- Table 37: Global Backplane Products Revenue billion Forecast, by Application 2020 & 2033
- Table 38: Global Backplane Products Revenue billion Forecast, by Types 2020 & 2033
- Table 39: Global Backplane Products Revenue billion Forecast, by Country 2020 & 2033
- Table 40: China Backplane Products Revenue (billion) Forecast, by Application 2020 & 2033
- Table 41: India Backplane Products Revenue (billion) Forecast, by Application 2020 & 2033
- Table 42: Japan Backplane Products Revenue (billion) Forecast, by Application 2020 & 2033
- Table 43: South Korea Backplane Products Revenue (billion) Forecast, by Application 2020 & 2033
- Table 44: ASEAN Backplane Products Revenue (billion) Forecast, by Application 2020 & 2033
- Table 45: Oceania Backplane Products Revenue (billion) Forecast, by Application 2020 & 2033
- Table 46: Rest of Asia Pacific Backplane Products Revenue (billion) Forecast, by Application 2020 & 2033
Frequently Asked Questions
1. What is the projected Compound Annual Growth Rate (CAGR) of the Backplane Products?
The projected CAGR is approximately 11.56%.
2. Which companies are prominent players in the Backplane Products?
Key companies in the market include TE Connectivity, Amphenol, Hon Hai/Foxconn, Molex, HARTING Technology Group, Hirose Electric, JAE, METZ CONNECT, Rosenberger.
3. What are the main segments of the Backplane Products?
The market segments include Application, Types.
4. Can you provide details about the market size?
The market size is estimated to be USD 13.79 billion as of 2022.
5. What are some drivers contributing to market growth?
N/A
6. What are the notable trends driving market growth?
N/A
7. Are there any restraints impacting market growth?
N/A
8. Can you provide examples of recent developments in the market?
N/A
9. What pricing options are available for accessing the report?
Pricing options include single-user, multi-user, and enterprise licenses priced at USD 2900.00, USD 4350.00, and USD 5800.00 respectively.
10. Is the market size provided in terms of value or volume?
The market size is provided in terms of value, measured in billion.
11. Are there any specific market keywords associated with the report?
Yes, the market keyword associated with the report is "Backplane Products," which aids in identifying and referencing the specific market segment covered.
12. How do I determine which pricing option suits my needs best?
The pricing options vary based on user requirements and access needs. Individual users may opt for single-user licenses, while businesses requiring broader access may choose multi-user or enterprise licenses for cost-effective access to the report.
13. Are there any additional resources or data provided in the Backplane Products report?
While the report offers comprehensive insights, it's advisable to review the specific contents or supplementary materials provided to ascertain if additional resources or data are available.
14. How can I stay updated on further developments or reports in the Backplane Products?
To stay informed about further developments, trends, and reports in the Backplane Products, consider subscribing to industry newsletters, following relevant companies and organizations, or regularly checking reputable industry news sources and publications.
Methodology
Step 1 - Identification of Relevant Samples Size from Population Database


Step 2 - Approaches for Defining Global Market Size (Value, Volume* & Price*)

Note*: In applicable scenarios
Step 3 - Data Sources
Primary Research
- Web Analytics
- Survey Reports
- Research Institute
- Latest Research Reports
- Opinion Leaders
Secondary Research
- Annual Reports
- White Paper
- Latest Press Release
- Industry Association
- Paid Database
- Investor Presentations

Step 4 - Data Triangulation
Involves using different sources of information in order to increase the validity of a study
These sources are likely to be stakeholders in a program - participants, other researchers, program staff, other community members, and so on.
Then we put all data in single framework & apply various statistical tools to find out the dynamic on the market.
During the analysis stage, feedback from the stakeholder groups would be compared to determine areas of agreement as well as areas of divergence