

Key Insights
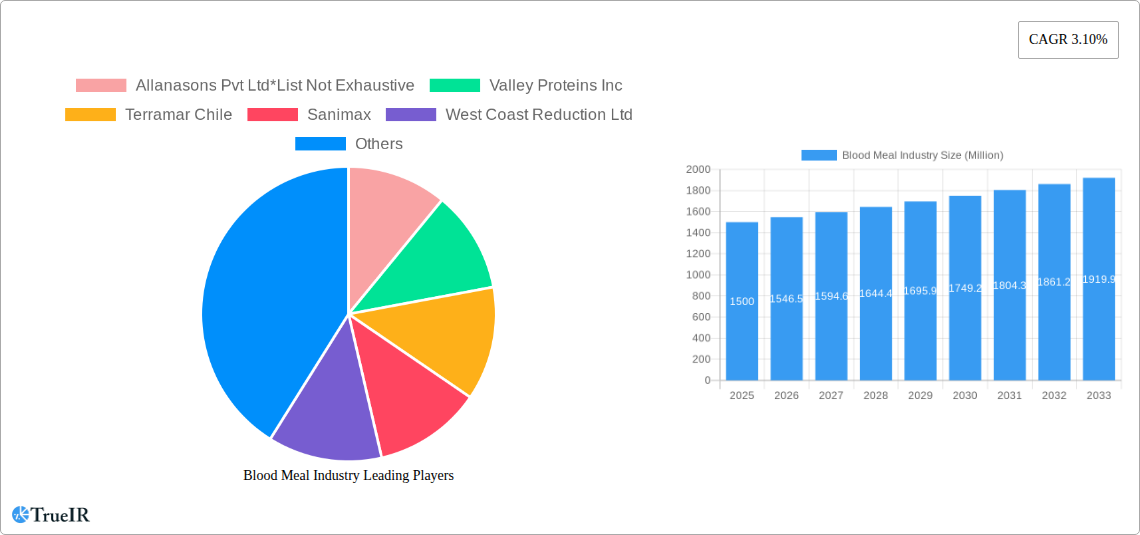
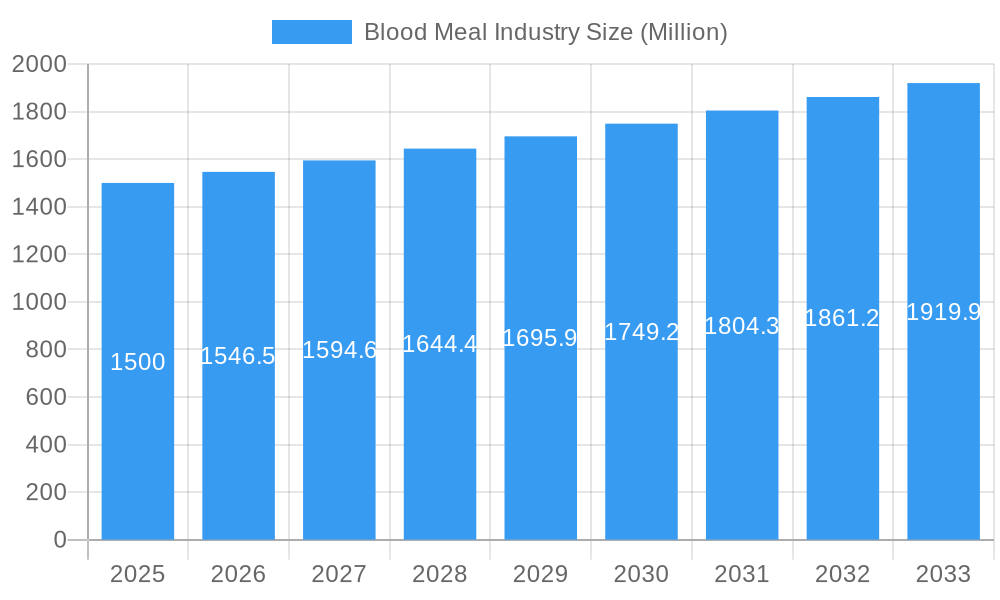
The global blood meal market, valued at approximately $1.29 billion in 2025, is poised for consistent expansion, fueled by the escalating demand for sustainable and economical animal feed and organic fertilizers. A Compound Annual Growth Rate (CAGR) of 3.63% from 2025 to 2033 underscores a steady trajectory of market growth. Key growth catalysts include the increasing global population driving demand for protein-rich animal feed, heightened awareness of blood meal's environmental advantages as an organic fertilizer alternative to synthetic options, and its proven effectiveness as a natural pest deterrent in agricultural settings. The market is segmented by source (porcine, poultry, ruminant blood) and application (poultry feed, porcine feed, ruminant feed, aqua feed, natural pest deterrent, organic fertilizer). While poultry feed currently dominates, the aqua feed segment is projected for significant growth due to the expanding aquaculture industry. Regional market sizes are influenced by livestock populations and agricultural practices. North America and Europe currently lead, but the Asia-Pacific region is expected to experience substantial growth, driven by its expanding livestock sector and increasing adoption of sustainable agricultural practices. Potential restraints include regulatory complexities in processing and usage, alongside raw material price volatility. Competitive forces from established entities like Allanasons Pvt Ltd, Valley Proteins Inc, and Darling Ingredients, alongside emerging regional players, are shaping market dynamics.
Blood Meal Industry Market Size (In Billion)
The forecast period (2025-2033) offers strategic opportunities for market participants. Collaborations and partnerships are anticipated to enhance distribution networks and market access. Investment in research and development for improved processing techniques and novel applications will be critical. Highlighting blood meal's environmental benefits and sustainability credentials will resonate with eco-conscious consumers and businesses. Companies prioritizing product quality, consistency, and regulatory compliance will be best positioned for market share growth. This sustained expansion, despite challenges, reaffirms blood meal's essential role in animal nutrition and agriculture, ensuring its enduring relevance in an increasingly resource-conscious global landscape.
Blood Meal Industry Company Market Share
Blood Meal Industry Market Report: 2019-2033
This comprehensive report provides a detailed analysis of the global blood meal industry, offering invaluable insights for businesses, investors, and researchers. Covering the period from 2019 to 2033, with a focus on 2025, this report meticulously examines market size, segmentation, competitive dynamics, and future growth potential. The report projects a market size of xx Million by 2033, driven by increasing demand in animal feed and other applications.
Blood Meal Industry Market Structure & Competitive Landscape
The blood meal industry exhibits a moderately concentrated market structure, with several key players dominating global production and distribution. The Herfindahl-Hirschman Index (HHI) for the industry is estimated at xx, indicating a moderately competitive landscape. Innovation is a significant driver, with companies continually seeking to improve production efficiency and explore new applications for blood meal. Regulatory impacts vary across regions, influenced by animal feed regulations, waste management policies, and environmental concerns. Product substitutes, such as soybean meal and other protein sources, exert competitive pressure. End-user segmentation is primarily driven by the animal feed industry, with poultry, porcine, and ruminant feed segments being the most significant. The industry experiences considerable M&A activity, as evidenced by recent acquisitions, with a total estimated M&A volume of xx Million USD in the last five years. This activity reflects the consolidation efforts of major players and the search for increased market share and diversification.
- Market Concentration: Moderately concentrated, with a HHI of xx.
- Innovation Drivers: Improved production efficiency, new applications, sustainable sourcing.
- Regulatory Impacts: Vary across regions; influenced by animal feed, waste management, and environmental regulations.
- Product Substitutes: Soybean meal, other protein sources.
- End-User Segmentation: Poultry feed, porcine feed, ruminant feed, aqua feed, natural pest deterrent, organic fertilizer.
- M&A Trends: Significant activity, driven by consolidation and diversification.
Blood Meal Industry Market Trends & Opportunities
The global blood meal market is experiencing robust growth, driven by rising demand for protein-rich animal feed, growing awareness of its sustainable nature as a byproduct, and increasing applications in organic fertilizers and pest deterrents. The market witnessed a CAGR of xx% during the historical period (2019-2024) and is projected to maintain a CAGR of xx% during the forecast period (2025-2033). This growth is fueled by several factors including the rising global population, increasing demand for animal protein, and the growing adoption of sustainable agricultural practices. Technological advancements in blood meal processing are improving product quality and efficiency, further enhancing its market appeal. Consumer preferences are shifting towards more sustainable and environmentally friendly products, which favors the adoption of blood meal as a natural and eco-friendly alternative to synthetic fertilizers and pesticides. The competitive landscape is dynamic, with both established players and new entrants vying for market share, leading to product innovation and price competition. Market penetration rates are expected to increase significantly in developing economies, driven by growing livestock populations and increasing awareness of blood meal’s benefits.
Dominant Markets & Segments in Blood Meal Industry
The dominant markets and segments within the blood meal industry are influenced by factors such as livestock population, agricultural practices, and regulatory frameworks. While precise market share data requires further investigation, initial indications suggest that the poultry feed segment is currently the largest application, followed by porcine feed and ruminant feed. Among sources, porcine blood and poultry blood are the dominant sources, providing the largest volume of blood meal. Geographically, regions with large livestock populations and established animal feed industries, such as North America and Europe, tend to dominate the market.
- Key Growth Drivers (Poultry Feed Segment): Increased poultry production, growing demand for cost-effective feed solutions.
- Key Growth Drivers (Porcine Blood Source): High availability of porcine blood from slaughterhouses, efficient processing technologies.
- Market Dominance Analysis: North America and Europe currently hold significant market share, due to established animal feed industries and high livestock populations.
Blood Meal Industry Product Analysis
Blood meal products are increasingly differentiated by processing techniques, resulting in variations in protein content, nutrient profiles, and overall quality. Technological advancements are improving the efficiency of blood meal production, leading to more standardized and consistent products. This enhances the reliability of blood meal as a key ingredient in various applications, ranging from animal feed to fertilizers. The focus on improving sustainability and reducing environmental impact is driving the development of eco-friendly processing methods and reducing reliance on traditional methods with higher carbon emissions.
Key Drivers, Barriers & Challenges in Blood Meal Industry
Key Drivers: The increasing demand for sustainable and cost-effective animal feed is a primary driver for the growth of the blood meal industry. Government incentives and subsidies for sustainable agricultural practices and improved processing technologies are further propelling market expansion. The growing recognition of blood meal as a valuable fertilizer is also contributing to its market growth.
Challenges: Fluctuations in raw material availability and prices, stringent regulations surrounding waste management and animal feed safety, and competition from other protein sources are major challenges impacting market growth. Supply chain disruptions, particularly those experienced during the pandemic, significantly affected the industry’s stability and highlighted the vulnerability to external shocks.
Growth Drivers in the Blood Meal Industry Market
The blood meal industry's growth is fueled by several key factors. Technological advancements in blood collection, processing and preservation are improving the quality and efficiency of production, making blood meal more competitive. The increasing demand for sustainable alternatives in animal feed and agriculture presents a massive opportunity for growth. Favorable government policies promoting sustainable agriculture and waste management are also contributing positively.
Challenges Impacting Blood Meal Industry Growth
Significant challenges to growth include inconsistent regulations across different regions, making it difficult for companies to navigate the approval processes and standards for blood meal use. Fluctuations in the supply of raw materials, due to factors such as seasonal variations in livestock production and the reliance on a byproduct stream, also lead to unpredictable prices and production volumes. The industry faces strong competition from other protein sources, forcing companies to constantly improve product quality and cost-efficiency.
Key Players Shaping the Blood Meal Industry Market
- Allanasons Pvt Ltd List Not Exhaustive
- Valley Proteins Inc
- Terramar Chile
- Sanimax
- West Coast Reduction Ltd
- Darling Ingredients
- Boyer Valley Company LLC
- Agro-industrial Complex Backa Topola LTD
- The Fetrell Company
Significant Blood Meal Industry Milestones
- May 2022: Darling Ingredients acquired Fasa Group for USD 560 Million, significantly expanding its global presence and product offerings.
- January 2020: Darling Ingredients acquired 100% equity in EnviroFlight, boosting its investment in innovative specialty proteins and feed sustainability.
Future Outlook for Blood Meal Industry Market
The blood meal market is poised for continued growth, driven by increasing demand for sustainable animal feed and fertilizer alternatives. Strategic opportunities exist in expanding into new geographical markets, developing innovative product applications, and improving supply chain efficiency. The market is expected to see increased consolidation through mergers and acquisitions, leading to greater industry efficiency and market dominance by larger companies. The overall outlook for the blood meal industry remains optimistic, with substantial growth potential in the coming years.
Blood Meal Industry Segmentation
- 1. Production Analysis
- 2. Consumption Analysis
- 3. Import Market Analysis (Value & Volume)
- 4. Export Market Analysis (Value & Volume)
- 5. Price Trend Analysis
Blood Meal Industry Segmentation By Geography
-
1. North America
- 1.1. United States
- 1.2. Canada
- 1.3. Mexico
-
2. South America
- 2.1. Brazil
- 2.2. Argentina
- 2.3. Rest of South America
-
3. Europe
- 3.1. United Kingdom
- 3.2. Germany
- 3.3. France
- 3.4. Italy
- 3.5. Spain
- 3.6. Russia
- 3.7. Benelux
- 3.8. Nordics
- 3.9. Rest of Europe
-
4. Middle East & Africa
- 4.1. Turkey
- 4.2. Israel
- 4.3. GCC
- 4.4. North Africa
- 4.5. South Africa
- 4.6. Rest of Middle East & Africa
-
5. Asia Pacific
- 5.1. China
- 5.2. India
- 5.3. Japan
- 5.4. South Korea
- 5.5. ASEAN
- 5.6. Oceania
- 5.7. Rest of Asia Pacific
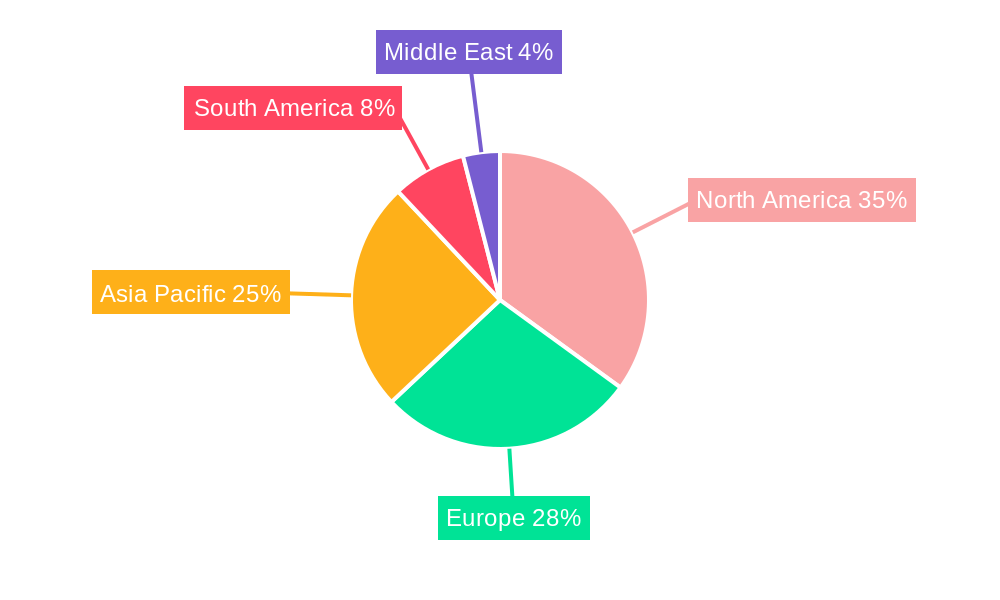
Blood Meal Industry Regional Market Share
Geographic Coverage of Blood Meal Industry
Blood Meal Industry REPORT HIGHLIGHTS
| Aspects | Details |
|---|---|
| Study Period | 2020-2034 |
| Base Year | 2025 |
| Estimated Year | 2026 |
| Forecast Period | 2026-2034 |
| Historical Period | 2020-2025 |
| Growth Rate | CAGR of 3.63% from 2020-2034 |
| Segmentation |
|
Table of Contents
- 1. Introduction
- 1.1. Research Scope
- 1.2. Market Segmentation
- 1.3. Research Objective
- 1.4. Definitions and Assumptions
- 2. Executive Summary
- 2.1. Market Snapshot
- 3. Market Dynamics
- 3.1. Market Drivers
- 3.2. Market Restrains
- 3.3. Market Trends
- 3.4. Market Opportunities
- 4. Market Factor Analysis
- 4.1. Porters Five Forces
- 4.1.1. Bargaining Power of Suppliers
- 4.1.2. Bargaining Power of Buyers
- 4.1.3. Threat of New Entrants
- 4.1.4. Threat of Substitutes
- 4.1.5. Competitive Rivalry
- 4.2. PESTEL analysis
- 4.3. BCG Analysis
- 4.3.1. Stars (High Growth, High Market Share)
- 4.3.2. Cash Cows (Low Growth, High Market Share)
- 4.3.3. Question Mark (High Growth, Low Market Share)
- 4.3.4. Dogs (Low Growth, Low Market Share)
- 4.4. Ansoff Matrix Analysis
- 4.5. Supply Chain Analysis
- 4.6. Regulatory Landscape
- 4.7. Current Market Potential and Opportunity Assessment (TAM–SAM–SOM Framework)
- 4.8. TIR Analyst Note
- 4.1. Porters Five Forces
- 5. Market Analysis, Insights and Forecast 2021-2033
- 5.1. Market Analysis, Insights and Forecast - by Production Analysis
- 5.2. Market Analysis, Insights and Forecast - by Consumption Analysis
- 5.3. Market Analysis, Insights and Forecast - by Import Market Analysis (Value & Volume)
- 5.4. Market Analysis, Insights and Forecast - by Export Market Analysis (Value & Volume)
- 5.5. Market Analysis, Insights and Forecast - by Price Trend Analysis
- 5.6. Market Analysis, Insights and Forecast - by Region
- 5.6.1. North America
- 5.6.2. South America
- 5.6.3. Europe
- 5.6.4. Middle East & Africa
- 5.6.5. Asia Pacific
- 6. Global Blood Meal Industry Analysis, Insights and Forecast, 2021-2033
- 6.1. Market Analysis, Insights and Forecast - by Production Analysis
- 6.2. Market Analysis, Insights and Forecast - by Consumption Analysis
- 6.3. Market Analysis, Insights and Forecast - by Import Market Analysis (Value & Volume)
- 6.4. Market Analysis, Insights and Forecast - by Export Market Analysis (Value & Volume)
- 6.5. Market Analysis, Insights and Forecast - by Price Trend Analysis
- 7. North America Blood Meal Industry Analysis, Insights and Forecast, 2020-2032
- 7.1. Market Analysis, Insights and Forecast - by Production Analysis
- 7.2. Market Analysis, Insights and Forecast - by Consumption Analysis
- 7.3. Market Analysis, Insights and Forecast - by Import Market Analysis (Value & Volume)
- 7.4. Market Analysis, Insights and Forecast - by Export Market Analysis (Value & Volume)
- 7.5. Market Analysis, Insights and Forecast - by Price Trend Analysis
- 8. South America Blood Meal Industry Analysis, Insights and Forecast, 2020-2032
- 8.1. Market Analysis, Insights and Forecast - by Production Analysis
- 8.2. Market Analysis, Insights and Forecast - by Consumption Analysis
- 8.3. Market Analysis, Insights and Forecast - by Import Market Analysis (Value & Volume)
- 8.4. Market Analysis, Insights and Forecast - by Export Market Analysis (Value & Volume)
- 8.5. Market Analysis, Insights and Forecast - by Price Trend Analysis
- 9. Europe Blood Meal Industry Analysis, Insights and Forecast, 2020-2032
- 9.1. Market Analysis, Insights and Forecast - by Production Analysis
- 9.2. Market Analysis, Insights and Forecast - by Consumption Analysis
- 9.3. Market Analysis, Insights and Forecast - by Import Market Analysis (Value & Volume)
- 9.4. Market Analysis, Insights and Forecast - by Export Market Analysis (Value & Volume)
- 9.5. Market Analysis, Insights and Forecast - by Price Trend Analysis
- 10. Middle East & Africa Blood Meal Industry Analysis, Insights and Forecast, 2020-2032
- 10.1. Market Analysis, Insights and Forecast - by Production Analysis
- 10.2. Market Analysis, Insights and Forecast - by Consumption Analysis
- 10.3. Market Analysis, Insights and Forecast - by Import Market Analysis (Value & Volume)
- 10.4. Market Analysis, Insights and Forecast - by Export Market Analysis (Value & Volume)
- 10.5. Market Analysis, Insights and Forecast - by Price Trend Analysis
- 11. Asia Pacific Blood Meal Industry Analysis, Insights and Forecast, 2020-2032
- 11.1. Market Analysis, Insights and Forecast - by Production Analysis
- 11.2. Market Analysis, Insights and Forecast - by Consumption Analysis
- 11.3. Market Analysis, Insights and Forecast - by Import Market Analysis (Value & Volume)
- 11.4. Market Analysis, Insights and Forecast - by Export Market Analysis (Value & Volume)
- 11.5. Market Analysis, Insights and Forecast - by Price Trend Analysis
- 12. Competitive Analysis
- 12.1. Company Profiles
- 12.1.1 Allanasons Pvt Ltd*List Not Exhaustive
- 12.1.1.1. Company Overview
- 12.1.1.2. Products
- 12.1.1.3. Company Financials
- 12.1.1.4. SWOT Analysis
- 12.1.2 Valley Proteins Inc
- 12.1.2.1. Company Overview
- 12.1.2.2. Products
- 12.1.2.3. Company Financials
- 12.1.2.4. SWOT Analysis
- 12.1.3 Terramar Chile
- 12.1.3.1. Company Overview
- 12.1.3.2. Products
- 12.1.3.3. Company Financials
- 12.1.3.4. SWOT Analysis
- 12.1.4 Sanimax
- 12.1.4.1. Company Overview
- 12.1.4.2. Products
- 12.1.4.3. Company Financials
- 12.1.4.4. SWOT Analysis
- 12.1.5 West Coast Reduction Ltd
- 12.1.5.1. Company Overview
- 12.1.5.2. Products
- 12.1.5.3. Company Financials
- 12.1.5.4. SWOT Analysis
- 12.1.6 Darling Ingredients
- 12.1.6.1. Company Overview
- 12.1.6.2. Products
- 12.1.6.3. Company Financials
- 12.1.6.4. SWOT Analysis
- 12.1.7 Boyer Valley Company LLC
- 12.1.7.1. Company Overview
- 12.1.7.2. Products
- 12.1.7.3. Company Financials
- 12.1.7.4. SWOT Analysis
- 12.1.8 Agro-industrial Complex Backa Topola LTD
- 12.1.8.1. Company Overview
- 12.1.8.2. Products
- 12.1.8.3. Company Financials
- 12.1.8.4. SWOT Analysis
- 12.1.9 The Fetrell Company
- 12.1.9.1. Company Overview
- 12.1.9.2. Products
- 12.1.9.3. Company Financials
- 12.1.9.4. SWOT Analysis
- 12.1.1 Allanasons Pvt Ltd*List Not Exhaustive
- 12.2. Market Entropy
- 12.2.1 Company's Key Areas Served
- 12.2.2 Recent Developments
- 12.3. Company Market Share Analysis 2025
- 12.3.1 Top 5 Companies Market Share Analysis
- 12.3.2 Top 3 Companies Market Share Analysis
- 12.4. List of Potential Customers
- 13. Research Methodology
List of Figures
- Figure 1: Global Blood Meal Industry Revenue Breakdown (billion, %) by Region 2025 & 2033
- Figure 2: North America Blood Meal Industry Revenue (billion), by Production Analysis 2025 & 2033
- Figure 3: North America Blood Meal Industry Revenue Share (%), by Production Analysis 2025 & 2033
- Figure 4: North America Blood Meal Industry Revenue (billion), by Consumption Analysis 2025 & 2033
- Figure 5: North America Blood Meal Industry Revenue Share (%), by Consumption Analysis 2025 & 2033
- Figure 6: North America Blood Meal Industry Revenue (billion), by Import Market Analysis (Value & Volume) 2025 & 2033
- Figure 7: North America Blood Meal Industry Revenue Share (%), by Import Market Analysis (Value & Volume) 2025 & 2033
- Figure 8: North America Blood Meal Industry Revenue (billion), by Export Market Analysis (Value & Volume) 2025 & 2033
- Figure 9: North America Blood Meal Industry Revenue Share (%), by Export Market Analysis (Value & Volume) 2025 & 2033
- Figure 10: North America Blood Meal Industry Revenue (billion), by Price Trend Analysis 2025 & 2033
- Figure 11: North America Blood Meal Industry Revenue Share (%), by Price Trend Analysis 2025 & 2033
- Figure 12: North America Blood Meal Industry Revenue (billion), by Country 2025 & 2033
- Figure 13: North America Blood Meal Industry Revenue Share (%), by Country 2025 & 2033
- Figure 14: South America Blood Meal Industry Revenue (billion), by Production Analysis 2025 & 2033
- Figure 15: South America Blood Meal Industry Revenue Share (%), by Production Analysis 2025 & 2033
- Figure 16: South America Blood Meal Industry Revenue (billion), by Consumption Analysis 2025 & 2033
- Figure 17: South America Blood Meal Industry Revenue Share (%), by Consumption Analysis 2025 & 2033
- Figure 18: South America Blood Meal Industry Revenue (billion), by Import Market Analysis (Value & Volume) 2025 & 2033
- Figure 19: South America Blood Meal Industry Revenue Share (%), by Import Market Analysis (Value & Volume) 2025 & 2033
- Figure 20: South America Blood Meal Industry Revenue (billion), by Export Market Analysis (Value & Volume) 2025 & 2033
- Figure 21: South America Blood Meal Industry Revenue Share (%), by Export Market Analysis (Value & Volume) 2025 & 2033
- Figure 22: South America Blood Meal Industry Revenue (billion), by Price Trend Analysis 2025 & 2033
- Figure 23: South America Blood Meal Industry Revenue Share (%), by Price Trend Analysis 2025 & 2033
- Figure 24: South America Blood Meal Industry Revenue (billion), by Country 2025 & 2033
- Figure 25: South America Blood Meal Industry Revenue Share (%), by Country 2025 & 2033
- Figure 26: Europe Blood Meal Industry Revenue (billion), by Production Analysis 2025 & 2033
- Figure 27: Europe Blood Meal Industry Revenue Share (%), by Production Analysis 2025 & 2033
- Figure 28: Europe Blood Meal Industry Revenue (billion), by Consumption Analysis 2025 & 2033
- Figure 29: Europe Blood Meal Industry Revenue Share (%), by Consumption Analysis 2025 & 2033
- Figure 30: Europe Blood Meal Industry Revenue (billion), by Import Market Analysis (Value & Volume) 2025 & 2033
- Figure 31: Europe Blood Meal Industry Revenue Share (%), by Import Market Analysis (Value & Volume) 2025 & 2033
- Figure 32: Europe Blood Meal Industry Revenue (billion), by Export Market Analysis (Value & Volume) 2025 & 2033
- Figure 33: Europe Blood Meal Industry Revenue Share (%), by Export Market Analysis (Value & Volume) 2025 & 2033
- Figure 34: Europe Blood Meal Industry Revenue (billion), by Price Trend Analysis 2025 & 2033
- Figure 35: Europe Blood Meal Industry Revenue Share (%), by Price Trend Analysis 2025 & 2033
- Figure 36: Europe Blood Meal Industry Revenue (billion), by Country 2025 & 2033
- Figure 37: Europe Blood Meal Industry Revenue Share (%), by Country 2025 & 2033
- Figure 38: Middle East & Africa Blood Meal Industry Revenue (billion), by Production Analysis 2025 & 2033
- Figure 39: Middle East & Africa Blood Meal Industry Revenue Share (%), by Production Analysis 2025 & 2033
- Figure 40: Middle East & Africa Blood Meal Industry Revenue (billion), by Consumption Analysis 2025 & 2033
- Figure 41: Middle East & Africa Blood Meal Industry Revenue Share (%), by Consumption Analysis 2025 & 2033
- Figure 42: Middle East & Africa Blood Meal Industry Revenue (billion), by Import Market Analysis (Value & Volume) 2025 & 2033
- Figure 43: Middle East & Africa Blood Meal Industry Revenue Share (%), by Import Market Analysis (Value & Volume) 2025 & 2033
- Figure 44: Middle East & Africa Blood Meal Industry Revenue (billion), by Export Market Analysis (Value & Volume) 2025 & 2033
- Figure 45: Middle East & Africa Blood Meal Industry Revenue Share (%), by Export Market Analysis (Value & Volume) 2025 & 2033
- Figure 46: Middle East & Africa Blood Meal Industry Revenue (billion), by Price Trend Analysis 2025 & 2033
- Figure 47: Middle East & Africa Blood Meal Industry Revenue Share (%), by Price Trend Analysis 2025 & 2033
- Figure 48: Middle East & Africa Blood Meal Industry Revenue (billion), by Country 2025 & 2033
- Figure 49: Middle East & Africa Blood Meal Industry Revenue Share (%), by Country 2025 & 2033
- Figure 50: Asia Pacific Blood Meal Industry Revenue (billion), by Production Analysis 2025 & 2033
- Figure 51: Asia Pacific Blood Meal Industry Revenue Share (%), by Production Analysis 2025 & 2033
- Figure 52: Asia Pacific Blood Meal Industry Revenue (billion), by Consumption Analysis 2025 & 2033
- Figure 53: Asia Pacific Blood Meal Industry Revenue Share (%), by Consumption Analysis 2025 & 2033
- Figure 54: Asia Pacific Blood Meal Industry Revenue (billion), by Import Market Analysis (Value & Volume) 2025 & 2033
- Figure 55: Asia Pacific Blood Meal Industry Revenue Share (%), by Import Market Analysis (Value & Volume) 2025 & 2033
- Figure 56: Asia Pacific Blood Meal Industry Revenue (billion), by Export Market Analysis (Value & Volume) 2025 & 2033
- Figure 57: Asia Pacific Blood Meal Industry Revenue Share (%), by Export Market Analysis (Value & Volume) 2025 & 2033
- Figure 58: Asia Pacific Blood Meal Industry Revenue (billion), by Price Trend Analysis 2025 & 2033
- Figure 59: Asia Pacific Blood Meal Industry Revenue Share (%), by Price Trend Analysis 2025 & 2033
- Figure 60: Asia Pacific Blood Meal Industry Revenue (billion), by Country 2025 & 2033
- Figure 61: Asia Pacific Blood Meal Industry Revenue Share (%), by Country 2025 & 2033
List of Tables
- Table 1: Global Blood Meal Industry Revenue billion Forecast, by Production Analysis 2020 & 2033
- Table 2: Global Blood Meal Industry Revenue billion Forecast, by Consumption Analysis 2020 & 2033
- Table 3: Global Blood Meal Industry Revenue billion Forecast, by Import Market Analysis (Value & Volume) 2020 & 2033
- Table 4: Global Blood Meal Industry Revenue billion Forecast, by Export Market Analysis (Value & Volume) 2020 & 2033
- Table 5: Global Blood Meal Industry Revenue billion Forecast, by Price Trend Analysis 2020 & 2033
- Table 6: Global Blood Meal Industry Revenue billion Forecast, by Region 2020 & 2033
- Table 7: Global Blood Meal Industry Revenue billion Forecast, by Production Analysis 2020 & 2033
- Table 8: Global Blood Meal Industry Revenue billion Forecast, by Consumption Analysis 2020 & 2033
- Table 9: Global Blood Meal Industry Revenue billion Forecast, by Import Market Analysis (Value & Volume) 2020 & 2033
- Table 10: Global Blood Meal Industry Revenue billion Forecast, by Export Market Analysis (Value & Volume) 2020 & 2033
- Table 11: Global Blood Meal Industry Revenue billion Forecast, by Price Trend Analysis 2020 & 2033
- Table 12: Global Blood Meal Industry Revenue billion Forecast, by Country 2020 & 2033
- Table 13: United States Blood Meal Industry Revenue (billion) Forecast, by Application 2020 & 2033
- Table 14: Canada Blood Meal Industry Revenue (billion) Forecast, by Application 2020 & 2033
- Table 15: Mexico Blood Meal Industry Revenue (billion) Forecast, by Application 2020 & 2033
- Table 16: Global Blood Meal Industry Revenue billion Forecast, by Production Analysis 2020 & 2033
- Table 17: Global Blood Meal Industry Revenue billion Forecast, by Consumption Analysis 2020 & 2033
- Table 18: Global Blood Meal Industry Revenue billion Forecast, by Import Market Analysis (Value & Volume) 2020 & 2033
- Table 19: Global Blood Meal Industry Revenue billion Forecast, by Export Market Analysis (Value & Volume) 2020 & 2033
- Table 20: Global Blood Meal Industry Revenue billion Forecast, by Price Trend Analysis 2020 & 2033
- Table 21: Global Blood Meal Industry Revenue billion Forecast, by Country 2020 & 2033
- Table 22: Brazil Blood Meal Industry Revenue (billion) Forecast, by Application 2020 & 2033
- Table 23: Argentina Blood Meal Industry Revenue (billion) Forecast, by Application 2020 & 2033
- Table 24: Rest of South America Blood Meal Industry Revenue (billion) Forecast, by Application 2020 & 2033
- Table 25: Global Blood Meal Industry Revenue billion Forecast, by Production Analysis 2020 & 2033
- Table 26: Global Blood Meal Industry Revenue billion Forecast, by Consumption Analysis 2020 & 2033
- Table 27: Global Blood Meal Industry Revenue billion Forecast, by Import Market Analysis (Value & Volume) 2020 & 2033
- Table 28: Global Blood Meal Industry Revenue billion Forecast, by Export Market Analysis (Value & Volume) 2020 & 2033
- Table 29: Global Blood Meal Industry Revenue billion Forecast, by Price Trend Analysis 2020 & 2033
- Table 30: Global Blood Meal Industry Revenue billion Forecast, by Country 2020 & 2033
- Table 31: United Kingdom Blood Meal Industry Revenue (billion) Forecast, by Application 2020 & 2033
- Table 32: Germany Blood Meal Industry Revenue (billion) Forecast, by Application 2020 & 2033
- Table 33: France Blood Meal Industry Revenue (billion) Forecast, by Application 2020 & 2033
- Table 34: Italy Blood Meal Industry Revenue (billion) Forecast, by Application 2020 & 2033
- Table 35: Spain Blood Meal Industry Revenue (billion) Forecast, by Application 2020 & 2033
- Table 36: Russia Blood Meal Industry Revenue (billion) Forecast, by Application 2020 & 2033
- Table 37: Benelux Blood Meal Industry Revenue (billion) Forecast, by Application 2020 & 2033
- Table 38: Nordics Blood Meal Industry Revenue (billion) Forecast, by Application 2020 & 2033
- Table 39: Rest of Europe Blood Meal Industry Revenue (billion) Forecast, by Application 2020 & 2033
- Table 40: Global Blood Meal Industry Revenue billion Forecast, by Production Analysis 2020 & 2033
- Table 41: Global Blood Meal Industry Revenue billion Forecast, by Consumption Analysis 2020 & 2033
- Table 42: Global Blood Meal Industry Revenue billion Forecast, by Import Market Analysis (Value & Volume) 2020 & 2033
- Table 43: Global Blood Meal Industry Revenue billion Forecast, by Export Market Analysis (Value & Volume) 2020 & 2033
- Table 44: Global Blood Meal Industry Revenue billion Forecast, by Price Trend Analysis 2020 & 2033
- Table 45: Global Blood Meal Industry Revenue billion Forecast, by Country 2020 & 2033
- Table 46: Turkey Blood Meal Industry Revenue (billion) Forecast, by Application 2020 & 2033
- Table 47: Israel Blood Meal Industry Revenue (billion) Forecast, by Application 2020 & 2033
- Table 48: GCC Blood Meal Industry Revenue (billion) Forecast, by Application 2020 & 2033
- Table 49: North Africa Blood Meal Industry Revenue (billion) Forecast, by Application 2020 & 2033
- Table 50: South Africa Blood Meal Industry Revenue (billion) Forecast, by Application 2020 & 2033
- Table 51: Rest of Middle East & Africa Blood Meal Industry Revenue (billion) Forecast, by Application 2020 & 2033
- Table 52: Global Blood Meal Industry Revenue billion Forecast, by Production Analysis 2020 & 2033
- Table 53: Global Blood Meal Industry Revenue billion Forecast, by Consumption Analysis 2020 & 2033
- Table 54: Global Blood Meal Industry Revenue billion Forecast, by Import Market Analysis (Value & Volume) 2020 & 2033
- Table 55: Global Blood Meal Industry Revenue billion Forecast, by Export Market Analysis (Value & Volume) 2020 & 2033
- Table 56: Global Blood Meal Industry Revenue billion Forecast, by Price Trend Analysis 2020 & 2033
- Table 57: Global Blood Meal Industry Revenue billion Forecast, by Country 2020 & 2033
- Table 58: China Blood Meal Industry Revenue (billion) Forecast, by Application 2020 & 2033
- Table 59: India Blood Meal Industry Revenue (billion) Forecast, by Application 2020 & 2033
- Table 60: Japan Blood Meal Industry Revenue (billion) Forecast, by Application 2020 & 2033
- Table 61: South Korea Blood Meal Industry Revenue (billion) Forecast, by Application 2020 & 2033
- Table 62: ASEAN Blood Meal Industry Revenue (billion) Forecast, by Application 2020 & 2033
- Table 63: Oceania Blood Meal Industry Revenue (billion) Forecast, by Application 2020 & 2033
- Table 64: Rest of Asia Pacific Blood Meal Industry Revenue (billion) Forecast, by Application 2020 & 2033
Frequently Asked Questions
1. What is the projected Compound Annual Growth Rate (CAGR) of the Blood Meal Industry?
The projected CAGR is approximately 3.63%.
2. Which companies are prominent players in the Blood Meal Industry?
Key companies in the market include Allanasons Pvt Ltd*List Not Exhaustive, Valley Proteins Inc, Terramar Chile, Sanimax, West Coast Reduction Ltd, Darling Ingredients, Boyer Valley Company LLC, Agro-industrial Complex Backa Topola LTD, The Fetrell Company.
3. What are the main segments of the Blood Meal Industry?
The market segments include Production Analysis, Consumption Analysis, Import Market Analysis (Value & Volume), Export Market Analysis (Value & Volume), Price Trend Analysis.
4. Can you provide details about the market size?
The market size is estimated to be USD 1.29 billion as of 2022.
5. What are some drivers contributing to market growth?
Adoption of Organic and Eco-friendly Farming Practices; Declining Area of Arable Land and Rising Food Security Concerns.
6. What are the notable trends driving market growth?
Growing Demand for Animal Meat is creating Market Opportunities.
7. Are there any restraints impacting market growth?
High Demand for Conventional and Synthetic Products; Lack of Awareness and Other Factors Limiting the Adoption of Agricultural Inoculants.
8. Can you provide examples of recent developments in the market?
May 2022: Darling Ingredients acquired Fasa Group for USD 560 million to expand its geographical presence and new product offerings in the global blood meal market.
9. What pricing options are available for accessing the report?
Pricing options include single-user, multi-user, and enterprise licenses priced at USD 4750, USD 5250, and USD 8750 respectively.
10. Is the market size provided in terms of value or volume?
The market size is provided in terms of value, measured in billion.
11. Are there any specific market keywords associated with the report?
Yes, the market keyword associated with the report is "Blood Meal Industry," which aids in identifying and referencing the specific market segment covered.
12. How do I determine which pricing option suits my needs best?
The pricing options vary based on user requirements and access needs. Individual users may opt for single-user licenses, while businesses requiring broader access may choose multi-user or enterprise licenses for cost-effective access to the report.
13. Are there any additional resources or data provided in the Blood Meal Industry report?
While the report offers comprehensive insights, it's advisable to review the specific contents or supplementary materials provided to ascertain if additional resources or data are available.
14. How can I stay updated on further developments or reports in the Blood Meal Industry?
To stay informed about further developments, trends, and reports in the Blood Meal Industry, consider subscribing to industry newsletters, following relevant companies and organizations, or regularly checking reputable industry news sources and publications.
Methodology
Step 1 - Identification of Relevant Samples Size from Population Database


Step 2 - Approaches for Defining Global Market Size (Value, Volume* & Price*)

Note*: In applicable scenarios
Step 3 - Data Sources
Primary Research
- Web Analytics
- Survey Reports
- Research Institute
- Latest Research Reports
- Opinion Leaders
Secondary Research
- Annual Reports
- White Paper
- Latest Press Release
- Industry Association
- Paid Database
- Investor Presentations

Step 4 - Data Triangulation
Involves using different sources of information in order to increase the validity of a study
These sources are likely to be stakeholders in a program - participants, other researchers, program staff, other community members, and so on.
Then we put all data in single framework & apply various statistical tools to find out the dynamic on the market.
During the analysis stage, feedback from the stakeholder groups would be compared to determine areas of agreement as well as areas of divergence