

Key Insights
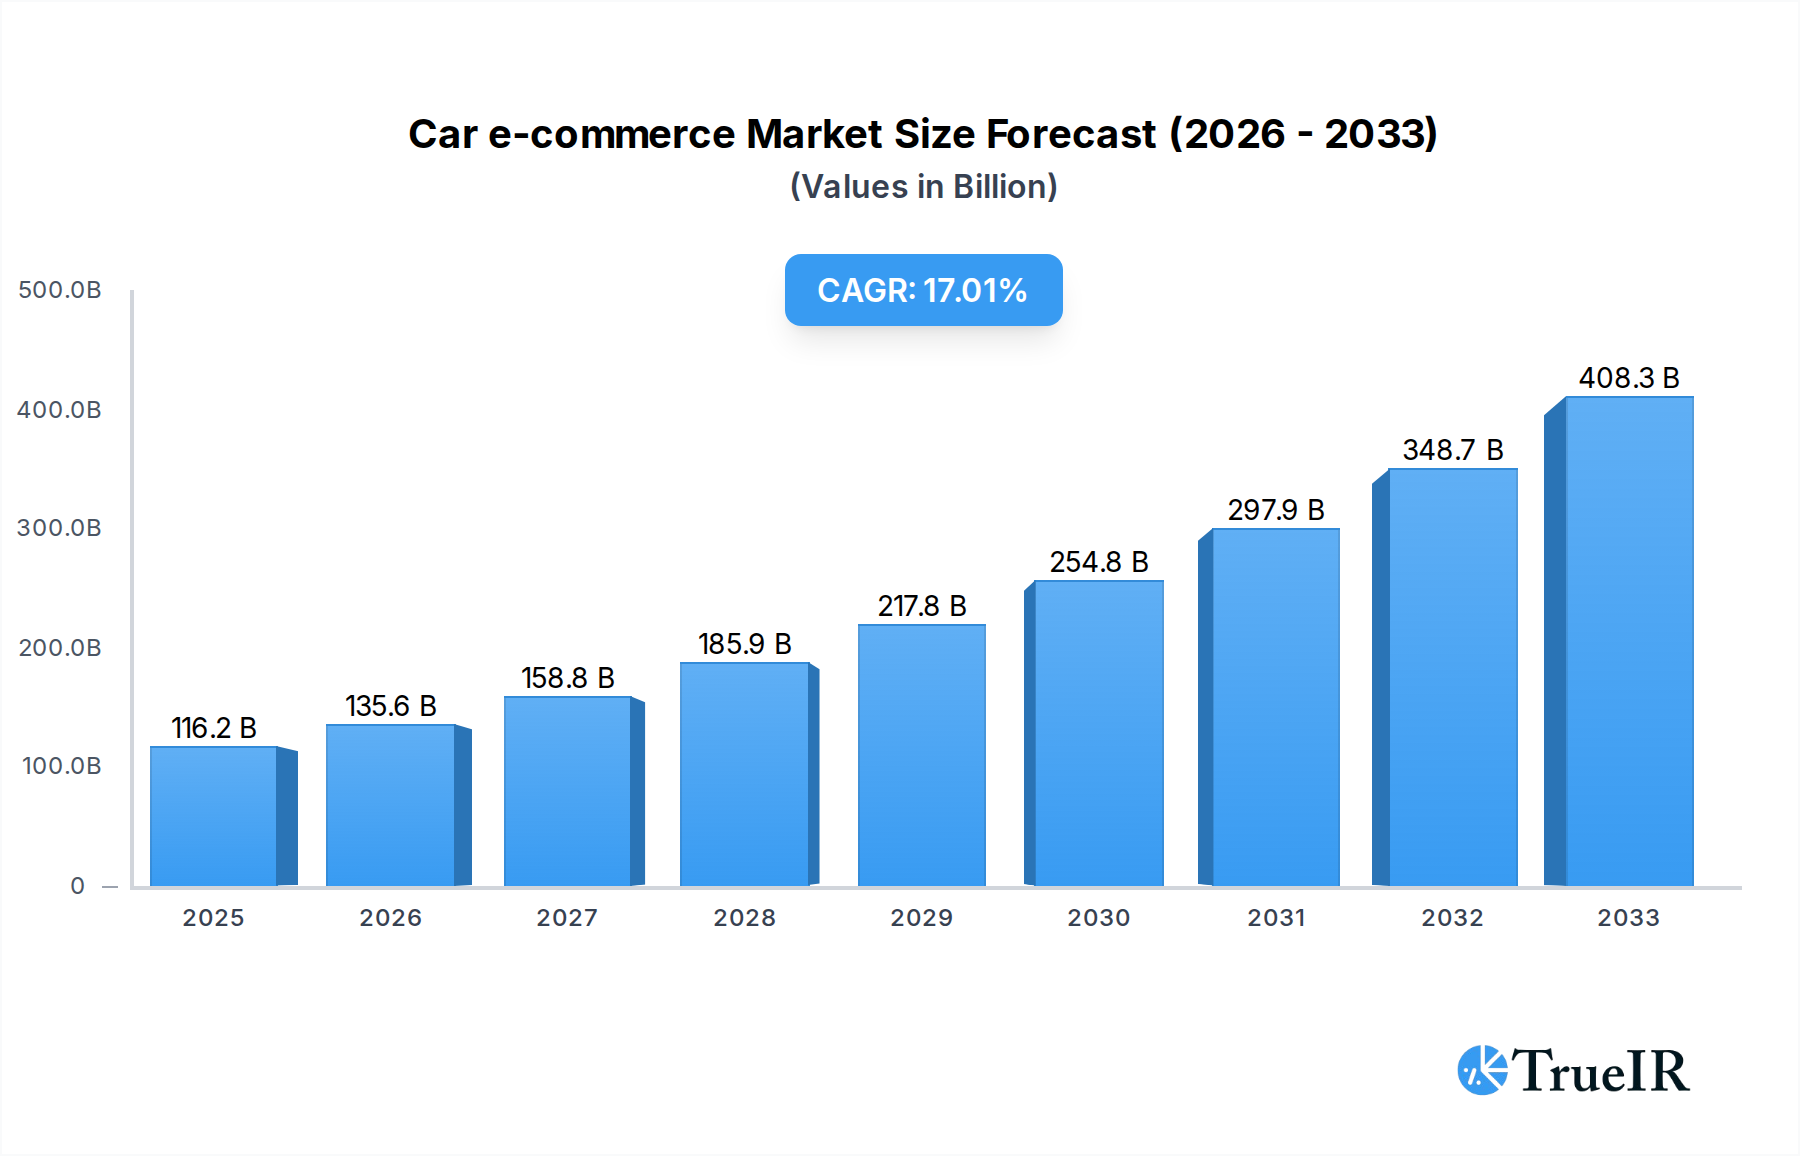
The global Car e-commerce market is poised for substantial expansion, driven by increasing digital adoption and evolving consumer preferences for convenient vehicle purchasing and selling experiences. Projections indicate a robust market size of $116.24 billion in 2025, signaling a mature yet rapidly growing sector. This growth is fueled by a strong CAGR of 16.7%, underscoring significant investment and consumer interest in online automotive solutions. The market's expansion is further propelled by key drivers such as the increasing penetration of smartphones and internet access, leading to greater comfort with online transactions for high-value goods. Furthermore, the demand for transparent pricing, wider selection, and doorstep delivery services offered by online platforms is attracting both individuals and commercial entities. The 'New Car' segment is expected to see significant traction as manufacturers increasingly embrace direct-to-consumer online sales models, while the 'Used Car' segment continues to be a dominant force, benefiting from the convenience and accessibility of online marketplaces.

Car e-commerce Market Size (In Billion)
Emerging trends such as the integration of AI-powered tools for personalized recommendations, virtual reality showrooms, and enhanced digital financing options are set to further transform the Car e-commerce landscape. The convenience offered by platforms that streamline the entire car buying and selling journey, from research and financing to purchase and delivery, is a major draw. While the market exhibits strong growth potential, certain restraints may emerge, including lingering consumer hesitations regarding the inability to physically inspect vehicles before purchase, and the complexity of logistics for vehicle delivery and returns. However, these challenges are being actively addressed by leading players through innovative solutions like extended test drives and comprehensive inspection reports. The market's regional dynamics highlight a strong presence in North America and Asia Pacific, with China and the United States leading the adoption, while Europe and other emerging markets are rapidly catching up. Companies like CarMax, Carvana, and Guazi are at the forefront, continually innovating to capture market share.
Car e-commerce Company Market Share
This comprehensive report offers an in-depth analysis of the burgeoning Car e-commerce market, providing critical insights for stakeholders seeking to understand and capitalize on this rapidly evolving sector. With a study period spanning from 2019 to 2033, including a base and estimated year of 2025, and a forecast period from 2025 to 2033, this report delves into historical trends, current dynamics, and future projections. Leveraging high-volume SEO keywords, this report is optimized for search engines and designed to engage a broad industry audience, from automotive manufacturers and dealerships to tech innovators and investors.
Car e-commerce Market Structure & Competitive Landscape
The Car e-commerce market exhibits a dynamic structure characterized by moderate to high concentration in specific niches, driven by innovation in digital platforms and evolving consumer expectations. Key innovation drivers include AI-powered vehicle recommendations, virtual test drives, seamless financing integration, and blockchain for transparent vehicle history reporting. Regulatory impacts, such as evolving consumer protection laws and data privacy mandates, are shaping operational frameworks. Product substitutes, while traditionally limited to physical dealerships and peer-to-peer sales, are increasingly challenged by the convenience and accessibility offered by online platforms. End-user segmentation is broadly categorized into Personal and Commercial applications, each with distinct purchasing behaviors and demands. Mergers and Acquisitions (M&A) activity has been a significant trend, consolidating market share and expanding service portfolios. For instance, historical M&A volumes indicate substantial investment in technology and market expansion, with an estimated xx billion in disclosed deal values over the historical period. Concentration ratios are expected to fluctuate as new entrants leverage technological advancements to gain market share, particularly in the used car segment where trust and transparency are paramount.
Car e-commerce Market Trends & Opportunities
The Car e-commerce market is projected for robust growth, with an estimated market size expected to reach xx trillion by 2033. This expansion is fueled by a convergence of technological shifts and evolving consumer preferences, leading to unprecedented opportunities. The compound annual growth rate (CAGR) for the forecast period is anticipated to be a significant xx%, indicating a sustained upward trajectory. Technological advancements are at the forefront, with the proliferation of mobile applications, augmented reality (AR) for vehicle visualization, AI-driven pricing algorithms, and the integration of IoT for vehicle diagnostics and post-purchase services. These innovations are dismantling traditional barriers to entry and enhancing the customer experience, making online car purchasing more accessible and appealing.
Consumer preferences are shifting dramatically towards convenience, transparency, and personalized experiences. Buyers are increasingly comfortable researching, configuring, and purchasing vehicles online, bypassing the time-consuming and often intimidating dealership visit. This trend is particularly pronounced among younger demographics who are digital natives. Furthermore, the demand for used cars is soaring, driven by affordability concerns and a growing appreciation for pre-owned vehicles that have undergone rigorous inspection and refurbishment processes facilitated by online platforms. The market penetration rate for online car sales, while still lower than other retail sectors, is steadily increasing, signifying a fundamental change in purchasing habits.
Competitive dynamics are intensifying, with established automotive players and agile tech startups vying for dominance. Companies are focusing on building end-to-end digital ecosystems that encompass everything from initial browsing and financing to delivery and after-sales support. Subscription models and flexible ownership options are also emerging as key differentiators, catering to evolving mobility needs. Opportunities abound for businesses that can offer a seamless, user-friendly, and trustworthy online car buying journey. This includes developing advanced data analytics to understand customer behavior, enhancing cybersecurity to protect sensitive information, and investing in innovative logistics and delivery solutions. The integration of sustainable vehicle options and the financing of electric vehicles (EVs) online are also significant growth avenues.
Dominant Markets & Segments in Car e-commerce
The Car e-commerce market's dominance is multifaceted, with distinct regional strengths and segment leadership. Globally, North America and Asia-Pacific are emerging as the leading regions, driven by high internet penetration, robust digital infrastructure, and a strong appetite for online retail. Within these regions, countries like the United States, China, and India are spearheading growth due to large automotive markets and a significant shift towards digital solutions.
In terms of Application, the Personal segment currently holds a larger market share and is expected to continue its dominance throughout the forecast period. This is attributed to the sheer volume of individual consumers seeking vehicles for personal transportation. However, the Commercial segment, encompassing fleet sales for businesses and ride-sharing services, is exhibiting a higher growth rate. The increasing adoption of electric vehicles and the demand for efficient fleet management solutions are key drivers in this segment.
When considering Types, the Used Car segment is experiencing explosive growth and is predicted to surpass the New Car segment in terms of online transaction volume. This surge is primarily driven by several key factors:
- Affordability and Value: Used cars offer a more accessible price point, making them an attractive option for a broader consumer base, especially in economies facing inflationary pressures. Online platforms can provide a wider selection of used vehicles at competitive prices.
- Transparency and Trust: Leading online platforms are investing heavily in building trust through comprehensive vehicle inspection reports, detailed condition histories, and robust return policies. This addresses a major historical concern for used car buyers.
- Convenience and Selection: Online platforms offer a vast inventory that often exceeds what is available at a single physical dealership. Consumers can browse, compare, and even purchase a used car from the comfort of their homes.
- Technological Advancements: AI-powered appraisal tools and virtual reality (VR) tours of used vehicles are enhancing the online shopping experience, making it more engaging and informative.
The New Car segment, while still significant, is adapting to the digital shift with online configurators, virtual showrooms, and direct-to-consumer sales models. However, the inherent complexities of new car purchases, such as test drives and negotiation, still favor a hybrid online-offline approach for many consumers. Nonetheless, manufacturers are increasingly embracing online channels to streamline the sales process and reduce dealership overhead.
Car e-commerce Product Analysis
Product innovation in Car e-commerce centers on enhancing the digital transaction lifecycle. Key advancements include AI-driven personalized car recommendations, virtual reality showrooms offering immersive vehicle exploration, and seamless integration of financing and insurance options. Competitive advantages are derived from platforms offering transparent pricing, comprehensive vehicle history reports, and hassle-free delivery and return policies. Technological advancements such as blockchain for secure and verifiable vehicle ownership transfers are also gaining traction, fostering greater trust and efficiency.
Key Drivers, Barriers & Challenges in Car e-commerce
The Car e-commerce market is propelled by several key drivers. Technological advancements, including AI, AR, and enhanced mobile platforms, are crucial. Economic factors such as increasing disposable incomes and a growing demand for personal mobility contribute significantly. Furthermore, supportive government policies promoting digital transformation and automotive industry growth are vital. For example, incentives for electric vehicle adoption through online platforms are a growing catalyst.
However, significant barriers and challenges impact growth. Regulatory complexities surrounding online sales, consumer protection, and data privacy pose hurdles. Supply chain issues, including semiconductor shortages and logistics disruptions, can affect vehicle availability and delivery timelines. Competitive pressures from both established players and new entrants, along with the significant capital investment required to build robust digital ecosystems, present ongoing challenges. The estimated impact of supply chain disruptions on delivery times has been an average of xx days in the historical period.
Growth Drivers in the Car e-commerce Market
Growth in the Car e-commerce market is primarily driven by transformative technological adoption, including the widespread use of AI for personalized recommendations and customer service, and AR/VR for immersive vehicle viewing. Economically, rising global incomes and a persistent demand for personal mobility, particularly in emerging markets, fuel expansion. Regulatory support, such as government initiatives promoting digital sales channels and incentives for eco-friendly vehicles purchased online, further accelerates growth. For instance, digital sales tax reforms are simplifying online transactions.
Challenges Impacting Car e-commerce Growth
Challenges impacting Car e-commerce growth are multifaceted. Regulatory complexities, including evolving consumer protection laws and cross-border sales regulations, create an uncertain operating environment. Persistent supply chain issues, exacerbated by geopolitical factors, continue to disrupt vehicle availability and delivery timelines, impacting customer satisfaction. Intense competitive pressures from both traditional automakers and agile online retailers necessitate continuous innovation and significant investment in customer acquisition and retention strategies, with marketing spend estimated at xx billion annually.
Key Players Shaping the Car e-commerce Market
- CarMax
- Guazi
- Uxin
- Souche Holding
- Edmunds
- AutoTrader
- Renrenche
- Carvana
- Cheyipai
- KaiXin
Significant Car e-commerce Industry Milestones
- 2019: Launch of advanced AI-powered recommendation engines by several major online car retailers, enhancing personalization.
- 2020: Significant acceleration of online car purchases due to pandemic-related restrictions, leading to increased investment in digital infrastructure.
- 2021: Introduction of augmented reality (AR) features for virtual car previews by leading platforms, improving remote vehicle evaluation.
- 2022: Increased M&A activity as larger players consolidated market share and expanded service offerings through strategic acquisitions.
- 2023: Growing adoption of blockchain technology for transparent vehicle history reporting, building greater consumer trust.
- 2024: Emergence of flexible car subscription models as a viable alternative to traditional ownership, catering to evolving consumer needs.
Future Outlook for Car e-commerce Market
The future outlook for the Car e-commerce market is exceptionally promising, characterized by sustained growth driven by digital innovation and evolving consumer behavior. Strategic opportunities lie in expanding into emerging markets, further integrating AI for hyper-personalization, and developing seamless end-to-end customer journeys that encompass financing, insurance, and after-sales services. The market potential is immense as more consumers embrace the convenience and transparency of online car purchasing. The increasing demand for electric and autonomous vehicles will also create new avenues for e-commerce platforms to innovate and capture market share.
Car e-commerce Segmentation
-
1. Application
- 1.1. Personal
- 1.2. Commercial
-
2. Types
- 2.1. New Car
- 2.2. Used Car
Car e-commerce Segmentation By Geography
-
1. North America
- 1.1. United States
- 1.2. Canada
- 1.3. Mexico
-
2. South America
- 2.1. Brazil
- 2.2. Argentina
- 2.3. Rest of South America
-
3. Europe
- 3.1. United Kingdom
- 3.2. Germany
- 3.3. France
- 3.4. Italy
- 3.5. Spain
- 3.6. Russia
- 3.7. Benelux
- 3.8. Nordics
- 3.9. Rest of Europe
-
4. Middle East & Africa
- 4.1. Turkey
- 4.2. Israel
- 4.3. GCC
- 4.4. North Africa
- 4.5. South Africa
- 4.6. Rest of Middle East & Africa
-
5. Asia Pacific
- 5.1. China
- 5.2. India
- 5.3. Japan
- 5.4. South Korea
- 5.5. ASEAN
- 5.6. Oceania
- 5.7. Rest of Asia Pacific
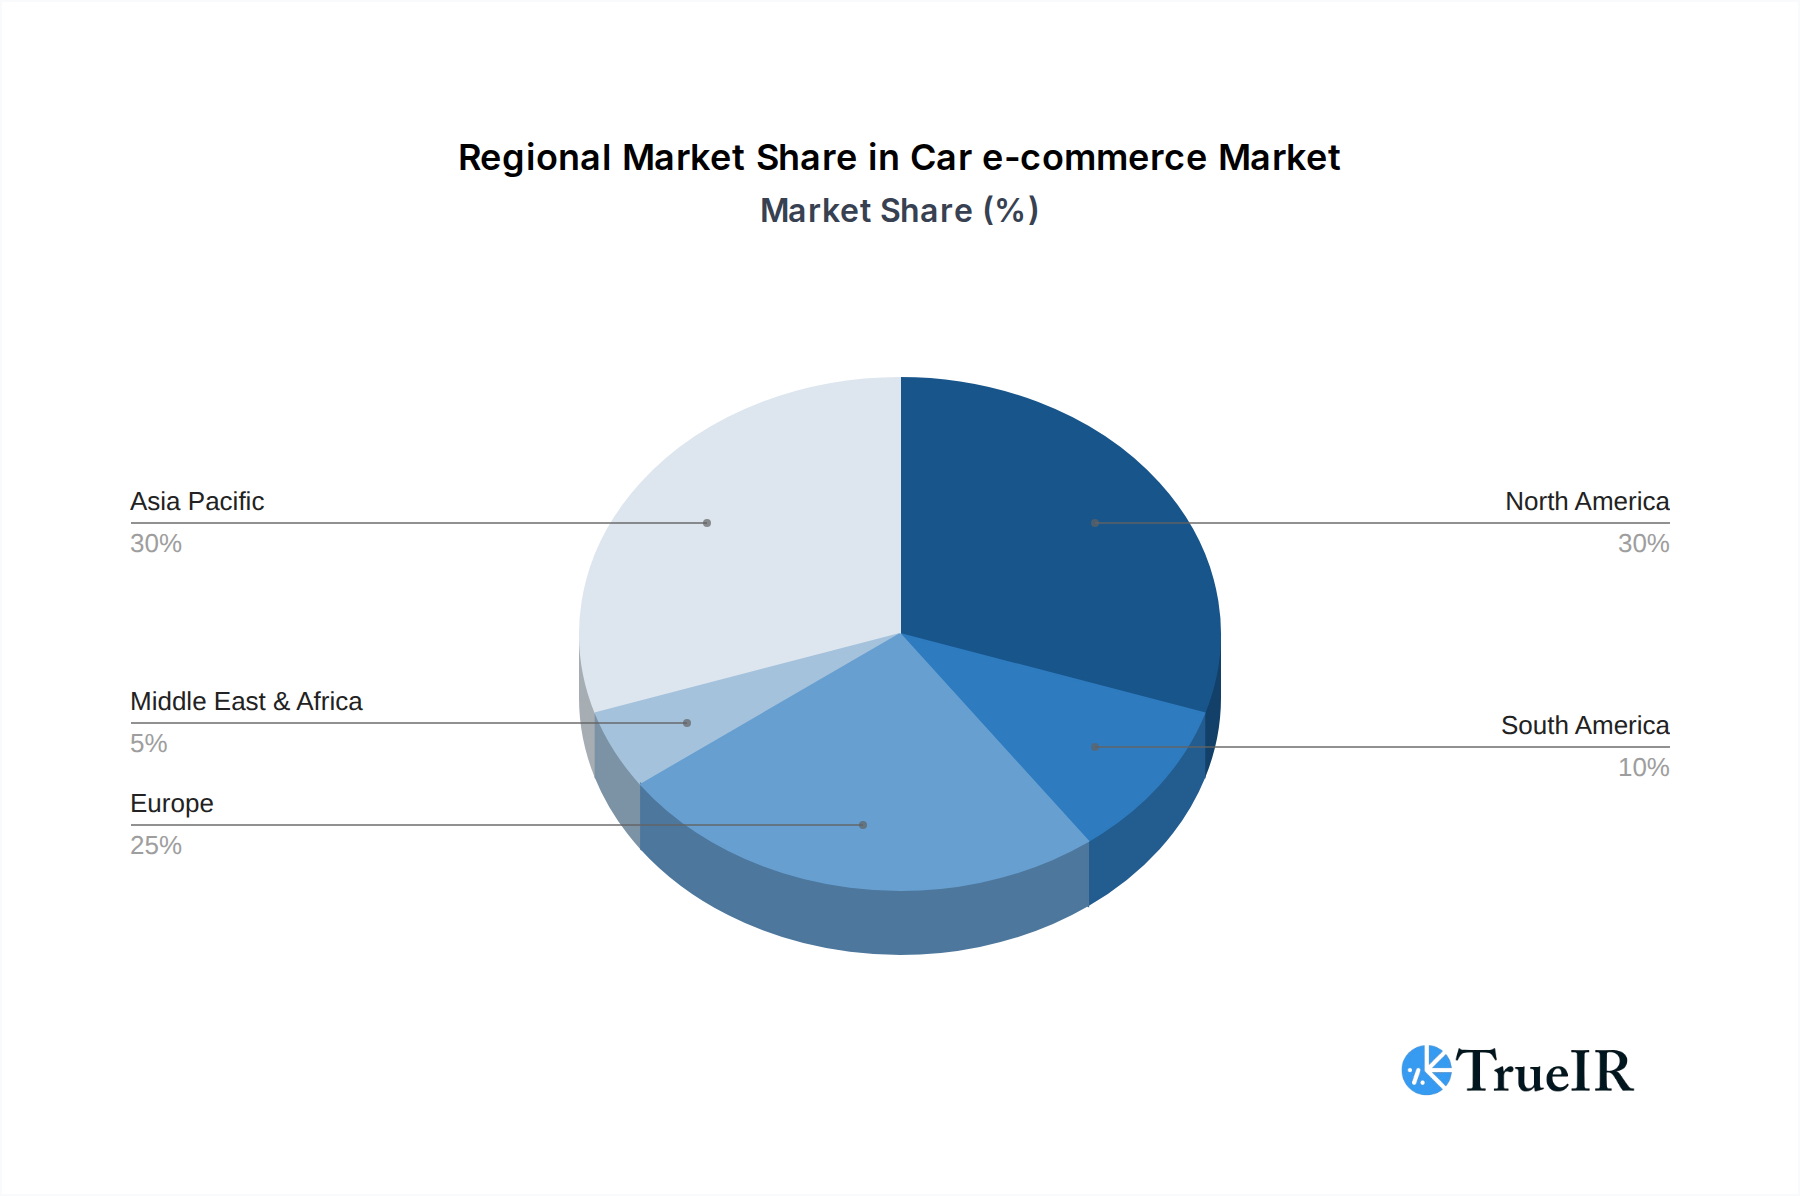
Car e-commerce Regional Market Share
Geographic Coverage of Car e-commerce
Car e-commerce REPORT HIGHLIGHTS
| Aspects | Details |
|---|---|
| Study Period | 2020-2034 |
| Base Year | 2025 |
| Estimated Year | 2026 |
| Forecast Period | 2026-2034 |
| Historical Period | 2020-2025 |
| Growth Rate | CAGR of 16.7% from 2020-2034 |
| Segmentation |
|
Table of Contents
- 1. Introduction
- 1.1. Research Scope
- 1.2. Market Segmentation
- 1.3. Research Methodology
- 1.4. Definitions and Assumptions
- 2. Executive Summary
- 2.1. Introduction
- 3. Market Dynamics
- 3.1. Introduction
- 3.2. Market Drivers
- 3.3. Market Restrains
- 3.4. Market Trends
- 4. Market Factor Analysis
- 4.1. Porters Five Forces
- 4.2. Supply/Value Chain
- 4.3. PESTEL analysis
- 4.4. Market Entropy
- 4.5. Patent/Trademark Analysis
- 5. Global Car e-commerce Analysis, Insights and Forecast, 2020-2032
- 5.1. Market Analysis, Insights and Forecast - by Application
- 5.1.1. Personal
- 5.1.2. Commercial
- 5.2. Market Analysis, Insights and Forecast - by Types
- 5.2.1. New Car
- 5.2.2. Used Car
- 5.3. Market Analysis, Insights and Forecast - by Region
- 5.3.1. North America
- 5.3.2. South America
- 5.3.3. Europe
- 5.3.4. Middle East & Africa
- 5.3.5. Asia Pacific
- 5.1. Market Analysis, Insights and Forecast - by Application
- 6. North America Car e-commerce Analysis, Insights and Forecast, 2020-2032
- 6.1. Market Analysis, Insights and Forecast - by Application
- 6.1.1. Personal
- 6.1.2. Commercial
- 6.2. Market Analysis, Insights and Forecast - by Types
- 6.2.1. New Car
- 6.2.2. Used Car
- 6.1. Market Analysis, Insights and Forecast - by Application
- 7. South America Car e-commerce Analysis, Insights and Forecast, 2020-2032
- 7.1. Market Analysis, Insights and Forecast - by Application
- 7.1.1. Personal
- 7.1.2. Commercial
- 7.2. Market Analysis, Insights and Forecast - by Types
- 7.2.1. New Car
- 7.2.2. Used Car
- 7.1. Market Analysis, Insights and Forecast - by Application
- 8. Europe Car e-commerce Analysis, Insights and Forecast, 2020-2032
- 8.1. Market Analysis, Insights and Forecast - by Application
- 8.1.1. Personal
- 8.1.2. Commercial
- 8.2. Market Analysis, Insights and Forecast - by Types
- 8.2.1. New Car
- 8.2.2. Used Car
- 8.1. Market Analysis, Insights and Forecast - by Application
- 9. Middle East & Africa Car e-commerce Analysis, Insights and Forecast, 2020-2032
- 9.1. Market Analysis, Insights and Forecast - by Application
- 9.1.1. Personal
- 9.1.2. Commercial
- 9.2. Market Analysis, Insights and Forecast - by Types
- 9.2.1. New Car
- 9.2.2. Used Car
- 9.1. Market Analysis, Insights and Forecast - by Application
- 10. Asia Pacific Car e-commerce Analysis, Insights and Forecast, 2020-2032
- 10.1. Market Analysis, Insights and Forecast - by Application
- 10.1.1. Personal
- 10.1.2. Commercial
- 10.2. Market Analysis, Insights and Forecast - by Types
- 10.2.1. New Car
- 10.2.2. Used Car
- 10.1. Market Analysis, Insights and Forecast - by Application
- 11. Competitive Analysis
- 11.1. Global Market Share Analysis 2025
- 11.2. Company Profiles
- 11.2.1 CarMax
- 11.2.1.1. Overview
- 11.2.1.2. Products
- 11.2.1.3. SWOT Analysis
- 11.2.1.4. Recent Developments
- 11.2.1.5. Financials (Based on Availability)
- 11.2.2 Guazi
- 11.2.2.1. Overview
- 11.2.2.2. Products
- 11.2.2.3. SWOT Analysis
- 11.2.2.4. Recent Developments
- 11.2.2.5. Financials (Based on Availability)
- 11.2.3 Uxin
- 11.2.3.1. Overview
- 11.2.3.2. Products
- 11.2.3.3. SWOT Analysis
- 11.2.3.4. Recent Developments
- 11.2.3.5. Financials (Based on Availability)
- 11.2.4 Souche Holding
- 11.2.4.1. Overview
- 11.2.4.2. Products
- 11.2.4.3. SWOT Analysis
- 11.2.4.4. Recent Developments
- 11.2.4.5. Financials (Based on Availability)
- 11.2.5 Edmunds
- 11.2.5.1. Overview
- 11.2.5.2. Products
- 11.2.5.3. SWOT Analysis
- 11.2.5.4. Recent Developments
- 11.2.5.5. Financials (Based on Availability)
- 11.2.6 AutoTrader
- 11.2.6.1. Overview
- 11.2.6.2. Products
- 11.2.6.3. SWOT Analysis
- 11.2.6.4. Recent Developments
- 11.2.6.5. Financials (Based on Availability)
- 11.2.7 Edmunds
- 11.2.7.1. Overview
- 11.2.7.2. Products
- 11.2.7.3. SWOT Analysis
- 11.2.7.4. Recent Developments
- 11.2.7.5. Financials (Based on Availability)
- 11.2.8 AutoTrader
- 11.2.8.1. Overview
- 11.2.8.2. Products
- 11.2.8.3. SWOT Analysis
- 11.2.8.4. Recent Developments
- 11.2.8.5. Financials (Based on Availability)
- 11.2.9 Renrenche
- 11.2.9.1. Overview
- 11.2.9.2. Products
- 11.2.9.3. SWOT Analysis
- 11.2.9.4. Recent Developments
- 11.2.9.5. Financials (Based on Availability)
- 11.2.10 Carvana
- 11.2.10.1. Overview
- 11.2.10.2. Products
- 11.2.10.3. SWOT Analysis
- 11.2.10.4. Recent Developments
- 11.2.10.5. Financials (Based on Availability)
- 11.2.11 Cheyipai
- 11.2.11.1. Overview
- 11.2.11.2. Products
- 11.2.11.3. SWOT Analysis
- 11.2.11.4. Recent Developments
- 11.2.11.5. Financials (Based on Availability)
- 11.2.12 KaiXin
- 11.2.12.1. Overview
- 11.2.12.2. Products
- 11.2.12.3. SWOT Analysis
- 11.2.12.4. Recent Developments
- 11.2.12.5. Financials (Based on Availability)
- 11.2.1 CarMax
List of Figures
- Figure 1: Global Car e-commerce Revenue Breakdown (billion, %) by Region 2025 & 2033
- Figure 2: North America Car e-commerce Revenue (billion), by Application 2025 & 2033
- Figure 3: North America Car e-commerce Revenue Share (%), by Application 2025 & 2033
- Figure 4: North America Car e-commerce Revenue (billion), by Types 2025 & 2033
- Figure 5: North America Car e-commerce Revenue Share (%), by Types 2025 & 2033
- Figure 6: North America Car e-commerce Revenue (billion), by Country 2025 & 2033
- Figure 7: North America Car e-commerce Revenue Share (%), by Country 2025 & 2033
- Figure 8: South America Car e-commerce Revenue (billion), by Application 2025 & 2033
- Figure 9: South America Car e-commerce Revenue Share (%), by Application 2025 & 2033
- Figure 10: South America Car e-commerce Revenue (billion), by Types 2025 & 2033
- Figure 11: South America Car e-commerce Revenue Share (%), by Types 2025 & 2033
- Figure 12: South America Car e-commerce Revenue (billion), by Country 2025 & 2033
- Figure 13: South America Car e-commerce Revenue Share (%), by Country 2025 & 2033
- Figure 14: Europe Car e-commerce Revenue (billion), by Application 2025 & 2033
- Figure 15: Europe Car e-commerce Revenue Share (%), by Application 2025 & 2033
- Figure 16: Europe Car e-commerce Revenue (billion), by Types 2025 & 2033
- Figure 17: Europe Car e-commerce Revenue Share (%), by Types 2025 & 2033
- Figure 18: Europe Car e-commerce Revenue (billion), by Country 2025 & 2033
- Figure 19: Europe Car e-commerce Revenue Share (%), by Country 2025 & 2033
- Figure 20: Middle East & Africa Car e-commerce Revenue (billion), by Application 2025 & 2033
- Figure 21: Middle East & Africa Car e-commerce Revenue Share (%), by Application 2025 & 2033
- Figure 22: Middle East & Africa Car e-commerce Revenue (billion), by Types 2025 & 2033
- Figure 23: Middle East & Africa Car e-commerce Revenue Share (%), by Types 2025 & 2033
- Figure 24: Middle East & Africa Car e-commerce Revenue (billion), by Country 2025 & 2033
- Figure 25: Middle East & Africa Car e-commerce Revenue Share (%), by Country 2025 & 2033
- Figure 26: Asia Pacific Car e-commerce Revenue (billion), by Application 2025 & 2033
- Figure 27: Asia Pacific Car e-commerce Revenue Share (%), by Application 2025 & 2033
- Figure 28: Asia Pacific Car e-commerce Revenue (billion), by Types 2025 & 2033
- Figure 29: Asia Pacific Car e-commerce Revenue Share (%), by Types 2025 & 2033
- Figure 30: Asia Pacific Car e-commerce Revenue (billion), by Country 2025 & 2033
- Figure 31: Asia Pacific Car e-commerce Revenue Share (%), by Country 2025 & 2033
List of Tables
- Table 1: Global Car e-commerce Revenue billion Forecast, by Application 2020 & 2033
- Table 2: Global Car e-commerce Revenue billion Forecast, by Types 2020 & 2033
- Table 3: Global Car e-commerce Revenue billion Forecast, by Region 2020 & 2033
- Table 4: Global Car e-commerce Revenue billion Forecast, by Application 2020 & 2033
- Table 5: Global Car e-commerce Revenue billion Forecast, by Types 2020 & 2033
- Table 6: Global Car e-commerce Revenue billion Forecast, by Country 2020 & 2033
- Table 7: United States Car e-commerce Revenue (billion) Forecast, by Application 2020 & 2033
- Table 8: Canada Car e-commerce Revenue (billion) Forecast, by Application 2020 & 2033
- Table 9: Mexico Car e-commerce Revenue (billion) Forecast, by Application 2020 & 2033
- Table 10: Global Car e-commerce Revenue billion Forecast, by Application 2020 & 2033
- Table 11: Global Car e-commerce Revenue billion Forecast, by Types 2020 & 2033
- Table 12: Global Car e-commerce Revenue billion Forecast, by Country 2020 & 2033
- Table 13: Brazil Car e-commerce Revenue (billion) Forecast, by Application 2020 & 2033
- Table 14: Argentina Car e-commerce Revenue (billion) Forecast, by Application 2020 & 2033
- Table 15: Rest of South America Car e-commerce Revenue (billion) Forecast, by Application 2020 & 2033
- Table 16: Global Car e-commerce Revenue billion Forecast, by Application 2020 & 2033
- Table 17: Global Car e-commerce Revenue billion Forecast, by Types 2020 & 2033
- Table 18: Global Car e-commerce Revenue billion Forecast, by Country 2020 & 2033
- Table 19: United Kingdom Car e-commerce Revenue (billion) Forecast, by Application 2020 & 2033
- Table 20: Germany Car e-commerce Revenue (billion) Forecast, by Application 2020 & 2033
- Table 21: France Car e-commerce Revenue (billion) Forecast, by Application 2020 & 2033
- Table 22: Italy Car e-commerce Revenue (billion) Forecast, by Application 2020 & 2033
- Table 23: Spain Car e-commerce Revenue (billion) Forecast, by Application 2020 & 2033
- Table 24: Russia Car e-commerce Revenue (billion) Forecast, by Application 2020 & 2033
- Table 25: Benelux Car e-commerce Revenue (billion) Forecast, by Application 2020 & 2033
- Table 26: Nordics Car e-commerce Revenue (billion) Forecast, by Application 2020 & 2033
- Table 27: Rest of Europe Car e-commerce Revenue (billion) Forecast, by Application 2020 & 2033
- Table 28: Global Car e-commerce Revenue billion Forecast, by Application 2020 & 2033
- Table 29: Global Car e-commerce Revenue billion Forecast, by Types 2020 & 2033
- Table 30: Global Car e-commerce Revenue billion Forecast, by Country 2020 & 2033
- Table 31: Turkey Car e-commerce Revenue (billion) Forecast, by Application 2020 & 2033
- Table 32: Israel Car e-commerce Revenue (billion) Forecast, by Application 2020 & 2033
- Table 33: GCC Car e-commerce Revenue (billion) Forecast, by Application 2020 & 2033
- Table 34: North Africa Car e-commerce Revenue (billion) Forecast, by Application 2020 & 2033
- Table 35: South Africa Car e-commerce Revenue (billion) Forecast, by Application 2020 & 2033
- Table 36: Rest of Middle East & Africa Car e-commerce Revenue (billion) Forecast, by Application 2020 & 2033
- Table 37: Global Car e-commerce Revenue billion Forecast, by Application 2020 & 2033
- Table 38: Global Car e-commerce Revenue billion Forecast, by Types 2020 & 2033
- Table 39: Global Car e-commerce Revenue billion Forecast, by Country 2020 & 2033
- Table 40: China Car e-commerce Revenue (billion) Forecast, by Application 2020 & 2033
- Table 41: India Car e-commerce Revenue (billion) Forecast, by Application 2020 & 2033
- Table 42: Japan Car e-commerce Revenue (billion) Forecast, by Application 2020 & 2033
- Table 43: South Korea Car e-commerce Revenue (billion) Forecast, by Application 2020 & 2033
- Table 44: ASEAN Car e-commerce Revenue (billion) Forecast, by Application 2020 & 2033
- Table 45: Oceania Car e-commerce Revenue (billion) Forecast, by Application 2020 & 2033
- Table 46: Rest of Asia Pacific Car e-commerce Revenue (billion) Forecast, by Application 2020 & 2033
Frequently Asked Questions
1. What is the projected Compound Annual Growth Rate (CAGR) of the Car e-commerce?
The projected CAGR is approximately 16.7%.
2. Which companies are prominent players in the Car e-commerce?
Key companies in the market include CarMax, Guazi, Uxin, Souche Holding, Edmunds, AutoTrader, Edmunds, AutoTrader, Renrenche, Carvana, Cheyipai, KaiXin.
3. What are the main segments of the Car e-commerce?
The market segments include Application, Types.
4. Can you provide details about the market size?
The market size is estimated to be USD 116.24 billion as of 2022.
5. What are some drivers contributing to market growth?
N/A
6. What are the notable trends driving market growth?
N/A
7. Are there any restraints impacting market growth?
N/A
8. Can you provide examples of recent developments in the market?
N/A
9. What pricing options are available for accessing the report?
Pricing options include single-user, multi-user, and enterprise licenses priced at USD 4900.00, USD 7350.00, and USD 9800.00 respectively.
10. Is the market size provided in terms of value or volume?
The market size is provided in terms of value, measured in billion.
11. Are there any specific market keywords associated with the report?
Yes, the market keyword associated with the report is "Car e-commerce," which aids in identifying and referencing the specific market segment covered.
12. How do I determine which pricing option suits my needs best?
The pricing options vary based on user requirements and access needs. Individual users may opt for single-user licenses, while businesses requiring broader access may choose multi-user or enterprise licenses for cost-effective access to the report.
13. Are there any additional resources or data provided in the Car e-commerce report?
While the report offers comprehensive insights, it's advisable to review the specific contents or supplementary materials provided to ascertain if additional resources or data are available.
14. How can I stay updated on further developments or reports in the Car e-commerce?
To stay informed about further developments, trends, and reports in the Car e-commerce, consider subscribing to industry newsletters, following relevant companies and organizations, or regularly checking reputable industry news sources and publications.
Methodology
Step 1 - Identification of Relevant Samples Size from Population Database


Step 2 - Approaches for Defining Global Market Size (Value, Volume* & Price*)

Note*: In applicable scenarios
Step 3 - Data Sources
Primary Research
- Web Analytics
- Survey Reports
- Research Institute
- Latest Research Reports
- Opinion Leaders
Secondary Research
- Annual Reports
- White Paper
- Latest Press Release
- Industry Association
- Paid Database
- Investor Presentations

Step 4 - Data Triangulation
Involves using different sources of information in order to increase the validity of a study
These sources are likely to be stakeholders in a program - participants, other researchers, program staff, other community members, and so on.
Then we put all data in single framework & apply various statistical tools to find out the dynamic on the market.
During the analysis stage, feedback from the stakeholder groups would be compared to determine areas of agreement as well as areas of divergence