

Key Insights
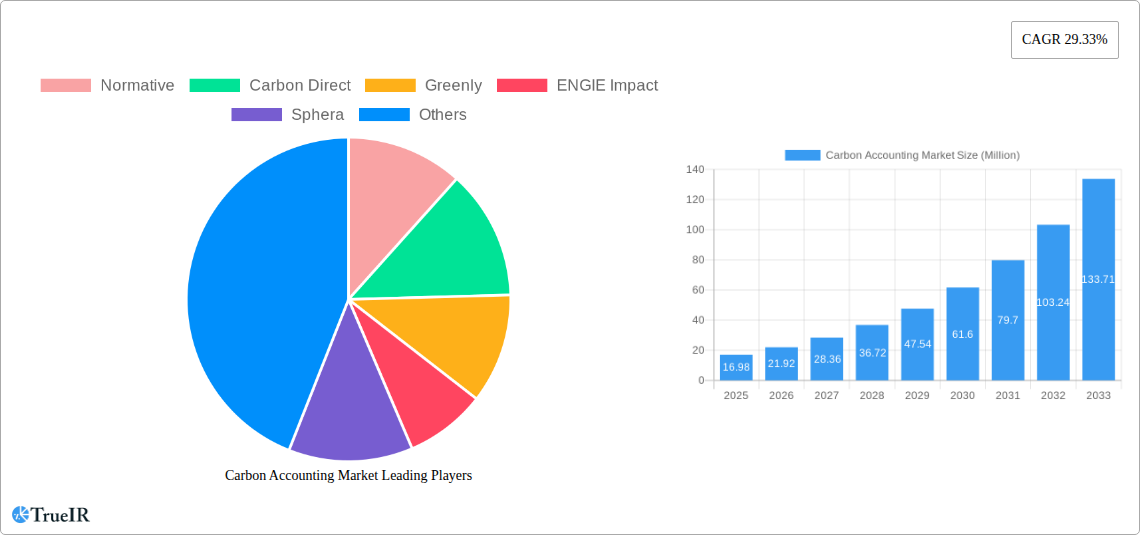
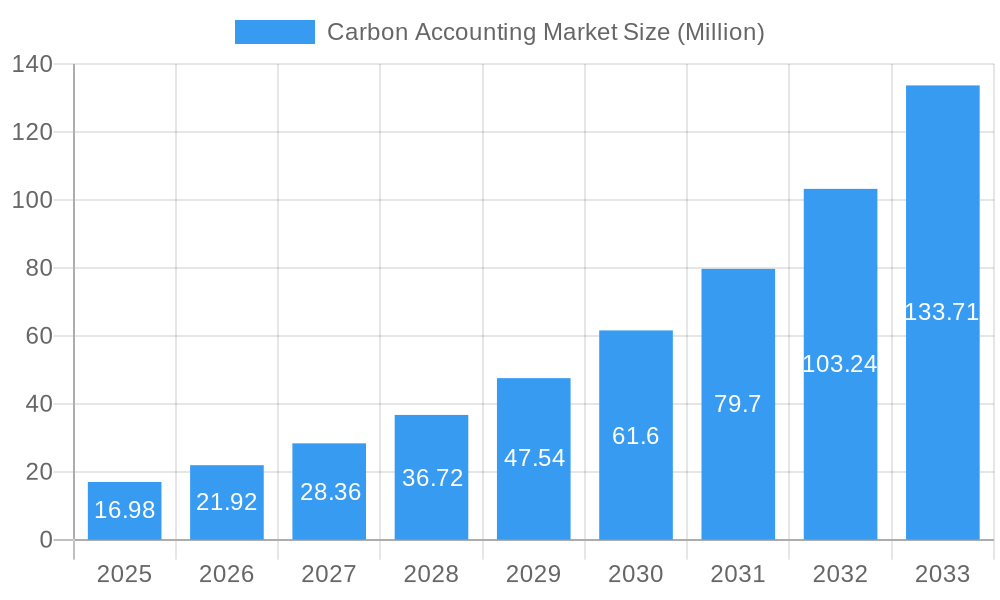
The Carbon Accounting market is experiencing robust growth, projected to reach \$16.98 million in 2025 and exhibiting a Compound Annual Growth Rate (CAGR) of 29.33% from 2025 to 2033. This expansion is driven by increasing regulatory pressure on businesses to disclose their carbon footprint, growing corporate sustainability initiatives, and the rising demand for accurate and transparent carbon emission data across various sectors. Key industries driving market growth include oil and gas, power utilities, and construction and infrastructure, which are heavily regulated and face significant emissions reduction targets. The shift towards cloud-based solutions offers scalability and cost-effectiveness, further fueling market adoption. While data limitations currently exist concerning precise regional breakdowns, North America and Europe are expected to dominate the market initially, due to stringent environmental regulations and advanced technological infrastructure in these regions. However, rapid growth is anticipated in the Asia-Pacific region, fueled by increasing industrialization and government initiatives promoting sustainable development. The adoption of sophisticated analytics within carbon accounting software and the incorporation of Artificial Intelligence (AI) and Machine Learning (ML) are significant market trends. Competition is fierce with established players like IBM and emerging innovative companies in this rapidly evolving landscape.
Carbon Accounting Market Market Size (In Million)
The market segmentation reveals strong demand across various end-users, with oil and gas, power utilities, and construction and infrastructure leading the way due to their significant carbon footprints. The preference for cloud-based solutions reflects a broader industry trend toward flexible and scalable software. The ongoing development of sophisticated carbon accounting methodologies and integration with other sustainability management platforms will further shape the market in the coming years. Challenges such as data collection complexities, the need for standardized reporting frameworks, and the varying levels of carbon accounting maturity across different regions present opportunities for technological advancements and service improvements within this sector. The market's continued expansion is expected to be spurred by evolving regulatory frameworks, enhancing data analytics capabilities and increasing corporate social responsibility goals.
Carbon Accounting Market Company Market Share
Carbon Accounting Market: A Comprehensive Report (2019-2033)
This dynamic report provides a comprehensive analysis of the Carbon Accounting Market, offering invaluable insights for businesses, investors, and policymakers. We delve into market size, growth projections, key players, and emerging trends, leveraging extensive data from the historical period (2019-2024), base year (2025), and forecast period (2025-2033). The study period covers 2019-2033, with an estimated market value of xx Million in 2025. Our analysis incorporates data on key segments like Oil and Gas, Power Utilities, and Cloud-based solutions, offering a granular understanding of this rapidly evolving market.
Carbon Accounting Market Market Structure & Competitive Landscape
The Carbon Accounting market is characterized by a moderately concentrated landscape, with several key players vying for market share. The top ten companies—Normative, Carbon Direct, Greenly, ENGIE Impact, Sphera, SINAI Technologies, Persefoni AI, Emitwise, International Business Machines Corporation, and Diligent Corporation—hold a significant portion of the market, estimated at 60% in 2025. However, the market also demonstrates significant room for smaller players and new entrants, driven by increasing demand and ongoing innovation.
Several factors influence market dynamics:
- Innovation Drivers: Technological advancements in data analytics, AI, and cloud computing are driving the development of more accurate and efficient carbon accounting solutions. This is further amplified by the growing availability of carbon data and the increasing sophistication of ESG reporting requirements.
- Regulatory Impacts: Stringent environmental regulations globally, including carbon emissions reporting mandates, are significantly boosting market growth. The increasing pressure on companies to demonstrate their commitment to sustainability is creating a strong demand for accurate and reliable carbon accounting services.
- Product Substitutes: While limited, some companies utilize in-house solutions or simpler manual processes. However, the accuracy and scalability offered by dedicated carbon accounting platforms are increasingly driving adoption.
- End-User Segmentation: The market is diverse, catering to various end-users including Oil and Gas, Power Utilities, Construction and Infrastructure, Telecommunication, Food and Beverages, and Other End Users, each presenting unique needs and opportunities.
- M&A Trends: The market has witnessed a moderate level of mergers and acquisitions, with approximately xx M&A deals recorded in the past five years, indicating industry consolidation and strategic expansion efforts. This trend is expected to continue, potentially accelerating the market concentration.
Carbon Accounting Market Market Trends & Opportunities
The Carbon Accounting market is experiencing robust growth, projected to reach xx Million by 2033, with a Compound Annual Growth Rate (CAGR) of xx% during the forecast period. This growth is driven by multiple factors:
The increasing awareness of climate change and the global push for carbon neutrality are primary drivers. Governments worldwide are implementing stricter environmental regulations, demanding greater transparency and accountability in carbon emissions reporting. Businesses, under increasing pressure from investors, consumers, and regulators, are actively seeking sophisticated carbon accounting solutions to manage their environmental footprint and comply with reporting standards.
Furthermore, technological advancements are simplifying and enhancing the accuracy of carbon accounting processes. The emergence of cloud-based solutions, AI-powered analytics, and automated data collection methodologies are streamlining workflows and increasing accessibility for organizations of all sizes. The market penetration rate of cloud-based solutions is projected to reach xx% by 2033, reflecting the growing preference for scalable and cost-effective solutions. Competitive dynamics are intensifying, with existing players expanding their offerings and new entrants emerging with innovative solutions.
Dominant Markets & Segments in Carbon Accounting Market
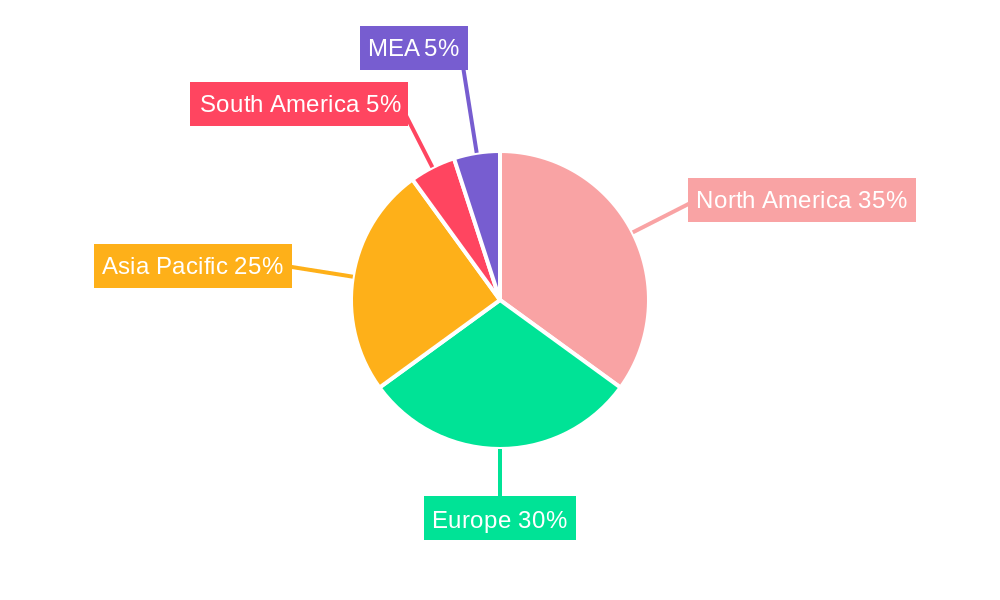
The Oil and Gas sector currently represents the largest segment within the Carbon Accounting market, owing to its substantial carbon footprint and stringent regulatory pressures. The region of North America is currently the dominant market, driven by proactive environmental regulations and the presence of numerous large companies seeking carbon accounting solutions. However, the European market is rapidly growing, stimulated by robust policies and stringent reporting requirements.
Key Growth Drivers:
- Stringent Environmental Regulations: Governments in various regions are introducing increasingly strict regulations regarding carbon emissions reporting and transparency. This is creating a strong demand for accurate and reliable carbon accounting solutions.
- Growing Investor Scrutiny: Investors are placing increased importance on Environmental, Social, and Governance (ESG) factors when making investment decisions, driving companies to improve their ESG reporting and transparency, including robust carbon accounting.
- Technological Advancements: The continuous advancement of technology within data analytics and AI is improving the accuracy and efficiency of carbon accounting practices, making it more accessible to a broader range of organizations.
- Developing Infrastructure: The development of robust data infrastructure and improved data collection mechanisms is enhancing the quality and availability of data for carbon accounting.
Market Dominance Analysis:
The dominance of Oil and Gas and the North American market is expected to continue in the coming years, although the growth of other sectors (such as Power Utilities and Construction) and regions (especially in Europe and Asia-Pacific) is projected to be substantial. Cloud-based solutions are rapidly gaining market share due to their flexibility, scalability, and cost-effectiveness.
Carbon Accounting Market Product Analysis
The carbon accounting software market offers a range of solutions, from cloud-based platforms providing comprehensive carbon footprint calculations and reporting to on-premise solutions tailored for specific organizational needs. Innovations focus on enhancing data integration, improving accuracy through AI-powered analytics, and providing user-friendly interfaces to cater to diverse user skills. Competitive advantages stem from superior data accuracy, seamless integration with existing systems, and comprehensive reporting capabilities that cater to evolving regulatory requirements. The increasing sophistication and accessibility of these solutions contribute to their market acceptance.
Key Drivers, Barriers & Challenges in Carbon Accounting Market
Key Drivers: The increasing demand for accurate carbon accounting is driven by stricter environmental regulations, growing investor and consumer pressure for corporate sustainability, and the availability of advanced technologies like AI and machine learning enabling more precise carbon emission calculations. The need for robust ESG reporting further accelerates adoption.
Challenges and Restraints: The high initial investment costs for implementing robust carbon accounting systems, particularly for smaller businesses, can act as a barrier. Data integration complexities, arising from disparate data sources, represent another challenge. The evolving nature of carbon accounting standards and regulatory frameworks necessitates continuous adaptation of systems, incurring additional costs and requiring expertise. Competitive pressures, including pricing and innovation from market players, could also pose a restraint to overall market growth. The impact of these restraints could be quantified through a reduction in market growth rate of roughly xx% annually.
Growth Drivers in the Carbon Accounting Market Market
The Carbon Accounting market is propelled by intensifying regulatory scrutiny of carbon emissions, heightened investor focus on ESG factors, and the rise of sophisticated data analytics tools. Technological innovation allows for improved accuracy and efficiency in tracking and reducing carbon footprints. Further, the growing awareness of climate change among consumers and businesses boosts demand for transparent and reliable carbon accounting solutions.
Challenges Impacting Carbon Accounting Market Growth
Significant hurdles impacting market growth include the high initial investment costs of implementation, the complexity of integrating data from diverse sources, and the need for continuous adaptation to evolving regulatory standards. Furthermore, the competitive market requires ongoing innovation to maintain market share, requiring significant investment in research and development.
Key Players Shaping the Carbon Accounting Market Market
- Normative
- Carbon Direct
- Greenly
- ENGIE Impact
- Sphera
- SINAI Technologies
- Persefoni AI
- Emitwise
- International Business Machines Corporation
- Diligent Corporation
Significant Carbon Accounting Market Industry Milestones
- March 2024: Greenly secured USD 52 Million in Series B funding, aiming to enhance its carbon accounting methodologies and expand its global market share.
- March 2024: Green Project Technologies launched its Green Project White Label solution, enabling ESG service providers to integrate carbon accounting into their offerings, expanding market reach.
Future Outlook for Carbon Accounting Market Market
The Carbon Accounting market is poised for sustained growth, driven by stricter environmental regulations, increasing corporate sustainability initiatives, and technological advancements. Strategic opportunities exist for companies providing innovative, user-friendly solutions that seamlessly integrate with existing enterprise systems and deliver high-quality data accuracy. The expanding market potential suggests significant opportunities for existing and new players to capitalize on growing demand.
Carbon Accounting Market Segmentation
-
1. Type
- 1.1. Cloud Based
- 1.2. On Premise
-
2. End Users
- 2.1. Oil and Gas
- 2.2. Power Utilities
- 2.3. Construction and Infrastructure
- 2.4. Telecommunication
- 2.5. Food and Beverages
- 2.6. Other End Users
Carbon Accounting Market Segmentation By Geography
-
1. North America
- 1.1. United States
- 1.2. Canada
- 1.3. Rest of North America
-
2. Europe
- 2.1. Germany
- 2.2. France
- 2.3. United Kingdom
- 2.4. Italy
- 2.5. Spain
- 2.6. NORDIC
- 2.7. Russia
- 2.8. Turkey
- 2.9. Rest of Europe
-
3. Asia Pacific
- 3.1. China
- 3.2. India
- 3.3. Australia
- 3.4. Japan
- 3.5. South Korea
- 3.6. Malaysia
- 3.7. Thailand
- 3.8. Indonesia
- 3.9. Vietnam
- 3.10. Rest of Asia Pacific
-
4. Middle East and Africa
- 4.1. Saudi Arabia
- 4.2. United Arab Emirates
- 4.3. Nigeria
- 4.4. Egypt
- 4.5. Qatar
- 4.6. South Africa
- 4.7. Rest of Middle East and Africa
-
5. South America
- 5.1. Brazil
- 5.2. Argentina
- 5.3. Colombia
- 5.4. Rest of South America
Carbon Accounting Market Regional Market Share
Geographic Coverage of Carbon Accounting Market
Carbon Accounting Market REPORT HIGHLIGHTS
| Aspects | Details |
|---|---|
| Study Period | 2020-2034 |
| Base Year | 2025 |
| Estimated Year | 2026 |
| Forecast Period | 2026-2034 |
| Historical Period | 2020-2025 |
| Growth Rate | CAGR of 29.33% from 2020-2034 |
| Segmentation |
|
Table of Contents
- 1. Introduction
- 1.1. Research Scope
- 1.2. Market Segmentation
- 1.3. Research Objective
- 1.4. Definitions and Assumptions
- 2. Executive Summary
- 2.1. Market Snapshot
- 3. Market Dynamics
- 3.1. Market Drivers
- 3.2. Market Restrains
- 3.3. Market Trends
- 3.4. Market Opportunities
- 4. Market Factor Analysis
- 4.1. Porters Five Forces
- 4.1.1. Bargaining Power of Suppliers
- 4.1.2. Bargaining Power of Buyers
- 4.1.3. Threat of New Entrants
- 4.1.4. Threat of Substitutes
- 4.1.5. Competitive Rivalry
- 4.2. PESTEL analysis
- 4.3. BCG Analysis
- 4.3.1. Stars (High Growth, High Market Share)
- 4.3.2. Cash Cows (Low Growth, High Market Share)
- 4.3.3. Question Mark (High Growth, Low Market Share)
- 4.3.4. Dogs (Low Growth, Low Market Share)
- 4.4. Ansoff Matrix Analysis
- 4.5. Supply Chain Analysis
- 4.6. Regulatory Landscape
- 4.7. Current Market Potential and Opportunity Assessment (TAM–SAM–SOM Framework)
- 4.8. TIR Analyst Note
- 4.1. Porters Five Forces
- 5. Market Analysis, Insights and Forecast 2021-2033
- 5.1. Market Analysis, Insights and Forecast - by Type
- 5.1.1. Cloud Based
- 5.1.2. On Premise
- 5.2. Market Analysis, Insights and Forecast - by End Users
- 5.2.1. Oil and Gas
- 5.2.2. Power Utilities
- 5.2.3. Construction and Infrastructure
- 5.2.4. Telecommunication
- 5.2.5. Food and Beverages
- 5.2.6. Other End Users
- 5.3. Market Analysis, Insights and Forecast - by Region
- 5.3.1. North America
- 5.3.2. Europe
- 5.3.3. Asia Pacific
- 5.3.4. Middle East and Africa
- 5.3.5. South America
- 5.1. Market Analysis, Insights and Forecast - by Type
- 6. Global Carbon Accounting Market Analysis, Insights and Forecast, 2021-2033
- 6.1. Market Analysis, Insights and Forecast - by Type
- 6.1.1. Cloud Based
- 6.1.2. On Premise
- 6.2. Market Analysis, Insights and Forecast - by End Users
- 6.2.1. Oil and Gas
- 6.2.2. Power Utilities
- 6.2.3. Construction and Infrastructure
- 6.2.4. Telecommunication
- 6.2.5. Food and Beverages
- 6.2.6. Other End Users
- 6.1. Market Analysis, Insights and Forecast - by Type
- 7. North America Carbon Accounting Market Analysis, Insights and Forecast, 2020-2032
- 7.1. Market Analysis, Insights and Forecast - by Type
- 7.1.1. Cloud Based
- 7.1.2. On Premise
- 7.2. Market Analysis, Insights and Forecast - by End Users
- 7.2.1. Oil and Gas
- 7.2.2. Power Utilities
- 7.2.3. Construction and Infrastructure
- 7.2.4. Telecommunication
- 7.2.5. Food and Beverages
- 7.2.6. Other End Users
- 7.1. Market Analysis, Insights and Forecast - by Type
- 8. Europe Carbon Accounting Market Analysis, Insights and Forecast, 2020-2032
- 8.1. Market Analysis, Insights and Forecast - by Type
- 8.1.1. Cloud Based
- 8.1.2. On Premise
- 8.2. Market Analysis, Insights and Forecast - by End Users
- 8.2.1. Oil and Gas
- 8.2.2. Power Utilities
- 8.2.3. Construction and Infrastructure
- 8.2.4. Telecommunication
- 8.2.5. Food and Beverages
- 8.2.6. Other End Users
- 8.1. Market Analysis, Insights and Forecast - by Type
- 9. Asia Pacific Carbon Accounting Market Analysis, Insights and Forecast, 2020-2032
- 9.1. Market Analysis, Insights and Forecast - by Type
- 9.1.1. Cloud Based
- 9.1.2. On Premise
- 9.2. Market Analysis, Insights and Forecast - by End Users
- 9.2.1. Oil and Gas
- 9.2.2. Power Utilities
- 9.2.3. Construction and Infrastructure
- 9.2.4. Telecommunication
- 9.2.5. Food and Beverages
- 9.2.6. Other End Users
- 9.1. Market Analysis, Insights and Forecast - by Type
- 10. Middle East and Africa Carbon Accounting Market Analysis, Insights and Forecast, 2020-2032
- 10.1. Market Analysis, Insights and Forecast - by Type
- 10.1.1. Cloud Based
- 10.1.2. On Premise
- 10.2. Market Analysis, Insights and Forecast - by End Users
- 10.2.1. Oil and Gas
- 10.2.2. Power Utilities
- 10.2.3. Construction and Infrastructure
- 10.2.4. Telecommunication
- 10.2.5. Food and Beverages
- 10.2.6. Other End Users
- 10.1. Market Analysis, Insights and Forecast - by Type
- 11. South America Carbon Accounting Market Analysis, Insights and Forecast, 2020-2032
- 11.1. Market Analysis, Insights and Forecast - by Type
- 11.1.1. Cloud Based
- 11.1.2. On Premise
- 11.2. Market Analysis, Insights and Forecast - by End Users
- 11.2.1. Oil and Gas
- 11.2.2. Power Utilities
- 11.2.3. Construction and Infrastructure
- 11.2.4. Telecommunication
- 11.2.5. Food and Beverages
- 11.2.6. Other End Users
- 11.1. Market Analysis, Insights and Forecast - by Type
- 12. Competitive Analysis
- 12.1. Company Profiles
- 12.1.1 Normative
- 12.1.1.1. Company Overview
- 12.1.1.2. Products
- 12.1.1.3. Company Financials
- 12.1.1.4. SWOT Analysis
- 12.1.2 Carbon Direct
- 12.1.2.1. Company Overview
- 12.1.2.2. Products
- 12.1.2.3. Company Financials
- 12.1.2.4. SWOT Analysis
- 12.1.3 Greenly
- 12.1.3.1. Company Overview
- 12.1.3.2. Products
- 12.1.3.3. Company Financials
- 12.1.3.4. SWOT Analysis
- 12.1.4 ENGIE Impact
- 12.1.4.1. Company Overview
- 12.1.4.2. Products
- 12.1.4.3. Company Financials
- 12.1.4.4. SWOT Analysis
- 12.1.5 Sphera
- 12.1.5.1. Company Overview
- 12.1.5.2. Products
- 12.1.5.3. Company Financials
- 12.1.5.4. SWOT Analysis
- 12.1.6 SINAI Technologies
- 12.1.6.1. Company Overview
- 12.1.6.2. Products
- 12.1.6.3. Company Financials
- 12.1.6.4. SWOT Analysis
- 12.1.7 Persefoni AI
- 12.1.7.1. Company Overview
- 12.1.7.2. Products
- 12.1.7.3. Company Financials
- 12.1.7.4. SWOT Analysis
- 12.1.8 Emitwise
- 12.1.8.1. Company Overview
- 12.1.8.2. Products
- 12.1.8.3. Company Financials
- 12.1.8.4. SWOT Analysis
- 12.1.9 International Business Machines Corporation
- 12.1.9.1. Company Overview
- 12.1.9.2. Products
- 12.1.9.3. Company Financials
- 12.1.9.4. SWOT Analysis
- 12.1.10 Diligent Corporation
- 12.1.10.1. Company Overview
- 12.1.10.2. Products
- 12.1.10.3. Company Financials
- 12.1.10.4. SWOT Analysis
- 12.1.1 Normative
- 12.2. Market Entropy
- 12.2.1 Company's Key Areas Served
- 12.2.2 Recent Developments
- 12.3. Company Market Share Analysis 2025
- 12.3.1 Top 5 Companies Market Share Analysis
- 12.3.2 Top 3 Companies Market Share Analysis
- 12.4. List of Potential Customers
- 13. Research Methodology
List of Figures
- Figure 1: Global Carbon Accounting Market Revenue Breakdown (Million, %) by Region 2025 & 2033
- Figure 2: North America Carbon Accounting Market Revenue (Million), by Type 2025 & 2033
- Figure 3: North America Carbon Accounting Market Revenue Share (%), by Type 2025 & 2033
- Figure 4: North America Carbon Accounting Market Revenue (Million), by End Users 2025 & 2033
- Figure 5: North America Carbon Accounting Market Revenue Share (%), by End Users 2025 & 2033
- Figure 6: North America Carbon Accounting Market Revenue (Million), by Country 2025 & 2033
- Figure 7: North America Carbon Accounting Market Revenue Share (%), by Country 2025 & 2033
- Figure 8: Europe Carbon Accounting Market Revenue (Million), by Type 2025 & 2033
- Figure 9: Europe Carbon Accounting Market Revenue Share (%), by Type 2025 & 2033
- Figure 10: Europe Carbon Accounting Market Revenue (Million), by End Users 2025 & 2033
- Figure 11: Europe Carbon Accounting Market Revenue Share (%), by End Users 2025 & 2033
- Figure 12: Europe Carbon Accounting Market Revenue (Million), by Country 2025 & 2033
- Figure 13: Europe Carbon Accounting Market Revenue Share (%), by Country 2025 & 2033
- Figure 14: Asia Pacific Carbon Accounting Market Revenue (Million), by Type 2025 & 2033
- Figure 15: Asia Pacific Carbon Accounting Market Revenue Share (%), by Type 2025 & 2033
- Figure 16: Asia Pacific Carbon Accounting Market Revenue (Million), by End Users 2025 & 2033
- Figure 17: Asia Pacific Carbon Accounting Market Revenue Share (%), by End Users 2025 & 2033
- Figure 18: Asia Pacific Carbon Accounting Market Revenue (Million), by Country 2025 & 2033
- Figure 19: Asia Pacific Carbon Accounting Market Revenue Share (%), by Country 2025 & 2033
- Figure 20: Middle East and Africa Carbon Accounting Market Revenue (Million), by Type 2025 & 2033
- Figure 21: Middle East and Africa Carbon Accounting Market Revenue Share (%), by Type 2025 & 2033
- Figure 22: Middle East and Africa Carbon Accounting Market Revenue (Million), by End Users 2025 & 2033
- Figure 23: Middle East and Africa Carbon Accounting Market Revenue Share (%), by End Users 2025 & 2033
- Figure 24: Middle East and Africa Carbon Accounting Market Revenue (Million), by Country 2025 & 2033
- Figure 25: Middle East and Africa Carbon Accounting Market Revenue Share (%), by Country 2025 & 2033
- Figure 26: South America Carbon Accounting Market Revenue (Million), by Type 2025 & 2033
- Figure 27: South America Carbon Accounting Market Revenue Share (%), by Type 2025 & 2033
- Figure 28: South America Carbon Accounting Market Revenue (Million), by End Users 2025 & 2033
- Figure 29: South America Carbon Accounting Market Revenue Share (%), by End Users 2025 & 2033
- Figure 30: South America Carbon Accounting Market Revenue (Million), by Country 2025 & 2033
- Figure 31: South America Carbon Accounting Market Revenue Share (%), by Country 2025 & 2033
List of Tables
- Table 1: Global Carbon Accounting Market Revenue Million Forecast, by Type 2020 & 2033
- Table 2: Global Carbon Accounting Market Revenue Million Forecast, by End Users 2020 & 2033
- Table 3: Global Carbon Accounting Market Revenue Million Forecast, by Region 2020 & 2033
- Table 4: Global Carbon Accounting Market Revenue Million Forecast, by Type 2020 & 2033
- Table 5: Global Carbon Accounting Market Revenue Million Forecast, by End Users 2020 & 2033
- Table 6: Global Carbon Accounting Market Revenue Million Forecast, by Country 2020 & 2033
- Table 7: United States Carbon Accounting Market Revenue (Million) Forecast, by Application 2020 & 2033
- Table 8: Canada Carbon Accounting Market Revenue (Million) Forecast, by Application 2020 & 2033
- Table 9: Rest of North America Carbon Accounting Market Revenue (Million) Forecast, by Application 2020 & 2033
- Table 10: Global Carbon Accounting Market Revenue Million Forecast, by Type 2020 & 2033
- Table 11: Global Carbon Accounting Market Revenue Million Forecast, by End Users 2020 & 2033
- Table 12: Global Carbon Accounting Market Revenue Million Forecast, by Country 2020 & 2033
- Table 13: Germany Carbon Accounting Market Revenue (Million) Forecast, by Application 2020 & 2033
- Table 14: France Carbon Accounting Market Revenue (Million) Forecast, by Application 2020 & 2033
- Table 15: United Kingdom Carbon Accounting Market Revenue (Million) Forecast, by Application 2020 & 2033
- Table 16: Italy Carbon Accounting Market Revenue (Million) Forecast, by Application 2020 & 2033
- Table 17: Spain Carbon Accounting Market Revenue (Million) Forecast, by Application 2020 & 2033
- Table 18: NORDIC Carbon Accounting Market Revenue (Million) Forecast, by Application 2020 & 2033
- Table 19: Russia Carbon Accounting Market Revenue (Million) Forecast, by Application 2020 & 2033
- Table 20: Turkey Carbon Accounting Market Revenue (Million) Forecast, by Application 2020 & 2033
- Table 21: Rest of Europe Carbon Accounting Market Revenue (Million) Forecast, by Application 2020 & 2033
- Table 22: Global Carbon Accounting Market Revenue Million Forecast, by Type 2020 & 2033
- Table 23: Global Carbon Accounting Market Revenue Million Forecast, by End Users 2020 & 2033
- Table 24: Global Carbon Accounting Market Revenue Million Forecast, by Country 2020 & 2033
- Table 25: China Carbon Accounting Market Revenue (Million) Forecast, by Application 2020 & 2033
- Table 26: India Carbon Accounting Market Revenue (Million) Forecast, by Application 2020 & 2033
- Table 27: Australia Carbon Accounting Market Revenue (Million) Forecast, by Application 2020 & 2033
- Table 28: Japan Carbon Accounting Market Revenue (Million) Forecast, by Application 2020 & 2033
- Table 29: South Korea Carbon Accounting Market Revenue (Million) Forecast, by Application 2020 & 2033
- Table 30: Malaysia Carbon Accounting Market Revenue (Million) Forecast, by Application 2020 & 2033
- Table 31: Thailand Carbon Accounting Market Revenue (Million) Forecast, by Application 2020 & 2033
- Table 32: Indonesia Carbon Accounting Market Revenue (Million) Forecast, by Application 2020 & 2033
- Table 33: Vietnam Carbon Accounting Market Revenue (Million) Forecast, by Application 2020 & 2033
- Table 34: Rest of Asia Pacific Carbon Accounting Market Revenue (Million) Forecast, by Application 2020 & 2033
- Table 35: Global Carbon Accounting Market Revenue Million Forecast, by Type 2020 & 2033
- Table 36: Global Carbon Accounting Market Revenue Million Forecast, by End Users 2020 & 2033
- Table 37: Global Carbon Accounting Market Revenue Million Forecast, by Country 2020 & 2033
- Table 38: Saudi Arabia Carbon Accounting Market Revenue (Million) Forecast, by Application 2020 & 2033
- Table 39: United Arab Emirates Carbon Accounting Market Revenue (Million) Forecast, by Application 2020 & 2033
- Table 40: Nigeria Carbon Accounting Market Revenue (Million) Forecast, by Application 2020 & 2033
- Table 41: Egypt Carbon Accounting Market Revenue (Million) Forecast, by Application 2020 & 2033
- Table 42: Qatar Carbon Accounting Market Revenue (Million) Forecast, by Application 2020 & 2033
- Table 43: South Africa Carbon Accounting Market Revenue (Million) Forecast, by Application 2020 & 2033
- Table 44: Rest of Middle East and Africa Carbon Accounting Market Revenue (Million) Forecast, by Application 2020 & 2033
- Table 45: Global Carbon Accounting Market Revenue Million Forecast, by Type 2020 & 2033
- Table 46: Global Carbon Accounting Market Revenue Million Forecast, by End Users 2020 & 2033
- Table 47: Global Carbon Accounting Market Revenue Million Forecast, by Country 2020 & 2033
- Table 48: Brazil Carbon Accounting Market Revenue (Million) Forecast, by Application 2020 & 2033
- Table 49: Argentina Carbon Accounting Market Revenue (Million) Forecast, by Application 2020 & 2033
- Table 50: Colombia Carbon Accounting Market Revenue (Million) Forecast, by Application 2020 & 2033
- Table 51: Rest of South America Carbon Accounting Market Revenue (Million) Forecast, by Application 2020 & 2033
Frequently Asked Questions
1. What is the projected Compound Annual Growth Rate (CAGR) of the Carbon Accounting Market?
The projected CAGR is approximately 29.33%.
2. Which companies are prominent players in the Carbon Accounting Market?
Key companies in the market include Normative, Carbon Direct, Greenly, ENGIE Impact, Sphera, SINAI Technologies, Persefoni AI, Emitwise, International Business Machines Corporation, Diligent Corporation.
3. What are the main segments of the Carbon Accounting Market?
The market segments include Type, End Users.
4. Can you provide details about the market size?
The market size is estimated to be USD 16.98 Million as of 2022.
5. What are some drivers contributing to market growth?
4.; Corporate Sustainability Goals4.; Stringent Regultions and Compliance.
6. What are the notable trends driving market growth?
The Power Utilities Segment to Witness Significant Growth.
7. Are there any restraints impacting market growth?
4.; High Complexity in Carbon Accounting.
8. Can you provide examples of recent developments in the market?
March 2024: Greenly, a significant carbon accounting startup, announced that it secured funding for its series B round. The company raised USD 52 million in its Series B round. Investors aim to develop more precise carbon accounting methodologies and accurately deploy these solutions to increase the company’s market share globally.
9. What pricing options are available for accessing the report?
Pricing options include single-user, multi-user, and enterprise licenses priced at USD 4750, USD 5250, and USD 8750 respectively.
10. Is the market size provided in terms of value or volume?
The market size is provided in terms of value, measured in Million.
11. Are there any specific market keywords associated with the report?
Yes, the market keyword associated with the report is "Carbon Accounting Market," which aids in identifying and referencing the specific market segment covered.
12. How do I determine which pricing option suits my needs best?
The pricing options vary based on user requirements and access needs. Individual users may opt for single-user licenses, while businesses requiring broader access may choose multi-user or enterprise licenses for cost-effective access to the report.
13. Are there any additional resources or data provided in the Carbon Accounting Market report?
While the report offers comprehensive insights, it's advisable to review the specific contents or supplementary materials provided to ascertain if additional resources or data are available.
14. How can I stay updated on further developments or reports in the Carbon Accounting Market?
To stay informed about further developments, trends, and reports in the Carbon Accounting Market, consider subscribing to industry newsletters, following relevant companies and organizations, or regularly checking reputable industry news sources and publications.
Methodology
Step 1 - Identification of Relevant Samples Size from Population Database


Step 2 - Approaches for Defining Global Market Size (Value, Volume* & Price*)

Note*: In applicable scenarios
Step 3 - Data Sources
Primary Research
- Web Analytics
- Survey Reports
- Research Institute
- Latest Research Reports
- Opinion Leaders
Secondary Research
- Annual Reports
- White Paper
- Latest Press Release
- Industry Association
- Paid Database
- Investor Presentations

Step 4 - Data Triangulation
Involves using different sources of information in order to increase the validity of a study
These sources are likely to be stakeholders in a program - participants, other researchers, program staff, other community members, and so on.
Then we put all data in single framework & apply various statistical tools to find out the dynamic on the market.
During the analysis stage, feedback from the stakeholder groups would be compared to determine areas of agreement as well as areas of divergence