

Key Insights
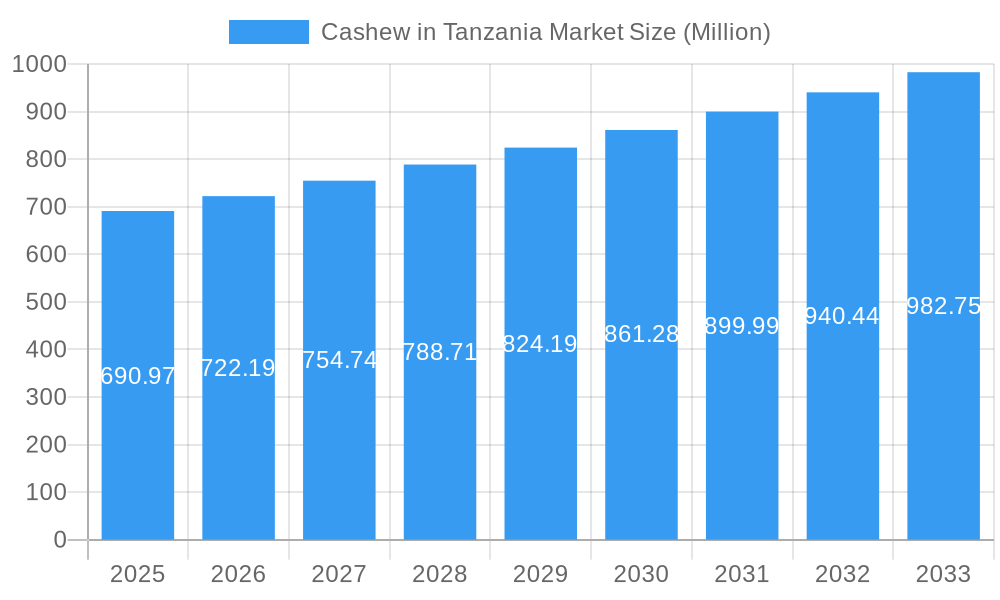
The Tanzanian cashew market is poised for robust growth, projected to reach a substantial valuation by 2033. With a Compound Annual Growth Rate (CAGR) of 4.48%, the market is expected to expand significantly from its current base. This upward trajectory is underpinned by a confluence of positive market forces. Key drivers include the increasing global demand for cashew nuts as a healthy snack and ingredient in various food products, coupled with Tanzania's strategic position as a leading cashew producer. The government's supportive policies aimed at boosting agricultural exports and enhancing processing capabilities further fuel this growth. Furthermore, the rising disposable incomes in emerging economies are contributing to a greater consumption of premium food items like cashews, thereby creating sustained demand for Tanzanian produce.
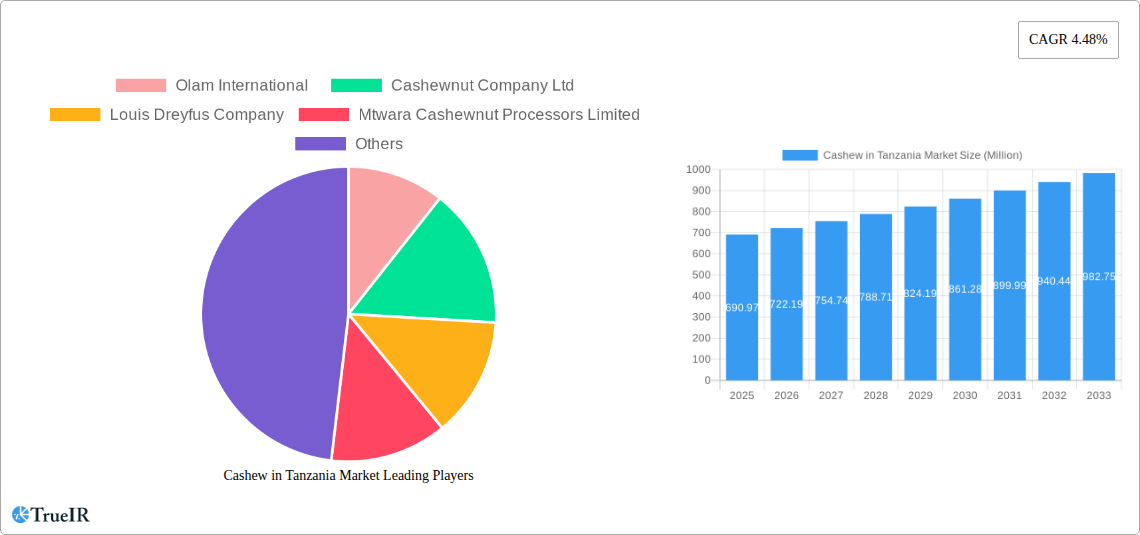
Cashew in Tanzania Market Market Size (In Million)
The market's expansion will be characterized by several evolving trends. A notable trend is the increasing focus on value-added products, with a shift from raw cashew nut exports to processed and packaged cashew kernels. This strategy not only commands higher prices but also creates more employment opportunities within Tanzania. Investments in modern processing technologies and quality control measures are expected to rise, enhancing the competitiveness of Tanzanian cashews on the international stage. However, potential restraints such as the volatility of international commodity prices, climate change impacts on crop yields, and logistical challenges in transportation need to be carefully managed to ensure sustained and equitable growth. The market is segmented across production, consumption, import, and export analyses, offering a comprehensive view of its dynamics. Major players like Olam International, Cashewnut Company Ltd, and Louis Dreyfus Company are actively shaping the market landscape.
Cashew in Tanzania Market Company Market Share
This in-depth report provides an authoritative overview of the Cashew in Tanzania Market, meticulously examining production, consumption, import, export dynamics, and price trends from 2019 to 2033. Leveraging a robust dataset and expert analysis, this report offers critical insights for stakeholders seeking to capitalize on the burgeoning cashew sector in Tanzania. With a base year of 2025 and an extensive forecast period extending to 2033, this analysis illuminates market size, growth drivers, competitive landscape, and emerging opportunities within this vital agricultural commodity market. We meticulously dissect the value chain, from farm gate to international markets, providing actionable intelligence for industry participants.
This report is essential for cashew farmers, processors, exporters, importers, government agencies, investors, and research institutions seeking to understand the intricate dynamics and future trajectory of the Tanzanian cashew industry. Our analysis includes detailed breakdowns of key market segments, identifying dominant players and strategic approaches that are shaping the sector's evolution.
Cashew in Tanzania Market Market Structure & Competitive Landscape
The Cashew in Tanzania Market is characterized by a moderately concentrated structure, with Olam International and Louis Dreyfus Company holding significant market shares. However, a growing number of domestic processors, such as Cashewnut Company Ltd and Mtwara Cashewnut Processors Limited, are increasingly contributing to market diversification and value addition. Innovation drivers in this market are primarily focused on enhancing crop yield through improved agricultural practices and developing advanced processing techniques to meet international quality standards. Regulatory impacts are significant, with government policies aimed at promoting local processing and increasing export value. Product substitutes, while not directly impacting raw cashew nut demand, are a consideration in the broader snack and culinary nut market. End-user segmentation reveals strong demand from the confectionery, baking, and snack industries. Merger and acquisition (M&A) trends are slowly emerging as larger international players seek to solidify their presence and acquire local processing capabilities. While specific M&A volumes are still developing, the trend indicates a consolidation of key players aiming for greater control over the supply chain. Concentration ratios suggest that the top five players account for approximately 60% of the processed cashew market.
Cashew in Tanzania Market Market Trends & Opportunities
The Cashew in Tanzania Market is experiencing robust growth, driven by increasing global demand for cashew nuts and supportive government initiatives aimed at boosting production and value addition. Market size is projected to witness a Compound Annual Growth Rate (CAGR) of approximately 5.5% from 2025 to 2033. Technological shifts are crucial, with a growing emphasis on precision agriculture, improved seed varieties, and mechanized harvesting to enhance efficiency and productivity. Consumer preferences are increasingly leaning towards healthy and natural snack options, further fueling demand for cashews. Competitive dynamics are evolving, with a rise in local processing capacity challenging the traditional dominance of raw cashew nut exports. Market penetration rates are expected to increase as Tanzania solidifies its position as a leading cashew producer and exporter. Opportunities abound in developing robust cashew processing infrastructure, investing in research and development for disease-resistant varieties, and expanding into niche markets for specialized cashew products. Furthermore, the growing trend of sustainable sourcing and fair trade practices presents significant opportunities for companies that can demonstrate ethical and environmentally responsible operations. The increasing consumer awareness regarding the health benefits of cashews, such as their rich content of monounsaturated fats, vitamins, and minerals, is a significant market trend that translates into consistent demand. The expansion of the global confectionery and bakery industries also directly correlates with increased demand for cashews as a key ingredient. Tanzania's strategic geographical location and its potential to serve as a gateway to other African markets further enhance its market attractiveness. The implementation of favorable trade agreements and the ongoing efforts to streamline export procedures are also contributing positively to the market's growth trajectory.
Dominant Markets & Segments in Cashew in Tanzania Market
Within the Cashew in Tanzania Market, Export Market Analysis (Volume and Value) stands out as the most dominant segment. Tanzania has consistently been one of the world's leading producers of raw cashew nuts, with the majority of this production destined for international markets. Key growth drivers for this dominance include strong global demand from major consuming countries, favorable international commodity prices, and a well-established export infrastructure, albeit with room for improvement. The Production Analysis segment is also critically important, as it forms the bedrock of the entire market. Growth in this segment is driven by government support for cashew farmers, including initiatives to improve farming techniques and access to inputs. The Consumption Analysis (Volume and Value) within Tanzania is also growing, albeit at a slower pace than exports, driven by an expanding local processing industry and increasing domestic awareness of cashew's nutritional value.
Export Market Dominance:
- Growth Drivers: High global demand for raw cashews, particularly from India and Vietnam, for re-processing. Favorable international prices driven by supply and demand dynamics. Established trade relationships with key importing nations.
- Detailed Analysis: Tanzania's raw cashew nut exports contribute significantly to the country's foreign exchange earnings. The volume of exports is heavily influenced by annual harvest yields, which are in turn affected by weather patterns and farmer practices. The value of exports is subject to international market price fluctuations and the quality of the exported nuts.
Production Analysis:
- Growth Drivers: Government policies promoting cashew cultivation, including subsidies and extension services. Investment in research and development for improved cashew varieties. Expansion of land under cashew cultivation.
- Detailed Analysis: The government's commitment to increasing cashew production is a crucial factor. Initiatives like providing free agricultural inputs aim to directly boost farmer output and improve the quality of the nuts harvested. The focus on enhancing old cashew trees through grafting and budding techniques is a testament to the efforts to maximize yield from existing resources.
Consumption Analysis (Volume and Value):
- Growth Drivers: Increasing capacity of local cashew processing factories. Growing domestic demand for processed cashew products. Rising awareness of the health benefits of cashews among Tanzanian consumers.
- Detailed Analysis: While exports of raw cashews remain dominant, there is a discernible shift towards domestic value addition. Local processors are investing in modern facilities to produce roasted, salted, and flavored cashew products for both domestic consumption and potential export markets. This segment represents a significant future growth opportunity.
Import Market Analysis (Volume and Value):
- Growth Drivers: Demand for specialized cashew kernels and products not domestically produced. Intermediate processing needs by local industries.
- Detailed Analysis: Tanzania's cashew imports are relatively low compared to its exports, primarily consisting of specific types of kernels or processed cashew products required by niche segments of the domestic market or for further processing before re-export.
Price Trend Analysis:
- Growth Drivers: Global supply and demand dynamics. Quality of the harvest. International market sentiment. Government interventions in pricing mechanisms.
- Detailed Analysis: Cashew prices in Tanzania are highly sensitive to global market fluctuations. The quality of the nuts, influenced by harvesting and drying methods, plays a crucial role in determining the price fetched by farmers and exporters. Government interventions, such as setting minimum farm-gate prices, also impact price trends.
Cashew in Tanzania Market Product Analysis
The primary product in the Cashew in Tanzania Market is the raw cashew nut (RCN), which serves as the foundation for a global industry. Innovations are focused on enhancing RCN quality through improved farming practices and disease resistance. Post-harvest processing innovations include advanced shelling, peeling, and roasting techniques to produce high-quality cashew kernels for various applications. These kernels are used extensively in the confectionery industry for chocolates and candies, in bakery products, and as a popular snack. Competitive advantages are being built on consistent quality, efficient processing, and adherence to international food safety standards. Technological advancements in processing are enabling the creation of value-added products with extended shelf lives and diverse flavor profiles, catering to evolving consumer demands for healthy and convenient food options.
Key Drivers, Barriers & Challenges in Cashew in Tanzania Market
Key Drivers:
- Global Demand Growth: Increasing consumer demand for healthy snacks and ingredients in confectionery and bakery sectors worldwide.
- Government Support: Proactive government policies, including investments in agricultural inputs and processing infrastructure, to boost production and value addition.
- Favorable Climate and Soil: Tanzania's agro-climatic conditions are conducive to cashew cultivation, supporting significant production volumes.
- Investment in Value Addition: Growing efforts to establish and modernize local cashew processing facilities to capture more value.
Barriers & Challenges:
- Climate Change Vulnerability: Susceptibility to unpredictable weather patterns, such as droughts and excessive rainfall, impacting yields.
- Supply Chain Inefficiencies: Challenges in logistics, storage, and transportation can lead to post-harvest losses and reduced quality.
- Price Volatility: Fluctuations in global cashew prices can impact farmer incomes and market stability.
- Pest and Disease Outbreaks: The threat of cashew diseases and pests can significantly reduce crop yields and quality.
- Limited Access to Finance: Smallholder farmers often face challenges in accessing affordable credit and financing for improving their farming operations.
Growth Drivers in the Cashew in Tanzania Market Market
Growth in the Cashew in Tanzania Market is propelled by a confluence of factors. Technological advancements in cashew cultivation, such as the adoption of improved seed varieties and modern irrigation techniques, are crucial for increasing yield and quality. Economically, the rising global demand for nuts as healthy food options, coupled with Tanzania's competitive production costs, creates a significant market opportunity. Policy-driven initiatives, including government investments in processing factories and the provision of free agricultural inputs to farmers, are directly stimulating production and enhancing value addition capabilities. The emphasis on improving old cashew trees through grafting signifies a strategic approach to maximizing existing agricultural resources.
Challenges Impacting Cashew in Tanzania Market Growth
Despite its potential, the Cashew in Tanzania Market faces significant challenges. Regulatory complexities, while aimed at streamlining the industry, can sometimes create hurdles for smaller players. Supply chain issues, including inadequate storage facilities and inefficient transportation networks, lead to post-harvest losses, estimated to be as high as 15-20% in some regions. Competitive pressures arise from other major cashew-producing nations and the global market's price sensitivity. Furthermore, the impact of climate change, including unpredictable rainfall patterns and the increased prevalence of pests and diseases, poses a constant threat to stable production volumes. Limited access to modern farming equipment and financing for smallholder farmers also restricts overall productivity gains.
Key Players Shaping the Cashew in Tanzania Market Market
- Olam International
- Cashewnut Company Ltd
- Louis Dreyfus Company
- Mtwara Cashewnut Processors Limited
- Bunge Limited
- Tanzania Cashewnut Board
- ADM (Archer Daniels Midland Company)
- Export Trading Group
- Cargill
Significant Cashew in Tanzania Market Industry Milestones
- July 2022: Tanzania Investment Center (TIC) revealed government plans to construct cashew nut processing factories in collaboration with local investors to supply value-added cashew nuts internationally, aiming for higher export value and job creation.
- May 2022: The Government of Tanzania invested USD 26 million to supply free agricultural inputs to cashew farmers across cashew-producing regions, aiming to significantly improve crop production.
- March 2022: The Tanzania Agriculture Research Institute (TARI) actively engaged in improving old cashew trees through grafting and budding techniques to boost productivity by combining parts of old plants with new hybrid ones.
Future Outlook for Cashew in Tanzania Market Market
The future outlook for the Cashew in Tanzania Market is exceptionally promising, driven by sustained global demand for cashew nuts and strategic governmental support for the sector. The ongoing investments in local processing infrastructure are poised to significantly increase the value addition of Tanzanian cashews, moving beyond raw nut exports to higher-margin finished products. Opportunities for expansion into niche markets, such as organic and fair-trade cashews, are substantial, catering to environmentally conscious consumers. Continued research and development in improving crop resilience and yield will be crucial for long-term sustainability. Furthermore, fostering stronger linkages between farmers and processors, coupled with improved logistics, will enhance the overall efficiency and competitiveness of the Tanzanian cashew industry on the global stage. The market is expected to witness continued growth in both volume and value, solidifying Tanzania's position as a key player in the international cashew trade.
Cashew in Tanzania Market Segmentation
- 1. Production Analysis
- 2. Consumption Analysis (Volume and Value)
- 3. Import Market Analysis (Volume and Value)
- 4. Export Market Analysis (Volume and Value)
- 5. Price Trend Analysis
- 6. Production Analysis
- 7. Consumption Analysis (Volume and Value)
- 8. Import Market Analysis (Volume and Value)
- 9. Export Market Analysis (Volume and Value)
- 10. Price Trend Analysis
Cashew in Tanzania Market Segmentation By Geography
-
1. North America
- 1.1. United States
- 1.2. Canada
- 1.3. Mexico
-
2. South America
- 2.1. Brazil
- 2.2. Argentina
- 2.3. Rest of South America
-
3. Europe
- 3.1. United Kingdom
- 3.2. Germany
- 3.3. France
- 3.4. Italy
- 3.5. Spain
- 3.6. Russia
- 3.7. Benelux
- 3.8. Nordics
- 3.9. Rest of Europe
-
4. Middle East & Africa
- 4.1. Turkey
- 4.2. Israel
- 4.3. GCC
- 4.4. North Africa
- 4.5. South Africa
- 4.6. Rest of Middle East & Africa
-
5. Asia Pacific
- 5.1. China
- 5.2. India
- 5.3. Japan
- 5.4. South Korea
- 5.5. ASEAN
- 5.6. Oceania
- 5.7. Rest of Asia Pacific
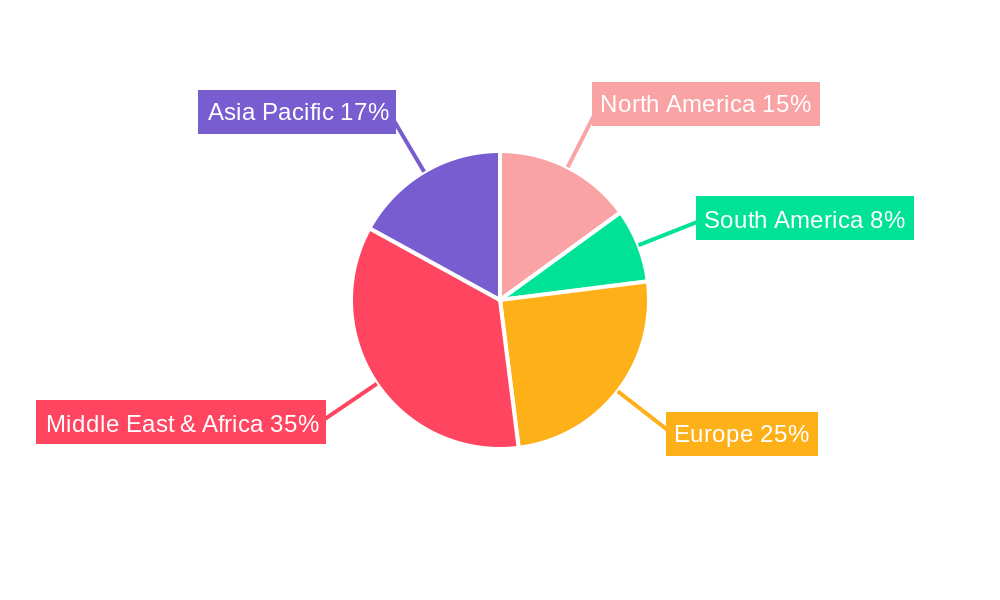
Cashew in Tanzania Market Regional Market Share
Geographic Coverage of Cashew in Tanzania Market
Cashew in Tanzania Market REPORT HIGHLIGHTS
| Aspects | Details |
|---|---|
| Study Period | 2020-2034 |
| Base Year | 2025 |
| Estimated Year | 2026 |
| Forecast Period | 2026-2034 |
| Historical Period | 2020-2025 |
| Growth Rate | CAGR of 4.48% from 2020-2034 |
| Segmentation |
|
Table of Contents
- 1. Introduction
- 1.1. Research Scope
- 1.2. Market Segmentation
- 1.3. Research Objective
- 1.4. Definitions and Assumptions
- 2. Executive Summary
- 2.1. Market Snapshot
- 3. Market Dynamics
- 3.1. Market Drivers
- 3.2. Market Restrains
- 3.3. Market Trends
- 3.4. Market Opportunities
- 4. Market Factor Analysis
- 4.1. Porters Five Forces
- 4.1.1. Bargaining Power of Suppliers
- 4.1.2. Bargaining Power of Buyers
- 4.1.3. Threat of New Entrants
- 4.1.4. Threat of Substitutes
- 4.1.5. Competitive Rivalry
- 4.2. PESTEL analysis
- 4.3. BCG Analysis
- 4.3.1. Stars (High Growth, High Market Share)
- 4.3.2. Cash Cows (Low Growth, High Market Share)
- 4.3.3. Question Mark (High Growth, Low Market Share)
- 4.3.4. Dogs (Low Growth, Low Market Share)
- 4.4. Ansoff Matrix Analysis
- 4.5. Supply Chain Analysis
- 4.6. Regulatory Landscape
- 4.7. Current Market Potential and Opportunity Assessment (TAM–SAM–SOM Framework)
- 4.8. TIR Analyst Note
- 4.1. Porters Five Forces
- 5. Market Analysis, Insights and Forecast 2021-2033
- 5.1. Market Analysis, Insights and Forecast - by Production Analysis
- 5.2. Market Analysis, Insights and Forecast - by Consumption Analysis (Volume and Value)
- 5.3. Market Analysis, Insights and Forecast - by Import Market Analysis (Volume and Value)
- 5.4. Market Analysis, Insights and Forecast - by Export Market Analysis (Volume and Value)
- 5.5. Market Analysis, Insights and Forecast - by Price Trend Analysis
- 5.6. Market Analysis, Insights and Forecast - by Production Analysis
- 5.7. Market Analysis, Insights and Forecast - by Consumption Analysis (Volume and Value)
- 5.8. Market Analysis, Insights and Forecast - by Import Market Analysis (Volume and Value)
- 5.9. Market Analysis, Insights and Forecast - by Export Market Analysis (Volume and Value)
- 5.10. Market Analysis, Insights and Forecast - by Price Trend Analysis
- 5.11. Market Analysis, Insights and Forecast - by Region
- 5.11.1. North America
- 5.11.2. South America
- 5.11.3. Europe
- 5.11.4. Middle East & Africa
- 5.11.5. Asia Pacific
- 6. Global Cashew in Tanzania Market Analysis, Insights and Forecast, 2021-2033
- 6.1. Market Analysis, Insights and Forecast - by Production Analysis
- 6.2. Market Analysis, Insights and Forecast - by Consumption Analysis (Volume and Value)
- 6.3. Market Analysis, Insights and Forecast - by Import Market Analysis (Volume and Value)
- 6.4. Market Analysis, Insights and Forecast - by Export Market Analysis (Volume and Value)
- 6.5. Market Analysis, Insights and Forecast - by Price Trend Analysis
- 6.6. Market Analysis, Insights and Forecast - by Production Analysis
- 6.7. Market Analysis, Insights and Forecast - by Consumption Analysis (Volume and Value)
- 6.8. Market Analysis, Insights and Forecast - by Import Market Analysis (Volume and Value)
- 6.9. Market Analysis, Insights and Forecast - by Export Market Analysis (Volume and Value)
- 6.10. Market Analysis, Insights and Forecast - by Price Trend Analysis
- 7. North America Cashew in Tanzania Market Analysis, Insights and Forecast, 2020-2032
- 7.1. Market Analysis, Insights and Forecast - by Production Analysis
- 7.2. Market Analysis, Insights and Forecast - by Consumption Analysis (Volume and Value)
- 7.3. Market Analysis, Insights and Forecast - by Import Market Analysis (Volume and Value)
- 7.4. Market Analysis, Insights and Forecast - by Export Market Analysis (Volume and Value)
- 7.5. Market Analysis, Insights and Forecast - by Price Trend Analysis
- 7.6. Market Analysis, Insights and Forecast - by Production Analysis
- 7.7. Market Analysis, Insights and Forecast - by Consumption Analysis (Volume and Value)
- 7.8. Market Analysis, Insights and Forecast - by Import Market Analysis (Volume and Value)
- 7.9. Market Analysis, Insights and Forecast - by Export Market Analysis (Volume and Value)
- 7.10. Market Analysis, Insights and Forecast - by Price Trend Analysis
- 8. South America Cashew in Tanzania Market Analysis, Insights and Forecast, 2020-2032
- 8.1. Market Analysis, Insights and Forecast - by Production Analysis
- 8.2. Market Analysis, Insights and Forecast - by Consumption Analysis (Volume and Value)
- 8.3. Market Analysis, Insights and Forecast - by Import Market Analysis (Volume and Value)
- 8.4. Market Analysis, Insights and Forecast - by Export Market Analysis (Volume and Value)
- 8.5. Market Analysis, Insights and Forecast - by Price Trend Analysis
- 8.6. Market Analysis, Insights and Forecast - by Production Analysis
- 8.7. Market Analysis, Insights and Forecast - by Consumption Analysis (Volume and Value)
- 8.8. Market Analysis, Insights and Forecast - by Import Market Analysis (Volume and Value)
- 8.9. Market Analysis, Insights and Forecast - by Export Market Analysis (Volume and Value)
- 8.10. Market Analysis, Insights and Forecast - by Price Trend Analysis
- 9. Europe Cashew in Tanzania Market Analysis, Insights and Forecast, 2020-2032
- 9.1. Market Analysis, Insights and Forecast - by Production Analysis
- 9.2. Market Analysis, Insights and Forecast - by Consumption Analysis (Volume and Value)
- 9.3. Market Analysis, Insights and Forecast - by Import Market Analysis (Volume and Value)
- 9.4. Market Analysis, Insights and Forecast - by Export Market Analysis (Volume and Value)
- 9.5. Market Analysis, Insights and Forecast - by Price Trend Analysis
- 9.6. Market Analysis, Insights and Forecast - by Production Analysis
- 9.7. Market Analysis, Insights and Forecast - by Consumption Analysis (Volume and Value)
- 9.8. Market Analysis, Insights and Forecast - by Import Market Analysis (Volume and Value)
- 9.9. Market Analysis, Insights and Forecast - by Export Market Analysis (Volume and Value)
- 9.10. Market Analysis, Insights and Forecast - by Price Trend Analysis
- 10. Middle East & Africa Cashew in Tanzania Market Analysis, Insights and Forecast, 2020-2032
- 10.1. Market Analysis, Insights and Forecast - by Production Analysis
- 10.2. Market Analysis, Insights and Forecast - by Consumption Analysis (Volume and Value)
- 10.3. Market Analysis, Insights and Forecast - by Import Market Analysis (Volume and Value)
- 10.4. Market Analysis, Insights and Forecast - by Export Market Analysis (Volume and Value)
- 10.5. Market Analysis, Insights and Forecast - by Price Trend Analysis
- 10.6. Market Analysis, Insights and Forecast - by Production Analysis
- 10.7. Market Analysis, Insights and Forecast - by Consumption Analysis (Volume and Value)
- 10.8. Market Analysis, Insights and Forecast - by Import Market Analysis (Volume and Value)
- 10.9. Market Analysis, Insights and Forecast - by Export Market Analysis (Volume and Value)
- 10.10. Market Analysis, Insights and Forecast - by Price Trend Analysis
- 11. Asia Pacific Cashew in Tanzania Market Analysis, Insights and Forecast, 2020-2032
- 11.1. Market Analysis, Insights and Forecast - by Production Analysis
- 11.2. Market Analysis, Insights and Forecast - by Consumption Analysis (Volume and Value)
- 11.3. Market Analysis, Insights and Forecast - by Import Market Analysis (Volume and Value)
- 11.4. Market Analysis, Insights and Forecast - by Export Market Analysis (Volume and Value)
- 11.5. Market Analysis, Insights and Forecast - by Price Trend Analysis
- 11.6. Market Analysis, Insights and Forecast - by Production Analysis
- 11.7. Market Analysis, Insights and Forecast - by Consumption Analysis (Volume and Value)
- 11.8. Market Analysis, Insights and Forecast - by Import Market Analysis (Volume and Value)
- 11.9. Market Analysis, Insights and Forecast - by Export Market Analysis (Volume and Value)
- 11.10. Market Analysis, Insights and Forecast - by Price Trend Analysis
- 12. Competitive Analysis
- 12.1. Company Profiles
- 12.1.1 Olam International
- 12.1.1.1. Company Overview
- 12.1.1.2. Products
- 12.1.1.3. Company Financials
- 12.1.1.4. SWOT Analysis
- 12.1.2 Cashewnut Company Ltd
- 12.1.2.1. Company Overview
- 12.1.2.2. Products
- 12.1.2.3. Company Financials
- 12.1.2.4. SWOT Analysis
- 12.1.3 Louis Dreyfus Company
- 12.1.3.1. Company Overview
- 12.1.3.2. Products
- 12.1.3.3. Company Financials
- 12.1.3.4. SWOT Analysis
- 12.1.4 Olam International
- 12.1.4.1. Company Overview
- 12.1.4.2. Products
- 12.1.4.3. Company Financials
- 12.1.4.4. SWOT Analysis
- 12.1.5 Mtwara Cashewnut Processors Limited
- 12.1.5.1. Company Overview
- 12.1.5.2. Products
- 12.1.5.3. Company Financials
- 12.1.5.4. SWOT Analysis
- 12.1.6 Bunge Limited
- 12.1.6.1. Company Overview
- 12.1.6.2. Products
- 12.1.6.3. Company Financials
- 12.1.6.4. SWOT Analysis
- 12.1.7 Tanzania Cashewnut Board
- 12.1.7.1. Company Overview
- 12.1.7.2. Products
- 12.1.7.3. Company Financials
- 12.1.7.4. SWOT Analysis
- 12.1.8 ADM (Archer Daniels Midland Company)
- 12.1.8.1. Company Overview
- 12.1.8.2. Products
- 12.1.8.3. Company Financials
- 12.1.8.4. SWOT Analysis
- 12.1.9 Export Trading Group
- 12.1.9.1. Company Overview
- 12.1.9.2. Products
- 12.1.9.3. Company Financials
- 12.1.9.4. SWOT Analysis
- 12.1.10 Cargill
- 12.1.10.1. Company Overview
- 12.1.10.2. Products
- 12.1.10.3. Company Financials
- 12.1.10.4. SWOT Analysis
- 12.1.1 Olam International
- 12.2. Market Entropy
- 12.2.1 Company's Key Areas Served
- 12.2.2 Recent Developments
- 12.3. Company Market Share Analysis 2025
- 12.3.1 Top 5 Companies Market Share Analysis
- 12.3.2 Top 3 Companies Market Share Analysis
- 12.4. List of Potential Customers
- 13. Research Methodology
List of Figures
- Figure 1: Global Cashew in Tanzania Market Revenue Breakdown (Million, %) by Region 2025 & 2033
- Figure 2: Global Cashew in Tanzania Market Volume Breakdown (Kiloton, %) by Region 2025 & 2033
- Figure 3: North America Cashew in Tanzania Market Revenue (Million), by Production Analysis 2025 & 2033
- Figure 4: North America Cashew in Tanzania Market Volume (Kiloton), by Production Analysis 2025 & 2033
- Figure 5: North America Cashew in Tanzania Market Revenue Share (%), by Production Analysis 2025 & 2033
- Figure 6: North America Cashew in Tanzania Market Volume Share (%), by Production Analysis 2025 & 2033
- Figure 7: North America Cashew in Tanzania Market Revenue (Million), by Consumption Analysis (Volume and Value) 2025 & 2033
- Figure 8: North America Cashew in Tanzania Market Volume (Kiloton), by Consumption Analysis (Volume and Value) 2025 & 2033
- Figure 9: North America Cashew in Tanzania Market Revenue Share (%), by Consumption Analysis (Volume and Value) 2025 & 2033
- Figure 10: North America Cashew in Tanzania Market Volume Share (%), by Consumption Analysis (Volume and Value) 2025 & 2033
- Figure 11: North America Cashew in Tanzania Market Revenue (Million), by Import Market Analysis (Volume and Value) 2025 & 2033
- Figure 12: North America Cashew in Tanzania Market Volume (Kiloton), by Import Market Analysis (Volume and Value) 2025 & 2033
- Figure 13: North America Cashew in Tanzania Market Revenue Share (%), by Import Market Analysis (Volume and Value) 2025 & 2033
- Figure 14: North America Cashew in Tanzania Market Volume Share (%), by Import Market Analysis (Volume and Value) 2025 & 2033
- Figure 15: North America Cashew in Tanzania Market Revenue (Million), by Export Market Analysis (Volume and Value) 2025 & 2033
- Figure 16: North America Cashew in Tanzania Market Volume (Kiloton), by Export Market Analysis (Volume and Value) 2025 & 2033
- Figure 17: North America Cashew in Tanzania Market Revenue Share (%), by Export Market Analysis (Volume and Value) 2025 & 2033
- Figure 18: North America Cashew in Tanzania Market Volume Share (%), by Export Market Analysis (Volume and Value) 2025 & 2033
- Figure 19: North America Cashew in Tanzania Market Revenue (Million), by Price Trend Analysis 2025 & 2033
- Figure 20: North America Cashew in Tanzania Market Volume (Kiloton), by Price Trend Analysis 2025 & 2033
- Figure 21: North America Cashew in Tanzania Market Revenue Share (%), by Price Trend Analysis 2025 & 2033
- Figure 22: North America Cashew in Tanzania Market Volume Share (%), by Price Trend Analysis 2025 & 2033
- Figure 23: North America Cashew in Tanzania Market Revenue (Million), by Production Analysis 2025 & 2033
- Figure 24: North America Cashew in Tanzania Market Volume (Kiloton), by Production Analysis 2025 & 2033
- Figure 25: North America Cashew in Tanzania Market Revenue Share (%), by Production Analysis 2025 & 2033
- Figure 26: North America Cashew in Tanzania Market Volume Share (%), by Production Analysis 2025 & 2033
- Figure 27: North America Cashew in Tanzania Market Revenue (Million), by Consumption Analysis (Volume and Value) 2025 & 2033
- Figure 28: North America Cashew in Tanzania Market Volume (Kiloton), by Consumption Analysis (Volume and Value) 2025 & 2033
- Figure 29: North America Cashew in Tanzania Market Revenue Share (%), by Consumption Analysis (Volume and Value) 2025 & 2033
- Figure 30: North America Cashew in Tanzania Market Volume Share (%), by Consumption Analysis (Volume and Value) 2025 & 2033
- Figure 31: North America Cashew in Tanzania Market Revenue (Million), by Import Market Analysis (Volume and Value) 2025 & 2033
- Figure 32: North America Cashew in Tanzania Market Volume (Kiloton), by Import Market Analysis (Volume and Value) 2025 & 2033
- Figure 33: North America Cashew in Tanzania Market Revenue Share (%), by Import Market Analysis (Volume and Value) 2025 & 2033
- Figure 34: North America Cashew in Tanzania Market Volume Share (%), by Import Market Analysis (Volume and Value) 2025 & 2033
- Figure 35: North America Cashew in Tanzania Market Revenue (Million), by Export Market Analysis (Volume and Value) 2025 & 2033
- Figure 36: North America Cashew in Tanzania Market Volume (Kiloton), by Export Market Analysis (Volume and Value) 2025 & 2033
- Figure 37: North America Cashew in Tanzania Market Revenue Share (%), by Export Market Analysis (Volume and Value) 2025 & 2033
- Figure 38: North America Cashew in Tanzania Market Volume Share (%), by Export Market Analysis (Volume and Value) 2025 & 2033
- Figure 39: North America Cashew in Tanzania Market Revenue (Million), by Price Trend Analysis 2025 & 2033
- Figure 40: North America Cashew in Tanzania Market Volume (Kiloton), by Price Trend Analysis 2025 & 2033
- Figure 41: North America Cashew in Tanzania Market Revenue Share (%), by Price Trend Analysis 2025 & 2033
- Figure 42: North America Cashew in Tanzania Market Volume Share (%), by Price Trend Analysis 2025 & 2033
- Figure 43: North America Cashew in Tanzania Market Revenue (Million), by Country 2025 & 2033
- Figure 44: North America Cashew in Tanzania Market Volume (Kiloton), by Country 2025 & 2033
- Figure 45: North America Cashew in Tanzania Market Revenue Share (%), by Country 2025 & 2033
- Figure 46: North America Cashew in Tanzania Market Volume Share (%), by Country 2025 & 2033
- Figure 47: South America Cashew in Tanzania Market Revenue (Million), by Production Analysis 2025 & 2033
- Figure 48: South America Cashew in Tanzania Market Volume (Kiloton), by Production Analysis 2025 & 2033
- Figure 49: South America Cashew in Tanzania Market Revenue Share (%), by Production Analysis 2025 & 2033
- Figure 50: South America Cashew in Tanzania Market Volume Share (%), by Production Analysis 2025 & 2033
- Figure 51: South America Cashew in Tanzania Market Revenue (Million), by Consumption Analysis (Volume and Value) 2025 & 2033
- Figure 52: South America Cashew in Tanzania Market Volume (Kiloton), by Consumption Analysis (Volume and Value) 2025 & 2033
- Figure 53: South America Cashew in Tanzania Market Revenue Share (%), by Consumption Analysis (Volume and Value) 2025 & 2033
- Figure 54: South America Cashew in Tanzania Market Volume Share (%), by Consumption Analysis (Volume and Value) 2025 & 2033
- Figure 55: South America Cashew in Tanzania Market Revenue (Million), by Import Market Analysis (Volume and Value) 2025 & 2033
- Figure 56: South America Cashew in Tanzania Market Volume (Kiloton), by Import Market Analysis (Volume and Value) 2025 & 2033
- Figure 57: South America Cashew in Tanzania Market Revenue Share (%), by Import Market Analysis (Volume and Value) 2025 & 2033
- Figure 58: South America Cashew in Tanzania Market Volume Share (%), by Import Market Analysis (Volume and Value) 2025 & 2033
- Figure 59: South America Cashew in Tanzania Market Revenue (Million), by Export Market Analysis (Volume and Value) 2025 & 2033
- Figure 60: South America Cashew in Tanzania Market Volume (Kiloton), by Export Market Analysis (Volume and Value) 2025 & 2033
- Figure 61: South America Cashew in Tanzania Market Revenue Share (%), by Export Market Analysis (Volume and Value) 2025 & 2033
- Figure 62: South America Cashew in Tanzania Market Volume Share (%), by Export Market Analysis (Volume and Value) 2025 & 2033
- Figure 63: South America Cashew in Tanzania Market Revenue (Million), by Price Trend Analysis 2025 & 2033
- Figure 64: South America Cashew in Tanzania Market Volume (Kiloton), by Price Trend Analysis 2025 & 2033
- Figure 65: South America Cashew in Tanzania Market Revenue Share (%), by Price Trend Analysis 2025 & 2033
- Figure 66: South America Cashew in Tanzania Market Volume Share (%), by Price Trend Analysis 2025 & 2033
- Figure 67: South America Cashew in Tanzania Market Revenue (Million), by Production Analysis 2025 & 2033
- Figure 68: South America Cashew in Tanzania Market Volume (Kiloton), by Production Analysis 2025 & 2033
- Figure 69: South America Cashew in Tanzania Market Revenue Share (%), by Production Analysis 2025 & 2033
- Figure 70: South America Cashew in Tanzania Market Volume Share (%), by Production Analysis 2025 & 2033
- Figure 71: South America Cashew in Tanzania Market Revenue (Million), by Consumption Analysis (Volume and Value) 2025 & 2033
- Figure 72: South America Cashew in Tanzania Market Volume (Kiloton), by Consumption Analysis (Volume and Value) 2025 & 2033
- Figure 73: South America Cashew in Tanzania Market Revenue Share (%), by Consumption Analysis (Volume and Value) 2025 & 2033
- Figure 74: South America Cashew in Tanzania Market Volume Share (%), by Consumption Analysis (Volume and Value) 2025 & 2033
- Figure 75: South America Cashew in Tanzania Market Revenue (Million), by Import Market Analysis (Volume and Value) 2025 & 2033
- Figure 76: South America Cashew in Tanzania Market Volume (Kiloton), by Import Market Analysis (Volume and Value) 2025 & 2033
- Figure 77: South America Cashew in Tanzania Market Revenue Share (%), by Import Market Analysis (Volume and Value) 2025 & 2033
- Figure 78: South America Cashew in Tanzania Market Volume Share (%), by Import Market Analysis (Volume and Value) 2025 & 2033
- Figure 79: South America Cashew in Tanzania Market Revenue (Million), by Export Market Analysis (Volume and Value) 2025 & 2033
- Figure 80: South America Cashew in Tanzania Market Volume (Kiloton), by Export Market Analysis (Volume and Value) 2025 & 2033
- Figure 81: South America Cashew in Tanzania Market Revenue Share (%), by Export Market Analysis (Volume and Value) 2025 & 2033
- Figure 82: South America Cashew in Tanzania Market Volume Share (%), by Export Market Analysis (Volume and Value) 2025 & 2033
- Figure 83: South America Cashew in Tanzania Market Revenue (Million), by Price Trend Analysis 2025 & 2033
- Figure 84: South America Cashew in Tanzania Market Volume (Kiloton), by Price Trend Analysis 2025 & 2033
- Figure 85: South America Cashew in Tanzania Market Revenue Share (%), by Price Trend Analysis 2025 & 2033
- Figure 86: South America Cashew in Tanzania Market Volume Share (%), by Price Trend Analysis 2025 & 2033
- Figure 87: South America Cashew in Tanzania Market Revenue (Million), by Country 2025 & 2033
- Figure 88: South America Cashew in Tanzania Market Volume (Kiloton), by Country 2025 & 2033
- Figure 89: South America Cashew in Tanzania Market Revenue Share (%), by Country 2025 & 2033
- Figure 90: South America Cashew in Tanzania Market Volume Share (%), by Country 2025 & 2033
- Figure 91: Europe Cashew in Tanzania Market Revenue (Million), by Production Analysis 2025 & 2033
- Figure 92: Europe Cashew in Tanzania Market Volume (Kiloton), by Production Analysis 2025 & 2033
- Figure 93: Europe Cashew in Tanzania Market Revenue Share (%), by Production Analysis 2025 & 2033
- Figure 94: Europe Cashew in Tanzania Market Volume Share (%), by Production Analysis 2025 & 2033
- Figure 95: Europe Cashew in Tanzania Market Revenue (Million), by Consumption Analysis (Volume and Value) 2025 & 2033
- Figure 96: Europe Cashew in Tanzania Market Volume (Kiloton), by Consumption Analysis (Volume and Value) 2025 & 2033
- Figure 97: Europe Cashew in Tanzania Market Revenue Share (%), by Consumption Analysis (Volume and Value) 2025 & 2033
- Figure 98: Europe Cashew in Tanzania Market Volume Share (%), by Consumption Analysis (Volume and Value) 2025 & 2033
- Figure 99: Europe Cashew in Tanzania Market Revenue (Million), by Import Market Analysis (Volume and Value) 2025 & 2033
- Figure 100: Europe Cashew in Tanzania Market Volume (Kiloton), by Import Market Analysis (Volume and Value) 2025 & 2033
- Figure 101: Europe Cashew in Tanzania Market Revenue Share (%), by Import Market Analysis (Volume and Value) 2025 & 2033
- Figure 102: Europe Cashew in Tanzania Market Volume Share (%), by Import Market Analysis (Volume and Value) 2025 & 2033
- Figure 103: Europe Cashew in Tanzania Market Revenue (Million), by Export Market Analysis (Volume and Value) 2025 & 2033
- Figure 104: Europe Cashew in Tanzania Market Volume (Kiloton), by Export Market Analysis (Volume and Value) 2025 & 2033
- Figure 105: Europe Cashew in Tanzania Market Revenue Share (%), by Export Market Analysis (Volume and Value) 2025 & 2033
- Figure 106: Europe Cashew in Tanzania Market Volume Share (%), by Export Market Analysis (Volume and Value) 2025 & 2033
- Figure 107: Europe Cashew in Tanzania Market Revenue (Million), by Price Trend Analysis 2025 & 2033
- Figure 108: Europe Cashew in Tanzania Market Volume (Kiloton), by Price Trend Analysis 2025 & 2033
- Figure 109: Europe Cashew in Tanzania Market Revenue Share (%), by Price Trend Analysis 2025 & 2033
- Figure 110: Europe Cashew in Tanzania Market Volume Share (%), by Price Trend Analysis 2025 & 2033
- Figure 111: Europe Cashew in Tanzania Market Revenue (Million), by Production Analysis 2025 & 2033
- Figure 112: Europe Cashew in Tanzania Market Volume (Kiloton), by Production Analysis 2025 & 2033
- Figure 113: Europe Cashew in Tanzania Market Revenue Share (%), by Production Analysis 2025 & 2033
- Figure 114: Europe Cashew in Tanzania Market Volume Share (%), by Production Analysis 2025 & 2033
- Figure 115: Europe Cashew in Tanzania Market Revenue (Million), by Consumption Analysis (Volume and Value) 2025 & 2033
- Figure 116: Europe Cashew in Tanzania Market Volume (Kiloton), by Consumption Analysis (Volume and Value) 2025 & 2033
- Figure 117: Europe Cashew in Tanzania Market Revenue Share (%), by Consumption Analysis (Volume and Value) 2025 & 2033
- Figure 118: Europe Cashew in Tanzania Market Volume Share (%), by Consumption Analysis (Volume and Value) 2025 & 2033
- Figure 119: Europe Cashew in Tanzania Market Revenue (Million), by Import Market Analysis (Volume and Value) 2025 & 2033
- Figure 120: Europe Cashew in Tanzania Market Volume (Kiloton), by Import Market Analysis (Volume and Value) 2025 & 2033
- Figure 121: Europe Cashew in Tanzania Market Revenue Share (%), by Import Market Analysis (Volume and Value) 2025 & 2033
- Figure 122: Europe Cashew in Tanzania Market Volume Share (%), by Import Market Analysis (Volume and Value) 2025 & 2033
- Figure 123: Europe Cashew in Tanzania Market Revenue (Million), by Export Market Analysis (Volume and Value) 2025 & 2033
- Figure 124: Europe Cashew in Tanzania Market Volume (Kiloton), by Export Market Analysis (Volume and Value) 2025 & 2033
- Figure 125: Europe Cashew in Tanzania Market Revenue Share (%), by Export Market Analysis (Volume and Value) 2025 & 2033
- Figure 126: Europe Cashew in Tanzania Market Volume Share (%), by Export Market Analysis (Volume and Value) 2025 & 2033
- Figure 127: Europe Cashew in Tanzania Market Revenue (Million), by Price Trend Analysis 2025 & 2033
- Figure 128: Europe Cashew in Tanzania Market Volume (Kiloton), by Price Trend Analysis 2025 & 2033
- Figure 129: Europe Cashew in Tanzania Market Revenue Share (%), by Price Trend Analysis 2025 & 2033
- Figure 130: Europe Cashew in Tanzania Market Volume Share (%), by Price Trend Analysis 2025 & 2033
- Figure 131: Europe Cashew in Tanzania Market Revenue (Million), by Country 2025 & 2033
- Figure 132: Europe Cashew in Tanzania Market Volume (Kiloton), by Country 2025 & 2033
- Figure 133: Europe Cashew in Tanzania Market Revenue Share (%), by Country 2025 & 2033
- Figure 134: Europe Cashew in Tanzania Market Volume Share (%), by Country 2025 & 2033
- Figure 135: Middle East & Africa Cashew in Tanzania Market Revenue (Million), by Production Analysis 2025 & 2033
- Figure 136: Middle East & Africa Cashew in Tanzania Market Volume (Kiloton), by Production Analysis 2025 & 2033
- Figure 137: Middle East & Africa Cashew in Tanzania Market Revenue Share (%), by Production Analysis 2025 & 2033
- Figure 138: Middle East & Africa Cashew in Tanzania Market Volume Share (%), by Production Analysis 2025 & 2033
- Figure 139: Middle East & Africa Cashew in Tanzania Market Revenue (Million), by Consumption Analysis (Volume and Value) 2025 & 2033
- Figure 140: Middle East & Africa Cashew in Tanzania Market Volume (Kiloton), by Consumption Analysis (Volume and Value) 2025 & 2033
- Figure 141: Middle East & Africa Cashew in Tanzania Market Revenue Share (%), by Consumption Analysis (Volume and Value) 2025 & 2033
- Figure 142: Middle East & Africa Cashew in Tanzania Market Volume Share (%), by Consumption Analysis (Volume and Value) 2025 & 2033
- Figure 143: Middle East & Africa Cashew in Tanzania Market Revenue (Million), by Import Market Analysis (Volume and Value) 2025 & 2033
- Figure 144: Middle East & Africa Cashew in Tanzania Market Volume (Kiloton), by Import Market Analysis (Volume and Value) 2025 & 2033
- Figure 145: Middle East & Africa Cashew in Tanzania Market Revenue Share (%), by Import Market Analysis (Volume and Value) 2025 & 2033
- Figure 146: Middle East & Africa Cashew in Tanzania Market Volume Share (%), by Import Market Analysis (Volume and Value) 2025 & 2033
- Figure 147: Middle East & Africa Cashew in Tanzania Market Revenue (Million), by Export Market Analysis (Volume and Value) 2025 & 2033
- Figure 148: Middle East & Africa Cashew in Tanzania Market Volume (Kiloton), by Export Market Analysis (Volume and Value) 2025 & 2033
- Figure 149: Middle East & Africa Cashew in Tanzania Market Revenue Share (%), by Export Market Analysis (Volume and Value) 2025 & 2033
- Figure 150: Middle East & Africa Cashew in Tanzania Market Volume Share (%), by Export Market Analysis (Volume and Value) 2025 & 2033
- Figure 151: Middle East & Africa Cashew in Tanzania Market Revenue (Million), by Price Trend Analysis 2025 & 2033
- Figure 152: Middle East & Africa Cashew in Tanzania Market Volume (Kiloton), by Price Trend Analysis 2025 & 2033
- Figure 153: Middle East & Africa Cashew in Tanzania Market Revenue Share (%), by Price Trend Analysis 2025 & 2033
- Figure 154: Middle East & Africa Cashew in Tanzania Market Volume Share (%), by Price Trend Analysis 2025 & 2033
- Figure 155: Middle East & Africa Cashew in Tanzania Market Revenue (Million), by Production Analysis 2025 & 2033
- Figure 156: Middle East & Africa Cashew in Tanzania Market Volume (Kiloton), by Production Analysis 2025 & 2033
- Figure 157: Middle East & Africa Cashew in Tanzania Market Revenue Share (%), by Production Analysis 2025 & 2033
- Figure 158: Middle East & Africa Cashew in Tanzania Market Volume Share (%), by Production Analysis 2025 & 2033
- Figure 159: Middle East & Africa Cashew in Tanzania Market Revenue (Million), by Consumption Analysis (Volume and Value) 2025 & 2033
- Figure 160: Middle East & Africa Cashew in Tanzania Market Volume (Kiloton), by Consumption Analysis (Volume and Value) 2025 & 2033
- Figure 161: Middle East & Africa Cashew in Tanzania Market Revenue Share (%), by Consumption Analysis (Volume and Value) 2025 & 2033
- Figure 162: Middle East & Africa Cashew in Tanzania Market Volume Share (%), by Consumption Analysis (Volume and Value) 2025 & 2033
- Figure 163: Middle East & Africa Cashew in Tanzania Market Revenue (Million), by Import Market Analysis (Volume and Value) 2025 & 2033
- Figure 164: Middle East & Africa Cashew in Tanzania Market Volume (Kiloton), by Import Market Analysis (Volume and Value) 2025 & 2033
- Figure 165: Middle East & Africa Cashew in Tanzania Market Revenue Share (%), by Import Market Analysis (Volume and Value) 2025 & 2033
- Figure 166: Middle East & Africa Cashew in Tanzania Market Volume Share (%), by Import Market Analysis (Volume and Value) 2025 & 2033
- Figure 167: Middle East & Africa Cashew in Tanzania Market Revenue (Million), by Export Market Analysis (Volume and Value) 2025 & 2033
- Figure 168: Middle East & Africa Cashew in Tanzania Market Volume (Kiloton), by Export Market Analysis (Volume and Value) 2025 & 2033
- Figure 169: Middle East & Africa Cashew in Tanzania Market Revenue Share (%), by Export Market Analysis (Volume and Value) 2025 & 2033
- Figure 170: Middle East & Africa Cashew in Tanzania Market Volume Share (%), by Export Market Analysis (Volume and Value) 2025 & 2033
- Figure 171: Middle East & Africa Cashew in Tanzania Market Revenue (Million), by Price Trend Analysis 2025 & 2033
- Figure 172: Middle East & Africa Cashew in Tanzania Market Volume (Kiloton), by Price Trend Analysis 2025 & 2033
- Figure 173: Middle East & Africa Cashew in Tanzania Market Revenue Share (%), by Price Trend Analysis 2025 & 2033
- Figure 174: Middle East & Africa Cashew in Tanzania Market Volume Share (%), by Price Trend Analysis 2025 & 2033
- Figure 175: Middle East & Africa Cashew in Tanzania Market Revenue (Million), by Country 2025 & 2033
- Figure 176: Middle East & Africa Cashew in Tanzania Market Volume (Kiloton), by Country 2025 & 2033
- Figure 177: Middle East & Africa Cashew in Tanzania Market Revenue Share (%), by Country 2025 & 2033
- Figure 178: Middle East & Africa Cashew in Tanzania Market Volume Share (%), by Country 2025 & 2033
- Figure 179: Asia Pacific Cashew in Tanzania Market Revenue (Million), by Production Analysis 2025 & 2033
- Figure 180: Asia Pacific Cashew in Tanzania Market Volume (Kiloton), by Production Analysis 2025 & 2033
- Figure 181: Asia Pacific Cashew in Tanzania Market Revenue Share (%), by Production Analysis 2025 & 2033
- Figure 182: Asia Pacific Cashew in Tanzania Market Volume Share (%), by Production Analysis 2025 & 2033
- Figure 183: Asia Pacific Cashew in Tanzania Market Revenue (Million), by Consumption Analysis (Volume and Value) 2025 & 2033
- Figure 184: Asia Pacific Cashew in Tanzania Market Volume (Kiloton), by Consumption Analysis (Volume and Value) 2025 & 2033
- Figure 185: Asia Pacific Cashew in Tanzania Market Revenue Share (%), by Consumption Analysis (Volume and Value) 2025 & 2033
- Figure 186: Asia Pacific Cashew in Tanzania Market Volume Share (%), by Consumption Analysis (Volume and Value) 2025 & 2033
- Figure 187: Asia Pacific Cashew in Tanzania Market Revenue (Million), by Import Market Analysis (Volume and Value) 2025 & 2033
- Figure 188: Asia Pacific Cashew in Tanzania Market Volume (Kiloton), by Import Market Analysis (Volume and Value) 2025 & 2033
- Figure 189: Asia Pacific Cashew in Tanzania Market Revenue Share (%), by Import Market Analysis (Volume and Value) 2025 & 2033
- Figure 190: Asia Pacific Cashew in Tanzania Market Volume Share (%), by Import Market Analysis (Volume and Value) 2025 & 2033
- Figure 191: Asia Pacific Cashew in Tanzania Market Revenue (Million), by Export Market Analysis (Volume and Value) 2025 & 2033
- Figure 192: Asia Pacific Cashew in Tanzania Market Volume (Kiloton), by Export Market Analysis (Volume and Value) 2025 & 2033
- Figure 193: Asia Pacific Cashew in Tanzania Market Revenue Share (%), by Export Market Analysis (Volume and Value) 2025 & 2033
- Figure 194: Asia Pacific Cashew in Tanzania Market Volume Share (%), by Export Market Analysis (Volume and Value) 2025 & 2033
- Figure 195: Asia Pacific Cashew in Tanzania Market Revenue (Million), by Price Trend Analysis 2025 & 2033
- Figure 196: Asia Pacific Cashew in Tanzania Market Volume (Kiloton), by Price Trend Analysis 2025 & 2033
- Figure 197: Asia Pacific Cashew in Tanzania Market Revenue Share (%), by Price Trend Analysis 2025 & 2033
- Figure 198: Asia Pacific Cashew in Tanzania Market Volume Share (%), by Price Trend Analysis 2025 & 2033
- Figure 199: Asia Pacific Cashew in Tanzania Market Revenue (Million), by Production Analysis 2025 & 2033
- Figure 200: Asia Pacific Cashew in Tanzania Market Volume (Kiloton), by Production Analysis 2025 & 2033
- Figure 201: Asia Pacific Cashew in Tanzania Market Revenue Share (%), by Production Analysis 2025 & 2033
- Figure 202: Asia Pacific Cashew in Tanzania Market Volume Share (%), by Production Analysis 2025 & 2033
- Figure 203: Asia Pacific Cashew in Tanzania Market Revenue (Million), by Consumption Analysis (Volume and Value) 2025 & 2033
- Figure 204: Asia Pacific Cashew in Tanzania Market Volume (Kiloton), by Consumption Analysis (Volume and Value) 2025 & 2033
- Figure 205: Asia Pacific Cashew in Tanzania Market Revenue Share (%), by Consumption Analysis (Volume and Value) 2025 & 2033
- Figure 206: Asia Pacific Cashew in Tanzania Market Volume Share (%), by Consumption Analysis (Volume and Value) 2025 & 2033
- Figure 207: Asia Pacific Cashew in Tanzania Market Revenue (Million), by Import Market Analysis (Volume and Value) 2025 & 2033
- Figure 208: Asia Pacific Cashew in Tanzania Market Volume (Kiloton), by Import Market Analysis (Volume and Value) 2025 & 2033
- Figure 209: Asia Pacific Cashew in Tanzania Market Revenue Share (%), by Import Market Analysis (Volume and Value) 2025 & 2033
- Figure 210: Asia Pacific Cashew in Tanzania Market Volume Share (%), by Import Market Analysis (Volume and Value) 2025 & 2033
- Figure 211: Asia Pacific Cashew in Tanzania Market Revenue (Million), by Export Market Analysis (Volume and Value) 2025 & 2033
- Figure 212: Asia Pacific Cashew in Tanzania Market Volume (Kiloton), by Export Market Analysis (Volume and Value) 2025 & 2033
- Figure 213: Asia Pacific Cashew in Tanzania Market Revenue Share (%), by Export Market Analysis (Volume and Value) 2025 & 2033
- Figure 214: Asia Pacific Cashew in Tanzania Market Volume Share (%), by Export Market Analysis (Volume and Value) 2025 & 2033
- Figure 215: Asia Pacific Cashew in Tanzania Market Revenue (Million), by Price Trend Analysis 2025 & 2033
- Figure 216: Asia Pacific Cashew in Tanzania Market Volume (Kiloton), by Price Trend Analysis 2025 & 2033
- Figure 217: Asia Pacific Cashew in Tanzania Market Revenue Share (%), by Price Trend Analysis 2025 & 2033
- Figure 218: Asia Pacific Cashew in Tanzania Market Volume Share (%), by Price Trend Analysis 2025 & 2033
- Figure 219: Asia Pacific Cashew in Tanzania Market Revenue (Million), by Country 2025 & 2033
- Figure 220: Asia Pacific Cashew in Tanzania Market Volume (Kiloton), by Country 2025 & 2033
- Figure 221: Asia Pacific Cashew in Tanzania Market Revenue Share (%), by Country 2025 & 2033
- Figure 222: Asia Pacific Cashew in Tanzania Market Volume Share (%), by Country 2025 & 2033
List of Tables
- Table 1: Global Cashew in Tanzania Market Revenue Million Forecast, by Production Analysis 2020 & 2033
- Table 2: Global Cashew in Tanzania Market Volume Kiloton Forecast, by Production Analysis 2020 & 2033
- Table 3: Global Cashew in Tanzania Market Revenue Million Forecast, by Consumption Analysis (Volume and Value) 2020 & 2033
- Table 4: Global Cashew in Tanzania Market Volume Kiloton Forecast, by Consumption Analysis (Volume and Value) 2020 & 2033
- Table 5: Global Cashew in Tanzania Market Revenue Million Forecast, by Import Market Analysis (Volume and Value) 2020 & 2033
- Table 6: Global Cashew in Tanzania Market Volume Kiloton Forecast, by Import Market Analysis (Volume and Value) 2020 & 2033
- Table 7: Global Cashew in Tanzania Market Revenue Million Forecast, by Export Market Analysis (Volume and Value) 2020 & 2033
- Table 8: Global Cashew in Tanzania Market Volume Kiloton Forecast, by Export Market Analysis (Volume and Value) 2020 & 2033
- Table 9: Global Cashew in Tanzania Market Revenue Million Forecast, by Price Trend Analysis 2020 & 2033
- Table 10: Global Cashew in Tanzania Market Volume Kiloton Forecast, by Price Trend Analysis 2020 & 2033
- Table 11: Global Cashew in Tanzania Market Revenue Million Forecast, by Production Analysis 2020 & 2033
- Table 12: Global Cashew in Tanzania Market Volume Kiloton Forecast, by Production Analysis 2020 & 2033
- Table 13: Global Cashew in Tanzania Market Revenue Million Forecast, by Consumption Analysis (Volume and Value) 2020 & 2033
- Table 14: Global Cashew in Tanzania Market Volume Kiloton Forecast, by Consumption Analysis (Volume and Value) 2020 & 2033
- Table 15: Global Cashew in Tanzania Market Revenue Million Forecast, by Import Market Analysis (Volume and Value) 2020 & 2033
- Table 16: Global Cashew in Tanzania Market Volume Kiloton Forecast, by Import Market Analysis (Volume and Value) 2020 & 2033
- Table 17: Global Cashew in Tanzania Market Revenue Million Forecast, by Export Market Analysis (Volume and Value) 2020 & 2033
- Table 18: Global Cashew in Tanzania Market Volume Kiloton Forecast, by Export Market Analysis (Volume and Value) 2020 & 2033
- Table 19: Global Cashew in Tanzania Market Revenue Million Forecast, by Price Trend Analysis 2020 & 2033
- Table 20: Global Cashew in Tanzania Market Volume Kiloton Forecast, by Price Trend Analysis 2020 & 2033
- Table 21: Global Cashew in Tanzania Market Revenue Million Forecast, by Region 2020 & 2033
- Table 22: Global Cashew in Tanzania Market Volume Kiloton Forecast, by Region 2020 & 2033
- Table 23: Global Cashew in Tanzania Market Revenue Million Forecast, by Production Analysis 2020 & 2033
- Table 24: Global Cashew in Tanzania Market Volume Kiloton Forecast, by Production Analysis 2020 & 2033
- Table 25: Global Cashew in Tanzania Market Revenue Million Forecast, by Consumption Analysis (Volume and Value) 2020 & 2033
- Table 26: Global Cashew in Tanzania Market Volume Kiloton Forecast, by Consumption Analysis (Volume and Value) 2020 & 2033
- Table 27: Global Cashew in Tanzania Market Revenue Million Forecast, by Import Market Analysis (Volume and Value) 2020 & 2033
- Table 28: Global Cashew in Tanzania Market Volume Kiloton Forecast, by Import Market Analysis (Volume and Value) 2020 & 2033
- Table 29: Global Cashew in Tanzania Market Revenue Million Forecast, by Export Market Analysis (Volume and Value) 2020 & 2033
- Table 30: Global Cashew in Tanzania Market Volume Kiloton Forecast, by Export Market Analysis (Volume and Value) 2020 & 2033
- Table 31: Global Cashew in Tanzania Market Revenue Million Forecast, by Price Trend Analysis 2020 & 2033
- Table 32: Global Cashew in Tanzania Market Volume Kiloton Forecast, by Price Trend Analysis 2020 & 2033
- Table 33: Global Cashew in Tanzania Market Revenue Million Forecast, by Production Analysis 2020 & 2033
- Table 34: Global Cashew in Tanzania Market Volume Kiloton Forecast, by Production Analysis 2020 & 2033
- Table 35: Global Cashew in Tanzania Market Revenue Million Forecast, by Consumption Analysis (Volume and Value) 2020 & 2033
- Table 36: Global Cashew in Tanzania Market Volume Kiloton Forecast, by Consumption Analysis (Volume and Value) 2020 & 2033
- Table 37: Global Cashew in Tanzania Market Revenue Million Forecast, by Import Market Analysis (Volume and Value) 2020 & 2033
- Table 38: Global Cashew in Tanzania Market Volume Kiloton Forecast, by Import Market Analysis (Volume and Value) 2020 & 2033
- Table 39: Global Cashew in Tanzania Market Revenue Million Forecast, by Export Market Analysis (Volume and Value) 2020 & 2033
- Table 40: Global Cashew in Tanzania Market Volume Kiloton Forecast, by Export Market Analysis (Volume and Value) 2020 & 2033
- Table 41: Global Cashew in Tanzania Market Revenue Million Forecast, by Price Trend Analysis 2020 & 2033
- Table 42: Global Cashew in Tanzania Market Volume Kiloton Forecast, by Price Trend Analysis 2020 & 2033
- Table 43: Global Cashew in Tanzania Market Revenue Million Forecast, by Country 2020 & 2033
- Table 44: Global Cashew in Tanzania Market Volume Kiloton Forecast, by Country 2020 & 2033
- Table 45: United States Cashew in Tanzania Market Revenue (Million) Forecast, by Application 2020 & 2033
- Table 46: United States Cashew in Tanzania Market Volume (Kiloton) Forecast, by Application 2020 & 2033
- Table 47: Canada Cashew in Tanzania Market Revenue (Million) Forecast, by Application 2020 & 2033
- Table 48: Canada Cashew in Tanzania Market Volume (Kiloton) Forecast, by Application 2020 & 2033
- Table 49: Mexico Cashew in Tanzania Market Revenue (Million) Forecast, by Application 2020 & 2033
- Table 50: Mexico Cashew in Tanzania Market Volume (Kiloton) Forecast, by Application 2020 & 2033
- Table 51: Global Cashew in Tanzania Market Revenue Million Forecast, by Production Analysis 2020 & 2033
- Table 52: Global Cashew in Tanzania Market Volume Kiloton Forecast, by Production Analysis 2020 & 2033
- Table 53: Global Cashew in Tanzania Market Revenue Million Forecast, by Consumption Analysis (Volume and Value) 2020 & 2033
- Table 54: Global Cashew in Tanzania Market Volume Kiloton Forecast, by Consumption Analysis (Volume and Value) 2020 & 2033
- Table 55: Global Cashew in Tanzania Market Revenue Million Forecast, by Import Market Analysis (Volume and Value) 2020 & 2033
- Table 56: Global Cashew in Tanzania Market Volume Kiloton Forecast, by Import Market Analysis (Volume and Value) 2020 & 2033
- Table 57: Global Cashew in Tanzania Market Revenue Million Forecast, by Export Market Analysis (Volume and Value) 2020 & 2033
- Table 58: Global Cashew in Tanzania Market Volume Kiloton Forecast, by Export Market Analysis (Volume and Value) 2020 & 2033
- Table 59: Global Cashew in Tanzania Market Revenue Million Forecast, by Price Trend Analysis 2020 & 2033
- Table 60: Global Cashew in Tanzania Market Volume Kiloton Forecast, by Price Trend Analysis 2020 & 2033
- Table 61: Global Cashew in Tanzania Market Revenue Million Forecast, by Production Analysis 2020 & 2033
- Table 62: Global Cashew in Tanzania Market Volume Kiloton Forecast, by Production Analysis 2020 & 2033
- Table 63: Global Cashew in Tanzania Market Revenue Million Forecast, by Consumption Analysis (Volume and Value) 2020 & 2033
- Table 64: Global Cashew in Tanzania Market Volume Kiloton Forecast, by Consumption Analysis (Volume and Value) 2020 & 2033
- Table 65: Global Cashew in Tanzania Market Revenue Million Forecast, by Import Market Analysis (Volume and Value) 2020 & 2033
- Table 66: Global Cashew in Tanzania Market Volume Kiloton Forecast, by Import Market Analysis (Volume and Value) 2020 & 2033
- Table 67: Global Cashew in Tanzania Market Revenue Million Forecast, by Export Market Analysis (Volume and Value) 2020 & 2033
- Table 68: Global Cashew in Tanzania Market Volume Kiloton Forecast, by Export Market Analysis (Volume and Value) 2020 & 2033
- Table 69: Global Cashew in Tanzania Market Revenue Million Forecast, by Price Trend Analysis 2020 & 2033
- Table 70: Global Cashew in Tanzania Market Volume Kiloton Forecast, by Price Trend Analysis 2020 & 2033
- Table 71: Global Cashew in Tanzania Market Revenue Million Forecast, by Country 2020 & 2033
- Table 72: Global Cashew in Tanzania Market Volume Kiloton Forecast, by Country 2020 & 2033
- Table 73: Brazil Cashew in Tanzania Market Revenue (Million) Forecast, by Application 2020 & 2033
- Table 74: Brazil Cashew in Tanzania Market Volume (Kiloton) Forecast, by Application 2020 & 2033
- Table 75: Argentina Cashew in Tanzania Market Revenue (Million) Forecast, by Application 2020 & 2033
- Table 76: Argentina Cashew in Tanzania Market Volume (Kiloton) Forecast, by Application 2020 & 2033
- Table 77: Rest of South America Cashew in Tanzania Market Revenue (Million) Forecast, by Application 2020 & 2033
- Table 78: Rest of South America Cashew in Tanzania Market Volume (Kiloton) Forecast, by Application 2020 & 2033
- Table 79: Global Cashew in Tanzania Market Revenue Million Forecast, by Production Analysis 2020 & 2033
- Table 80: Global Cashew in Tanzania Market Volume Kiloton Forecast, by Production Analysis 2020 & 2033
- Table 81: Global Cashew in Tanzania Market Revenue Million Forecast, by Consumption Analysis (Volume and Value) 2020 & 2033
- Table 82: Global Cashew in Tanzania Market Volume Kiloton Forecast, by Consumption Analysis (Volume and Value) 2020 & 2033
- Table 83: Global Cashew in Tanzania Market Revenue Million Forecast, by Import Market Analysis (Volume and Value) 2020 & 2033
- Table 84: Global Cashew in Tanzania Market Volume Kiloton Forecast, by Import Market Analysis (Volume and Value) 2020 & 2033
- Table 85: Global Cashew in Tanzania Market Revenue Million Forecast, by Export Market Analysis (Volume and Value) 2020 & 2033
- Table 86: Global Cashew in Tanzania Market Volume Kiloton Forecast, by Export Market Analysis (Volume and Value) 2020 & 2033
- Table 87: Global Cashew in Tanzania Market Revenue Million Forecast, by Price Trend Analysis 2020 & 2033
- Table 88: Global Cashew in Tanzania Market Volume Kiloton Forecast, by Price Trend Analysis 2020 & 2033
- Table 89: Global Cashew in Tanzania Market Revenue Million Forecast, by Production Analysis 2020 & 2033
- Table 90: Global Cashew in Tanzania Market Volume Kiloton Forecast, by Production Analysis 2020 & 2033
- Table 91: Global Cashew in Tanzania Market Revenue Million Forecast, by Consumption Analysis (Volume and Value) 2020 & 2033
- Table 92: Global Cashew in Tanzania Market Volume Kiloton Forecast, by Consumption Analysis (Volume and Value) 2020 & 2033
- Table 93: Global Cashew in Tanzania Market Revenue Million Forecast, by Import Market Analysis (Volume and Value) 2020 & 2033
- Table 94: Global Cashew in Tanzania Market Volume Kiloton Forecast, by Import Market Analysis (Volume and Value) 2020 & 2033
- Table 95: Global Cashew in Tanzania Market Revenue Million Forecast, by Export Market Analysis (Volume and Value) 2020 & 2033
- Table 96: Global Cashew in Tanzania Market Volume Kiloton Forecast, by Export Market Analysis (Volume and Value) 2020 & 2033
- Table 97: Global Cashew in Tanzania Market Revenue Million Forecast, by Price Trend Analysis 2020 & 2033
- Table 98: Global Cashew in Tanzania Market Volume Kiloton Forecast, by Price Trend Analysis 2020 & 2033
- Table 99: Global Cashew in Tanzania Market Revenue Million Forecast, by Country 2020 & 2033
- Table 100: Global Cashew in Tanzania Market Volume Kiloton Forecast, by Country 2020 & 2033
- Table 101: United Kingdom Cashew in Tanzania Market Revenue (Million) Forecast, by Application 2020 & 2033
- Table 102: United Kingdom Cashew in Tanzania Market Volume (Kiloton) Forecast, by Application 2020 & 2033
- Table 103: Germany Cashew in Tanzania Market Revenue (Million) Forecast, by Application 2020 & 2033
- Table 104: Germany Cashew in Tanzania Market Volume (Kiloton) Forecast, by Application 2020 & 2033
- Table 105: France Cashew in Tanzania Market Revenue (Million) Forecast, by Application 2020 & 2033
- Table 106: France Cashew in Tanzania Market Volume (Kiloton) Forecast, by Application 2020 & 2033
- Table 107: Italy Cashew in Tanzania Market Revenue (Million) Forecast, by Application 2020 & 2033
- Table 108: Italy Cashew in Tanzania Market Volume (Kiloton) Forecast, by Application 2020 & 2033
- Table 109: Spain Cashew in Tanzania Market Revenue (Million) Forecast, by Application 2020 & 2033
- Table 110: Spain Cashew in Tanzania Market Volume (Kiloton) Forecast, by Application 2020 & 2033
- Table 111: Russia Cashew in Tanzania Market Revenue (Million) Forecast, by Application 2020 & 2033
- Table 112: Russia Cashew in Tanzania Market Volume (Kiloton) Forecast, by Application 2020 & 2033
- Table 113: Benelux Cashew in Tanzania Market Revenue (Million) Forecast, by Application 2020 & 2033
- Table 114: Benelux Cashew in Tanzania Market Volume (Kiloton) Forecast, by Application 2020 & 2033
- Table 115: Nordics Cashew in Tanzania Market Revenue (Million) Forecast, by Application 2020 & 2033
- Table 116: Nordics Cashew in Tanzania Market Volume (Kiloton) Forecast, by Application 2020 & 2033
- Table 117: Rest of Europe Cashew in Tanzania Market Revenue (Million) Forecast, by Application 2020 & 2033
- Table 118: Rest of Europe Cashew in Tanzania Market Volume (Kiloton) Forecast, by Application 2020 & 2033
- Table 119: Global Cashew in Tanzania Market Revenue Million Forecast, by Production Analysis 2020 & 2033
- Table 120: Global Cashew in Tanzania Market Volume Kiloton Forecast, by Production Analysis 2020 & 2033
- Table 121: Global Cashew in Tanzania Market Revenue Million Forecast, by Consumption Analysis (Volume and Value) 2020 & 2033
- Table 122: Global Cashew in Tanzania Market Volume Kiloton Forecast, by Consumption Analysis (Volume and Value) 2020 & 2033
- Table 123: Global Cashew in Tanzania Market Revenue Million Forecast, by Import Market Analysis (Volume and Value) 2020 & 2033
- Table 124: Global Cashew in Tanzania Market Volume Kiloton Forecast, by Import Market Analysis (Volume and Value) 2020 & 2033
- Table 125: Global Cashew in Tanzania Market Revenue Million Forecast, by Export Market Analysis (Volume and Value) 2020 & 2033
- Table 126: Global Cashew in Tanzania Market Volume Kiloton Forecast, by Export Market Analysis (Volume and Value) 2020 & 2033
- Table 127: Global Cashew in Tanzania Market Revenue Million Forecast, by Price Trend Analysis 2020 & 2033
- Table 128: Global Cashew in Tanzania Market Volume Kiloton Forecast, by Price Trend Analysis 2020 & 2033
- Table 129: Global Cashew in Tanzania Market Revenue Million Forecast, by Production Analysis 2020 & 2033
- Table 130: Global Cashew in Tanzania Market Volume Kiloton Forecast, by Production Analysis 2020 & 2033
- Table 131: Global Cashew in Tanzania Market Revenue Million Forecast, by Consumption Analysis (Volume and Value) 2020 & 2033
- Table 132: Global Cashew in Tanzania Market Volume Kiloton Forecast, by Consumption Analysis (Volume and Value) 2020 & 2033
- Table 133: Global Cashew in Tanzania Market Revenue Million Forecast, by Import Market Analysis (Volume and Value) 2020 & 2033
- Table 134: Global Cashew in Tanzania Market Volume Kiloton Forecast, by Import Market Analysis (Volume and Value) 2020 & 2033
- Table 135: Global Cashew in Tanzania Market Revenue Million Forecast, by Export Market Analysis (Volume and Value) 2020 & 2033
- Table 136: Global Cashew in Tanzania Market Volume Kiloton Forecast, by Export Market Analysis (Volume and Value) 2020 & 2033
- Table 137: Global Cashew in Tanzania Market Revenue Million Forecast, by Price Trend Analysis 2020 & 2033
- Table 138: Global Cashew in Tanzania Market Volume Kiloton Forecast, by Price Trend Analysis 2020 & 2033
- Table 139: Global Cashew in Tanzania Market Revenue Million Forecast, by Country 2020 & 2033
- Table 140: Global Cashew in Tanzania Market Volume Kiloton Forecast, by Country 2020 & 2033
- Table 141: Turkey Cashew in Tanzania Market Revenue (Million) Forecast, by Application 2020 & 2033
- Table 142: Turkey Cashew in Tanzania Market Volume (Kiloton) Forecast, by Application 2020 & 2033
- Table 143: Israel Cashew in Tanzania Market Revenue (Million) Forecast, by Application 2020 & 2033
- Table 144: Israel Cashew in Tanzania Market Volume (Kiloton) Forecast, by Application 2020 & 2033
- Table 145: GCC Cashew in Tanzania Market Revenue (Million) Forecast, by Application 2020 & 2033
- Table 146: GCC Cashew in Tanzania Market Volume (Kiloton) Forecast, by Application 2020 & 2033
- Table 147: North Africa Cashew in Tanzania Market Revenue (Million) Forecast, by Application 2020 & 2033
- Table 148: North Africa Cashew in Tanzania Market Volume (Kiloton) Forecast, by Application 2020 & 2033
- Table 149: South Africa Cashew in Tanzania Market Revenue (Million) Forecast, by Application 2020 & 2033
- Table 150: South Africa Cashew in Tanzania Market Volume (Kiloton) Forecast, by Application 2020 & 2033
- Table 151: Rest of Middle East & Africa Cashew in Tanzania Market Revenue (Million) Forecast, by Application 2020 & 2033
- Table 152: Rest of Middle East & Africa Cashew in Tanzania Market Volume (Kiloton) Forecast, by Application 2020 & 2033
- Table 153: Global Cashew in Tanzania Market Revenue Million Forecast, by Production Analysis 2020 & 2033
- Table 154: Global Cashew in Tanzania Market Volume Kiloton Forecast, by Production Analysis 2020 & 2033
- Table 155: Global Cashew in Tanzania Market Revenue Million Forecast, by Consumption Analysis (Volume and Value) 2020 & 2033
- Table 156: Global Cashew in Tanzania Market Volume Kiloton Forecast, by Consumption Analysis (Volume and Value) 2020 & 2033
- Table 157: Global Cashew in Tanzania Market Revenue Million Forecast, by Import Market Analysis (Volume and Value) 2020 & 2033
- Table 158: Global Cashew in Tanzania Market Volume Kiloton Forecast, by Import Market Analysis (Volume and Value) 2020 & 2033
- Table 159: Global Cashew in Tanzania Market Revenue Million Forecast, by Export Market Analysis (Volume and Value) 2020 & 2033
- Table 160: Global Cashew in Tanzania Market Volume Kiloton Forecast, by Export Market Analysis (Volume and Value) 2020 & 2033
- Table 161: Global Cashew in Tanzania Market Revenue Million Forecast, by Price Trend Analysis 2020 & 2033
- Table 162: Global Cashew in Tanzania Market Volume Kiloton Forecast, by Price Trend Analysis 2020 & 2033
- Table 163: Global Cashew in Tanzania Market Revenue Million Forecast, by Production Analysis 2020 & 2033
- Table 164: Global Cashew in Tanzania Market Volume Kiloton Forecast, by Production Analysis 2020 & 2033
- Table 165: Global Cashew in Tanzania Market Revenue Million Forecast, by Consumption Analysis (Volume and Value) 2020 & 2033
- Table 166: Global Cashew in Tanzania Market Volume Kiloton Forecast, by Consumption Analysis (Volume and Value) 2020 & 2033
- Table 167: Global Cashew in Tanzania Market Revenue Million Forecast, by Import Market Analysis (Volume and Value) 2020 & 2033
- Table 168: Global Cashew in Tanzania Market Volume Kiloton Forecast, by Import Market Analysis (Volume and Value) 2020 & 2033
- Table 169: Global Cashew in Tanzania Market Revenue Million Forecast, by Export Market Analysis (Volume and Value) 2020 & 2033
- Table 170: Global Cashew in Tanzania Market Volume Kiloton Forecast, by Export Market Analysis (Volume and Value) 2020 & 2033
- Table 171: Global Cashew in Tanzania Market Revenue Million Forecast, by Price Trend Analysis 2020 & 2033
- Table 172: Global Cashew in Tanzania Market Volume Kiloton Forecast, by Price Trend Analysis 2020 & 2033
- Table 173: Global Cashew in Tanzania Market Revenue Million Forecast, by Country 2020 & 2033
- Table 174: Global Cashew in Tanzania Market Volume Kiloton Forecast, by Country 2020 & 2033
- Table 175: China Cashew in Tanzania Market Revenue (Million) Forecast, by Application 2020 & 2033
- Table 176: China Cashew in Tanzania Market Volume (Kiloton) Forecast, by Application 2020 & 2033
- Table 177: India Cashew in Tanzania Market Revenue (Million) Forecast, by Application 2020 & 2033
- Table 178: India Cashew in Tanzania Market Volume (Kiloton) Forecast, by Application 2020 & 2033
- Table 179: Japan Cashew in Tanzania Market Revenue (Million) Forecast, by Application 2020 & 2033
- Table 180: Japan Cashew in Tanzania Market Volume (Kiloton) Forecast, by Application 2020 & 2033
- Table 181: South Korea Cashew in Tanzania Market Revenue (Million) Forecast, by Application 2020 & 2033
- Table 182: South Korea Cashew in Tanzania Market Volume (Kiloton) Forecast, by Application 2020 & 2033
- Table 183: ASEAN Cashew in Tanzania Market Revenue (Million) Forecast, by Application 2020 & 2033
- Table 184: ASEAN Cashew in Tanzania Market Volume (Kiloton) Forecast, by Application 2020 & 2033
- Table 185: Oceania Cashew in Tanzania Market Revenue (Million) Forecast, by Application 2020 & 2033
- Table 186: Oceania Cashew in Tanzania Market Volume (Kiloton) Forecast, by Application 2020 & 2033
- Table 187: Rest of Asia Pacific Cashew in Tanzania Market Revenue (Million) Forecast, by Application 2020 & 2033
- Table 188: Rest of Asia Pacific Cashew in Tanzania Market Volume (Kiloton) Forecast, by Application 2020 & 2033
Frequently Asked Questions
1. What is the projected Compound Annual Growth Rate (CAGR) of the Cashew in Tanzania Market?
The projected CAGR is approximately 4.48%.
2. Which companies are prominent players in the Cashew in Tanzania Market?
Key companies in the market include Olam International , Cashewnut Company Ltd , Louis Dreyfus Company, Olam International , Mtwara Cashewnut Processors Limited , Bunge Limited , Tanzania Cashewnut Board , ADM (Archer Daniels Midland Company) , Export Trading Group , Cargill .
3. What are the main segments of the Cashew in Tanzania Market?
The market segments include Production Analysis, Consumption Analysis (Volume and Value), Import Market Analysis (Volume and Value), Export Market Analysis (Volume and Value), Price Trend Analysis, Production Analysis, Consumption Analysis (Volume and Value), Import Market Analysis (Volume and Value), Export Market Analysis (Volume and Value), Price Trend Analysis.
4. Can you provide details about the market size?
The market size is estimated to be USD 690.97 Million as of 2022.
5. What are some drivers contributing to market growth?
N/A
6. What are the notable trends driving market growth?
Increasing Government Support and Growing Production Driving the Market.
7. Are there any restraints impacting market growth?
N/A
8. Can you provide examples of recent developments in the market?
July 2022: Tanzania Investment Center (TIC) revealed that the government of Tanzania is planning to construct cashew nut processing factories in Tanzania in collaboration with local investors to supply value-added cashew nuts in the international market to earn high export value and create employment opportunities for the Tanzanian people.
9. What pricing options are available for accessing the report?
Pricing options include single-user, multi-user, and enterprise licenses priced at USD 3800, USD 4500, and USD 5800 respectively.
10. Is the market size provided in terms of value or volume?
The market size is provided in terms of value, measured in Million and volume, measured in Kiloton.
11. Are there any specific market keywords associated with the report?
Yes, the market keyword associated with the report is "Cashew in Tanzania Market," which aids in identifying and referencing the specific market segment covered.
12. How do I determine which pricing option suits my needs best?
The pricing options vary based on user requirements and access needs. Individual users may opt for single-user licenses, while businesses requiring broader access may choose multi-user or enterprise licenses for cost-effective access to the report.
13. Are there any additional resources or data provided in the Cashew in Tanzania Market report?
While the report offers comprehensive insights, it's advisable to review the specific contents or supplementary materials provided to ascertain if additional resources or data are available.
14. How can I stay updated on further developments or reports in the Cashew in Tanzania Market?
To stay informed about further developments, trends, and reports in the Cashew in Tanzania Market, consider subscribing to industry newsletters, following relevant companies and organizations, or regularly checking reputable industry news sources and publications.
Methodology
Step 1 - Identification of Relevant Samples Size from Population Database


Step 2 - Approaches for Defining Global Market Size (Value, Volume* & Price*)

Note*: In applicable scenarios
Step 3 - Data Sources
Primary Research
- Web Analytics
- Survey Reports
- Research Institute
- Latest Research Reports
- Opinion Leaders
Secondary Research
- Annual Reports
- White Paper
- Latest Press Release
- Industry Association
- Paid Database
- Investor Presentations

Step 4 - Data Triangulation
Involves using different sources of information in order to increase the validity of a study
These sources are likely to be stakeholders in a program - participants, other researchers, program staff, other community members, and so on.
Then we put all data in single framework & apply various statistical tools to find out the dynamic on the market.
During the analysis stage, feedback from the stakeholder groups would be compared to determine areas of agreement as well as areas of divergence