

Key Insights
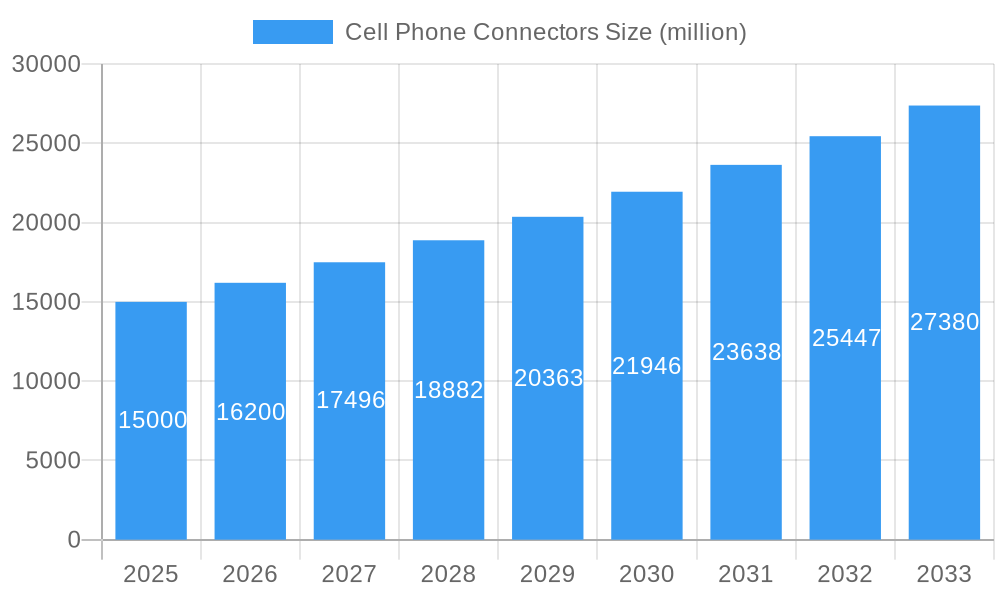
The global cell phone connector market is experiencing robust growth, driven by the increasing demand for smartphones with advanced functionalities and the proliferation of 5G technology. The market, estimated at $15 billion in 2025, is projected to witness a Compound Annual Growth Rate (CAGR) of approximately 8% from 2025 to 2033, reaching an estimated value of $28 billion by 2033. This growth is fueled by several key factors including the miniaturization of electronic components within smartphones, necessitating smaller and more efficient connectors. The rising adoption of high-speed data transfer technologies like USB-C and advancements in wireless charging are further contributing to market expansion. Furthermore, the increasing integration of multiple sensors and cameras in smartphones necessitates a higher number of connectors, thereby boosting market demand. Leading players such as TE Connectivity, Amphenol, and Hirose Electric are driving innovation through the development of advanced connector technologies, focusing on improved durability, reliability, and miniaturization. Competitive pressures and technological advancements will shape the market landscape in the coming years, with a focus on developing environmentally friendly and cost-effective solutions.
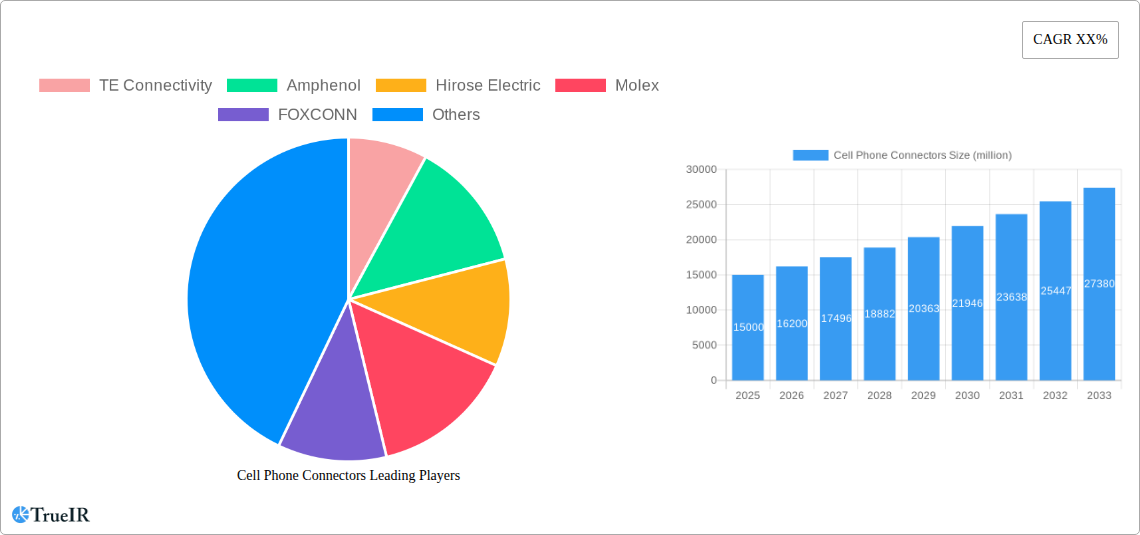
Cell Phone Connectors Market Size (In Billion)
The market segmentation reveals a significant share held by high-performance connectors designed for fast charging and data transmission. Regional analysis indicates strong growth in Asia-Pacific, driven by the high smartphone penetration and manufacturing hubs in the region. However, challenges such as the increasing complexity of connector designs and stringent regulatory requirements related to electronic waste management pose restraints to market growth. The industry is witnessing a clear shift towards sustainable manufacturing practices, with companies increasingly focusing on reducing their carbon footprint and adopting eco-friendly materials. The forecast period will see continued innovation in materials science, leading to lighter, more durable, and environmentally conscious connector solutions. The strategic partnerships and mergers and acquisitions within the industry will also influence market consolidation and future growth trajectory.
Cell Phone Connectors Company Market Share
Cell Phone Connectors Market Report: A Comprehensive Analysis (2019-2033)
This dynamic report provides an in-depth analysis of the global cell phone connectors market, offering invaluable insights for stakeholders across the value chain. Leveraging extensive research and data analysis covering the period 2019-2033 (base year 2025, forecast period 2025-2033), this report illuminates market trends, competitive dynamics, and future growth prospects. With a focus on key players like TE Connectivity, Amphenol, Hirose Electric, and more, this report is an essential resource for strategic decision-making in this rapidly evolving market. The market is projected to reach xx million by 2033.
Cell Phone Connectors Market Structure & Competitive Landscape
The global cell phone connectors market is characterized by a moderately concentrated structure, with a handful of major players commanding significant market share. The Herfindahl-Hirschman Index (HHI) for 2024 is estimated at xx, indicating a moderately consolidated market. Innovation plays a crucial role, driven by the need for smaller, faster, and more power-efficient connectors to support advancements in smartphone technology. Regulatory compliance, particularly concerning environmental standards and data security, also significantly impacts market dynamics. Product substitutes, while limited, include alternative interconnect technologies like wireless charging, which pose a moderate competitive threat.
The market is segmented by connector type (e.g., USB, charging ports, audio jacks), application (e.g., smartphones, tablets, wearables), and region. Mergers and acquisitions (M&A) activity has been significant, with xx million in deal value recorded between 2019 and 2024, primarily focused on expanding product portfolios and geographic reach. Key M&A trends include:
- Strategic acquisitions of smaller, specialized connector manufacturers by larger players.
- Consolidation within regional markets to enhance distribution networks.
- Investments in R&D to maintain competitive advantages in technological innovation.
The competitive landscape is intensely competitive, characterized by ongoing product innovation, strategic partnerships, and price competition.
Cell Phone Connectors Market Trends & Opportunities
The global cell phone connectors market is experiencing robust growth, driven by several key factors. The market size, estimated at xx million in 2025, is projected to reach xx million by 2033, exhibiting a Compound Annual Growth Rate (CAGR) of xx%. This growth is fueled by several factors: the increasing demand for smartphones globally, particularly in developing economies, the proliferation of wearable devices and other smart gadgets, and ongoing advancements in 5G technology which requires more sophisticated connectors capable of handling higher data transfer speeds.
Technological shifts toward miniaturization, increased power efficiency, and faster data transmission speeds are creating significant opportunities for innovation in cell phone connectors. Consumer preference for sleek and durable designs is also influencing product development. The competitive dynamics are characterized by ongoing innovation, strategic alliances, and aggressive pricing strategies, resulting in a highly dynamic market.
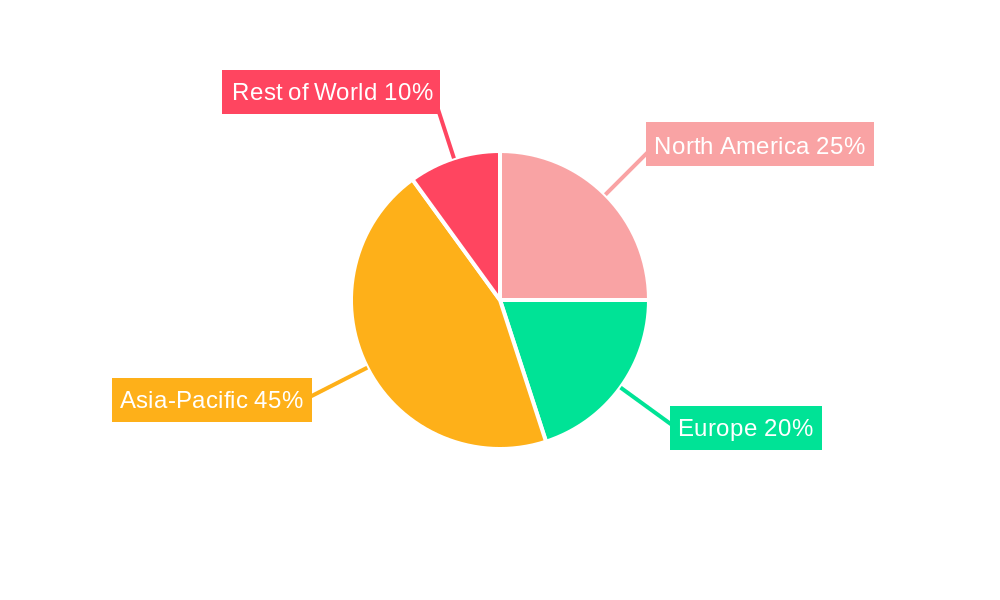
Dominant Markets & Segments in Cell Phone Connectors
The Asia-Pacific region dominates the cell phone connector market, accounting for xx% of the global market share in 2024. China, in particular, is a major growth driver due to its massive smartphone manufacturing base and expanding consumer electronics market.
Key Growth Drivers in Asia-Pacific:
- Massive smartphone manufacturing and assembly base.
- High consumer electronics demand.
- Favorable government policies supporting technological advancements.
- Significant investments in 5G infrastructure.
Other regions, including North America and Europe, also exhibit substantial growth, albeit at a slower pace compared to the Asia-Pacific region. The market segmentation by connector type shows a dominance of USB Type-C connectors, owing to their versatility and superior performance compared to older standards.
Cell Phone Connectors Product Analysis
Recent product innovations in cell phone connectors focus on miniaturization, improved power delivery, and higher data transfer rates. These advancements are crucial in supporting the increasing functionality and power consumption of modern smartphones and other mobile devices. Key competitive advantages stem from superior performance, smaller size, enhanced durability, and cost-effectiveness. The market is witnessing a trend toward multi-functional connectors which integrate charging, data transfer, and audio capabilities into a single unit, maximizing space efficiency within mobile devices.
Key Drivers, Barriers & Challenges in Cell Phone Connectors
Key Drivers:
- Rising demand for smartphones and other smart devices globally.
- Technological advancements in 5G and other wireless technologies.
- Growing adoption of high-speed data transfer technologies like USB4.
- Increasing consumer preference for smaller, more durable, and aesthetically pleasing devices.
Key Challenges and Restraints:
The market faces challenges related to supply chain disruptions and geopolitical instability. Furthermore, stringent environmental regulations concerning hazardous materials in electronic products add to the complexity and costs associated with production. Intense competition also puts pressure on profit margins.
Growth Drivers in the Cell Phone Connectors Market
The growth of the cell phone connectors market is primarily driven by the ever-increasing demand for smartphones and other mobile devices globally. Technological innovations in connector designs, such as USB-C and advancements in wireless charging solutions, continue to fuel market expansion. Favorable government policies promoting digital technology adoption and infrastructure development also stimulate market growth.
Challenges Impacting Cell Phone Connectors Growth
Significant barriers to growth include supply chain disruptions impacting raw material availability and manufacturing capacity. Stringent regulatory frameworks regarding environmental compliance and electronic waste management pose challenges for manufacturers. The highly competitive market landscape also necessitates continuous innovation and cost optimization to maintain profitability.
Key Players Shaping the Cell Phone Connectors Market
- TE Connectivity
- Amphenol
- Hirose Electric
- Molex
- FOXCONN
- LUXSHARE-ICT
- JAE
- LS Mtron
- LINKCONN
- Acon
- UJU
- JST
- Alps Electric
- Shenzhen Everwin Precision
- SMK
- Electric Connector Technology
- KYOCERA
- Shanghai Laimu Electronic
Significant Cell Phone Connectors Industry Milestones
- 2020, Q4: USB4 connector technology officially launched, enabling significantly faster data transfer speeds.
- 2021, Q2: Major connector manufacturers announced investments in new manufacturing facilities to increase production capacity.
- 2022, Q3: Several key players entered into strategic partnerships to develop and deploy next-generation connector technologies for 5G smartphones.
- 2023, Q1: A significant merger between two smaller connector companies expanded the market consolidation trend.
Future Outlook for Cell Phone Connectors Market
The future outlook for the cell phone connectors market remains positive, driven by continuous growth in smartphone adoption and advancements in wireless technologies. Opportunities exist in the development of innovative connectors that support increased functionality, miniaturization, and improved power efficiency. Strategic partnerships, acquisitions, and investments in research and development will be crucial for maintaining competitiveness in this dynamic market. The market is poised for sustained growth, driven by ongoing technological advancements and the increasing demand for high-performance mobile devices.
Cell Phone Connectors Segmentation
-
1. Application
- 1.1. Feature Phone
- 1.2. Smart Phone
-
2. Types
- 2.1. FPC Connector
- 2.2. Board to Board Connector
- 2.3. I/O Connector
- 2.4. Card Connector
- 2.5. Power Connector
- 2.6. RF Connector
Cell Phone Connectors Segmentation By Geography
-
1. North America
- 1.1. United States
- 1.2. Canada
- 1.3. Mexico
-
2. South America
- 2.1. Brazil
- 2.2. Argentina
- 2.3. Rest of South America
-
3. Europe
- 3.1. United Kingdom
- 3.2. Germany
- 3.3. France
- 3.4. Italy
- 3.5. Spain
- 3.6. Russia
- 3.7. Benelux
- 3.8. Nordics
- 3.9. Rest of Europe
-
4. Middle East & Africa
- 4.1. Turkey
- 4.2. Israel
- 4.3. GCC
- 4.4. North Africa
- 4.5. South Africa
- 4.6. Rest of Middle East & Africa
-
5. Asia Pacific
- 5.1. China
- 5.2. India
- 5.3. Japan
- 5.4. South Korea
- 5.5. ASEAN
- 5.6. Oceania
- 5.7. Rest of Asia Pacific
Cell Phone Connectors Regional Market Share
Geographic Coverage of Cell Phone Connectors
Cell Phone Connectors REPORT HIGHLIGHTS
| Aspects | Details |
|---|---|
| Study Period | 2020-2034 |
| Base Year | 2025 |
| Estimated Year | 2026 |
| Forecast Period | 2026-2034 |
| Historical Period | 2020-2025 |
| Growth Rate | CAGR of 6.85% from 2020-2034 |
| Segmentation |
|
Table of Contents
- 1. Introduction
- 1.1. Research Scope
- 1.2. Market Segmentation
- 1.3. Research Objective
- 1.4. Definitions and Assumptions
- 2. Executive Summary
- 2.1. Market Snapshot
- 3. Market Dynamics
- 3.1. Market Drivers
- 3.2. Market Restrains
- 3.3. Market Trends
- 3.4. Market Opportunities
- 4. Market Factor Analysis
- 4.1. Porters Five Forces
- 4.1.1. Bargaining Power of Suppliers
- 4.1.2. Bargaining Power of Buyers
- 4.1.3. Threat of New Entrants
- 4.1.4. Threat of Substitutes
- 4.1.5. Competitive Rivalry
- 4.2. PESTEL analysis
- 4.3. BCG Analysis
- 4.3.1. Stars (High Growth, High Market Share)
- 4.3.2. Cash Cows (Low Growth, High Market Share)
- 4.3.3. Question Mark (High Growth, Low Market Share)
- 4.3.4. Dogs (Low Growth, Low Market Share)
- 4.4. Ansoff Matrix Analysis
- 4.5. Supply Chain Analysis
- 4.6. Regulatory Landscape
- 4.7. Current Market Potential and Opportunity Assessment (TAM–SAM–SOM Framework)
- 4.8. TIR Analyst Note
- 4.1. Porters Five Forces
- 5. Market Analysis, Insights and Forecast 2021-2033
- 5.1. Market Analysis, Insights and Forecast - by Application
- 5.1.1. Feature Phone
- 5.1.2. Smart Phone
- 5.2. Market Analysis, Insights and Forecast - by Types
- 5.2.1. FPC Connector
- 5.2.2. Board to Board Connector
- 5.2.3. I/O Connector
- 5.2.4. Card Connector
- 5.2.5. Power Connector
- 5.2.6. RF Connector
- 5.3. Market Analysis, Insights and Forecast - by Region
- 5.3.1. North America
- 5.3.2. South America
- 5.3.3. Europe
- 5.3.4. Middle East & Africa
- 5.3.5. Asia Pacific
- 5.1. Market Analysis, Insights and Forecast - by Application
- 6. Global Cell Phone Connectors Analysis, Insights and Forecast, 2021-2033
- 6.1. Market Analysis, Insights and Forecast - by Application
- 6.1.1. Feature Phone
- 6.1.2. Smart Phone
- 6.2. Market Analysis, Insights and Forecast - by Types
- 6.2.1. FPC Connector
- 6.2.2. Board to Board Connector
- 6.2.3. I/O Connector
- 6.2.4. Card Connector
- 6.2.5. Power Connector
- 6.2.6. RF Connector
- 6.1. Market Analysis, Insights and Forecast - by Application
- 7. North America Cell Phone Connectors Analysis, Insights and Forecast, 2020-2032
- 7.1. Market Analysis, Insights and Forecast - by Application
- 7.1.1. Feature Phone
- 7.1.2. Smart Phone
- 7.2. Market Analysis, Insights and Forecast - by Types
- 7.2.1. FPC Connector
- 7.2.2. Board to Board Connector
- 7.2.3. I/O Connector
- 7.2.4. Card Connector
- 7.2.5. Power Connector
- 7.2.6. RF Connector
- 7.1. Market Analysis, Insights and Forecast - by Application
- 8. South America Cell Phone Connectors Analysis, Insights and Forecast, 2020-2032
- 8.1. Market Analysis, Insights and Forecast - by Application
- 8.1.1. Feature Phone
- 8.1.2. Smart Phone
- 8.2. Market Analysis, Insights and Forecast - by Types
- 8.2.1. FPC Connector
- 8.2.2. Board to Board Connector
- 8.2.3. I/O Connector
- 8.2.4. Card Connector
- 8.2.5. Power Connector
- 8.2.6. RF Connector
- 8.1. Market Analysis, Insights and Forecast - by Application
- 9. Europe Cell Phone Connectors Analysis, Insights and Forecast, 2020-2032
- 9.1. Market Analysis, Insights and Forecast - by Application
- 9.1.1. Feature Phone
- 9.1.2. Smart Phone
- 9.2. Market Analysis, Insights and Forecast - by Types
- 9.2.1. FPC Connector
- 9.2.2. Board to Board Connector
- 9.2.3. I/O Connector
- 9.2.4. Card Connector
- 9.2.5. Power Connector
- 9.2.6. RF Connector
- 9.1. Market Analysis, Insights and Forecast - by Application
- 10. Middle East & Africa Cell Phone Connectors Analysis, Insights and Forecast, 2020-2032
- 10.1. Market Analysis, Insights and Forecast - by Application
- 10.1.1. Feature Phone
- 10.1.2. Smart Phone
- 10.2. Market Analysis, Insights and Forecast - by Types
- 10.2.1. FPC Connector
- 10.2.2. Board to Board Connector
- 10.2.3. I/O Connector
- 10.2.4. Card Connector
- 10.2.5. Power Connector
- 10.2.6. RF Connector
- 10.1. Market Analysis, Insights and Forecast - by Application
- 11. Asia Pacific Cell Phone Connectors Analysis, Insights and Forecast, 2020-2032
- 11.1. Market Analysis, Insights and Forecast - by Application
- 11.1.1. Feature Phone
- 11.1.2. Smart Phone
- 11.2. Market Analysis, Insights and Forecast - by Types
- 11.2.1. FPC Connector
- 11.2.2. Board to Board Connector
- 11.2.3. I/O Connector
- 11.2.4. Card Connector
- 11.2.5. Power Connector
- 11.2.6. RF Connector
- 11.1. Market Analysis, Insights and Forecast - by Application
- 12. Competitive Analysis
- 12.1. Company Profiles
- 12.1.1 TE Connectivity
- 12.1.1.1. Company Overview
- 12.1.1.2. Products
- 12.1.1.3. Company Financials
- 12.1.1.4. SWOT Analysis
- 12.1.2 Amphenol
- 12.1.2.1. Company Overview
- 12.1.2.2. Products
- 12.1.2.3. Company Financials
- 12.1.2.4. SWOT Analysis
- 12.1.3 Hirose Electric
- 12.1.3.1. Company Overview
- 12.1.3.2. Products
- 12.1.3.3. Company Financials
- 12.1.3.4. SWOT Analysis
- 12.1.4 Molex
- 12.1.4.1. Company Overview
- 12.1.4.2. Products
- 12.1.4.3. Company Financials
- 12.1.4.4. SWOT Analysis
- 12.1.5 FOXCONN
- 12.1.5.1. Company Overview
- 12.1.5.2. Products
- 12.1.5.3. Company Financials
- 12.1.5.4. SWOT Analysis
- 12.1.6 LUXSHARE-ICT
- 12.1.6.1. Company Overview
- 12.1.6.2. Products
- 12.1.6.3. Company Financials
- 12.1.6.4. SWOT Analysis
- 12.1.7 JAE
- 12.1.7.1. Company Overview
- 12.1.7.2. Products
- 12.1.7.3. Company Financials
- 12.1.7.4. SWOT Analysis
- 12.1.8 LS Mtron
- 12.1.8.1. Company Overview
- 12.1.8.2. Products
- 12.1.8.3. Company Financials
- 12.1.8.4. SWOT Analysis
- 12.1.9 LINKCONN
- 12.1.9.1. Company Overview
- 12.1.9.2. Products
- 12.1.9.3. Company Financials
- 12.1.9.4. SWOT Analysis
- 12.1.10 Acon
- 12.1.10.1. Company Overview
- 12.1.10.2. Products
- 12.1.10.3. Company Financials
- 12.1.10.4. SWOT Analysis
- 12.1.11 UJU
- 12.1.11.1. Company Overview
- 12.1.11.2. Products
- 12.1.11.3. Company Financials
- 12.1.11.4. SWOT Analysis
- 12.1.12 JST
- 12.1.12.1. Company Overview
- 12.1.12.2. Products
- 12.1.12.3. Company Financials
- 12.1.12.4. SWOT Analysis
- 12.1.13 Alps Electric
- 12.1.13.1. Company Overview
- 12.1.13.2. Products
- 12.1.13.3. Company Financials
- 12.1.13.4. SWOT Analysis
- 12.1.14 Shenzhen Everwin Precision
- 12.1.14.1. Company Overview
- 12.1.14.2. Products
- 12.1.14.3. Company Financials
- 12.1.14.4. SWOT Analysis
- 12.1.15 SMK
- 12.1.15.1. Company Overview
- 12.1.15.2. Products
- 12.1.15.3. Company Financials
- 12.1.15.4. SWOT Analysis
- 12.1.16 Electric Connector Technology
- 12.1.16.1. Company Overview
- 12.1.16.2. Products
- 12.1.16.3. Company Financials
- 12.1.16.4. SWOT Analysis
- 12.1.17 KYOCERA
- 12.1.17.1. Company Overview
- 12.1.17.2. Products
- 12.1.17.3. Company Financials
- 12.1.17.4. SWOT Analysis
- 12.1.18 Shanghai Laimu Electronic
- 12.1.18.1. Company Overview
- 12.1.18.2. Products
- 12.1.18.3. Company Financials
- 12.1.18.4. SWOT Analysis
- 12.1.1 TE Connectivity
- 12.2. Market Entropy
- 12.2.1 Company's Key Areas Served
- 12.2.2 Recent Developments
- 12.3. Company Market Share Analysis 2025
- 12.3.1 Top 5 Companies Market Share Analysis
- 12.3.2 Top 3 Companies Market Share Analysis
- 12.4. List of Potential Customers
- 13. Research Methodology
List of Figures
- Figure 1: Global Cell Phone Connectors Revenue Breakdown (undefined, %) by Region 2025 & 2033
- Figure 2: North America Cell Phone Connectors Revenue (undefined), by Application 2025 & 2033
- Figure 3: North America Cell Phone Connectors Revenue Share (%), by Application 2025 & 2033
- Figure 4: North America Cell Phone Connectors Revenue (undefined), by Types 2025 & 2033
- Figure 5: North America Cell Phone Connectors Revenue Share (%), by Types 2025 & 2033
- Figure 6: North America Cell Phone Connectors Revenue (undefined), by Country 2025 & 2033
- Figure 7: North America Cell Phone Connectors Revenue Share (%), by Country 2025 & 2033
- Figure 8: South America Cell Phone Connectors Revenue (undefined), by Application 2025 & 2033
- Figure 9: South America Cell Phone Connectors Revenue Share (%), by Application 2025 & 2033
- Figure 10: South America Cell Phone Connectors Revenue (undefined), by Types 2025 & 2033
- Figure 11: South America Cell Phone Connectors Revenue Share (%), by Types 2025 & 2033
- Figure 12: South America Cell Phone Connectors Revenue (undefined), by Country 2025 & 2033
- Figure 13: South America Cell Phone Connectors Revenue Share (%), by Country 2025 & 2033
- Figure 14: Europe Cell Phone Connectors Revenue (undefined), by Application 2025 & 2033
- Figure 15: Europe Cell Phone Connectors Revenue Share (%), by Application 2025 & 2033
- Figure 16: Europe Cell Phone Connectors Revenue (undefined), by Types 2025 & 2033
- Figure 17: Europe Cell Phone Connectors Revenue Share (%), by Types 2025 & 2033
- Figure 18: Europe Cell Phone Connectors Revenue (undefined), by Country 2025 & 2033
- Figure 19: Europe Cell Phone Connectors Revenue Share (%), by Country 2025 & 2033
- Figure 20: Middle East & Africa Cell Phone Connectors Revenue (undefined), by Application 2025 & 2033
- Figure 21: Middle East & Africa Cell Phone Connectors Revenue Share (%), by Application 2025 & 2033
- Figure 22: Middle East & Africa Cell Phone Connectors Revenue (undefined), by Types 2025 & 2033
- Figure 23: Middle East & Africa Cell Phone Connectors Revenue Share (%), by Types 2025 & 2033
- Figure 24: Middle East & Africa Cell Phone Connectors Revenue (undefined), by Country 2025 & 2033
- Figure 25: Middle East & Africa Cell Phone Connectors Revenue Share (%), by Country 2025 & 2033
- Figure 26: Asia Pacific Cell Phone Connectors Revenue (undefined), by Application 2025 & 2033
- Figure 27: Asia Pacific Cell Phone Connectors Revenue Share (%), by Application 2025 & 2033
- Figure 28: Asia Pacific Cell Phone Connectors Revenue (undefined), by Types 2025 & 2033
- Figure 29: Asia Pacific Cell Phone Connectors Revenue Share (%), by Types 2025 & 2033
- Figure 30: Asia Pacific Cell Phone Connectors Revenue (undefined), by Country 2025 & 2033
- Figure 31: Asia Pacific Cell Phone Connectors Revenue Share (%), by Country 2025 & 2033
List of Tables
- Table 1: Global Cell Phone Connectors Revenue undefined Forecast, by Application 2020 & 2033
- Table 2: Global Cell Phone Connectors Revenue undefined Forecast, by Types 2020 & 2033
- Table 3: Global Cell Phone Connectors Revenue undefined Forecast, by Region 2020 & 2033
- Table 4: Global Cell Phone Connectors Revenue undefined Forecast, by Application 2020 & 2033
- Table 5: Global Cell Phone Connectors Revenue undefined Forecast, by Types 2020 & 2033
- Table 6: Global Cell Phone Connectors Revenue undefined Forecast, by Country 2020 & 2033
- Table 7: United States Cell Phone Connectors Revenue (undefined) Forecast, by Application 2020 & 2033
- Table 8: Canada Cell Phone Connectors Revenue (undefined) Forecast, by Application 2020 & 2033
- Table 9: Mexico Cell Phone Connectors Revenue (undefined) Forecast, by Application 2020 & 2033
- Table 10: Global Cell Phone Connectors Revenue undefined Forecast, by Application 2020 & 2033
- Table 11: Global Cell Phone Connectors Revenue undefined Forecast, by Types 2020 & 2033
- Table 12: Global Cell Phone Connectors Revenue undefined Forecast, by Country 2020 & 2033
- Table 13: Brazil Cell Phone Connectors Revenue (undefined) Forecast, by Application 2020 & 2033
- Table 14: Argentina Cell Phone Connectors Revenue (undefined) Forecast, by Application 2020 & 2033
- Table 15: Rest of South America Cell Phone Connectors Revenue (undefined) Forecast, by Application 2020 & 2033
- Table 16: Global Cell Phone Connectors Revenue undefined Forecast, by Application 2020 & 2033
- Table 17: Global Cell Phone Connectors Revenue undefined Forecast, by Types 2020 & 2033
- Table 18: Global Cell Phone Connectors Revenue undefined Forecast, by Country 2020 & 2033
- Table 19: United Kingdom Cell Phone Connectors Revenue (undefined) Forecast, by Application 2020 & 2033
- Table 20: Germany Cell Phone Connectors Revenue (undefined) Forecast, by Application 2020 & 2033
- Table 21: France Cell Phone Connectors Revenue (undefined) Forecast, by Application 2020 & 2033
- Table 22: Italy Cell Phone Connectors Revenue (undefined) Forecast, by Application 2020 & 2033
- Table 23: Spain Cell Phone Connectors Revenue (undefined) Forecast, by Application 2020 & 2033
- Table 24: Russia Cell Phone Connectors Revenue (undefined) Forecast, by Application 2020 & 2033
- Table 25: Benelux Cell Phone Connectors Revenue (undefined) Forecast, by Application 2020 & 2033
- Table 26: Nordics Cell Phone Connectors Revenue (undefined) Forecast, by Application 2020 & 2033
- Table 27: Rest of Europe Cell Phone Connectors Revenue (undefined) Forecast, by Application 2020 & 2033
- Table 28: Global Cell Phone Connectors Revenue undefined Forecast, by Application 2020 & 2033
- Table 29: Global Cell Phone Connectors Revenue undefined Forecast, by Types 2020 & 2033
- Table 30: Global Cell Phone Connectors Revenue undefined Forecast, by Country 2020 & 2033
- Table 31: Turkey Cell Phone Connectors Revenue (undefined) Forecast, by Application 2020 & 2033
- Table 32: Israel Cell Phone Connectors Revenue (undefined) Forecast, by Application 2020 & 2033
- Table 33: GCC Cell Phone Connectors Revenue (undefined) Forecast, by Application 2020 & 2033
- Table 34: North Africa Cell Phone Connectors Revenue (undefined) Forecast, by Application 2020 & 2033
- Table 35: South Africa Cell Phone Connectors Revenue (undefined) Forecast, by Application 2020 & 2033
- Table 36: Rest of Middle East & Africa Cell Phone Connectors Revenue (undefined) Forecast, by Application 2020 & 2033
- Table 37: Global Cell Phone Connectors Revenue undefined Forecast, by Application 2020 & 2033
- Table 38: Global Cell Phone Connectors Revenue undefined Forecast, by Types 2020 & 2033
- Table 39: Global Cell Phone Connectors Revenue undefined Forecast, by Country 2020 & 2033
- Table 40: China Cell Phone Connectors Revenue (undefined) Forecast, by Application 2020 & 2033
- Table 41: India Cell Phone Connectors Revenue (undefined) Forecast, by Application 2020 & 2033
- Table 42: Japan Cell Phone Connectors Revenue (undefined) Forecast, by Application 2020 & 2033
- Table 43: South Korea Cell Phone Connectors Revenue (undefined) Forecast, by Application 2020 & 2033
- Table 44: ASEAN Cell Phone Connectors Revenue (undefined) Forecast, by Application 2020 & 2033
- Table 45: Oceania Cell Phone Connectors Revenue (undefined) Forecast, by Application 2020 & 2033
- Table 46: Rest of Asia Pacific Cell Phone Connectors Revenue (undefined) Forecast, by Application 2020 & 2033
Frequently Asked Questions
1. What is the projected Compound Annual Growth Rate (CAGR) of the Cell Phone Connectors?
The projected CAGR is approximately 6.85%.
2. Which companies are prominent players in the Cell Phone Connectors?
Key companies in the market include TE Connectivity, Amphenol, Hirose Electric, Molex, FOXCONN, LUXSHARE-ICT, JAE, LS Mtron, LINKCONN, Acon, UJU, JST, Alps Electric, Shenzhen Everwin Precision, SMK, Electric Connector Technology, KYOCERA, Shanghai Laimu Electronic.
3. What are the main segments of the Cell Phone Connectors?
The market segments include Application, Types.
4. Can you provide details about the market size?
The market size is estimated to be USD XXX N/A as of 2022.
5. What are some drivers contributing to market growth?
N/A
6. What are the notable trends driving market growth?
N/A
7. Are there any restraints impacting market growth?
N/A
8. Can you provide examples of recent developments in the market?
N/A
9. What pricing options are available for accessing the report?
Pricing options include single-user, multi-user, and enterprise licenses priced at USD 4900.00, USD 7350.00, and USD 9800.00 respectively.
10. Is the market size provided in terms of value or volume?
The market size is provided in terms of value, measured in N/A.
11. Are there any specific market keywords associated with the report?
Yes, the market keyword associated with the report is "Cell Phone Connectors," which aids in identifying and referencing the specific market segment covered.
12. How do I determine which pricing option suits my needs best?
The pricing options vary based on user requirements and access needs. Individual users may opt for single-user licenses, while businesses requiring broader access may choose multi-user or enterprise licenses for cost-effective access to the report.
13. Are there any additional resources or data provided in the Cell Phone Connectors report?
While the report offers comprehensive insights, it's advisable to review the specific contents or supplementary materials provided to ascertain if additional resources or data are available.
14. How can I stay updated on further developments or reports in the Cell Phone Connectors?
To stay informed about further developments, trends, and reports in the Cell Phone Connectors, consider subscribing to industry newsletters, following relevant companies and organizations, or regularly checking reputable industry news sources and publications.
Methodology
Step 1 - Identification of Relevant Samples Size from Population Database


Step 2 - Approaches for Defining Global Market Size (Value, Volume* & Price*)

Note*: In applicable scenarios
Step 3 - Data Sources
Primary Research
- Web Analytics
- Survey Reports
- Research Institute
- Latest Research Reports
- Opinion Leaders
Secondary Research
- Annual Reports
- White Paper
- Latest Press Release
- Industry Association
- Paid Database
- Investor Presentations

Step 4 - Data Triangulation
Involves using different sources of information in order to increase the validity of a study
These sources are likely to be stakeholders in a program - participants, other researchers, program staff, other community members, and so on.
Then we put all data in single framework & apply various statistical tools to find out the dynamic on the market.
During the analysis stage, feedback from the stakeholder groups would be compared to determine areas of agreement as well as areas of divergence