

Key Insights
The Chip on Board (COB) LED market demonstrates significant expansion, driven by the escalating demand for energy-efficient illumination across diverse industries. Key growth drivers include widespread adoption in general lighting (residential, commercial, industrial), a preference for high-lumen output fixtures, and the increasing popularity of smart lighting systems. Technological innovations delivering enhanced efficacy, superior color rendering, and compact designs further accelerate market growth. Additionally, stringent government regulations promoting energy conservation and sustainable practices are a major catalyst for COB LED adoption, particularly in developed economies. The automotive lighting sector represents a substantial growth avenue, with COB LEDs favored for their exceptional brightness and design flexibility. Challenges include higher initial costs compared to alternative LED technologies and potential heat dissipation issues in high-power applications. Despite these hurdles, the long-term cost savings and performance advantages of COB LEDs are anticipated to foster continued market growth.
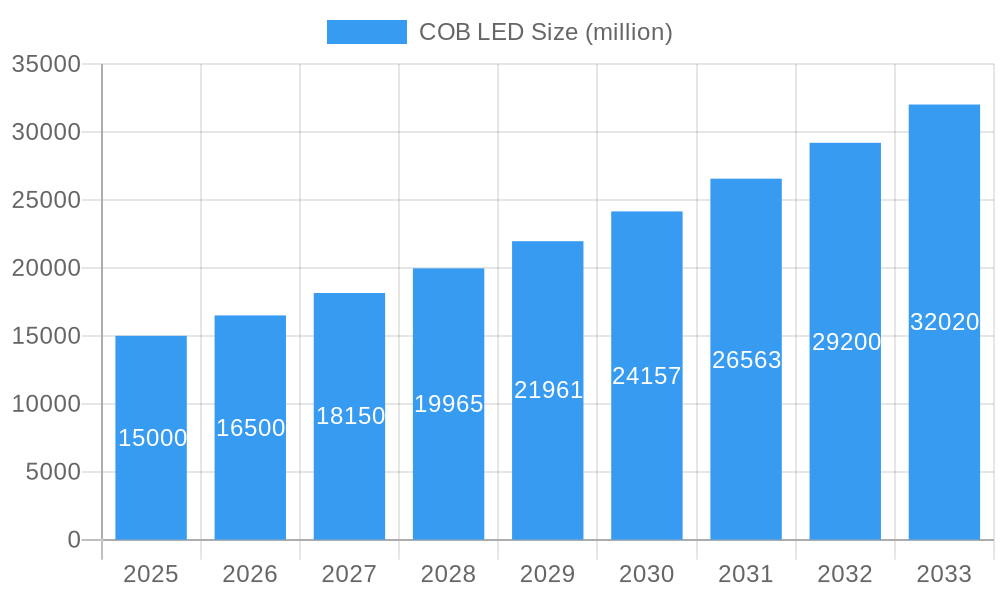
COB LED Market Size (In Billion)
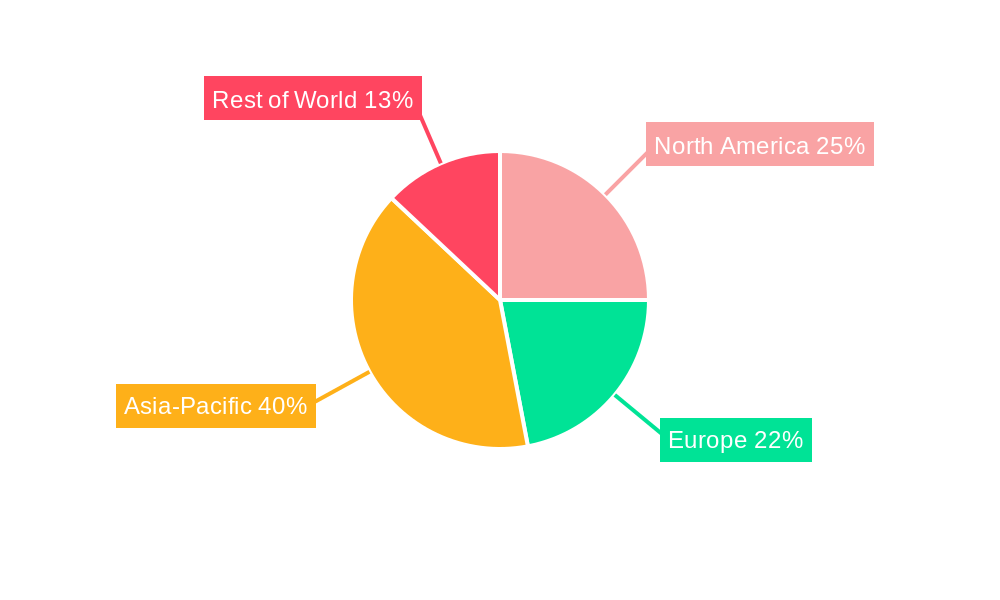
The COB LED market's competitive environment features both established leaders and emerging innovators. Leading manufacturers are committed to continuous technological advancement, focusing on product performance enhancement and cost-effective solutions. Strategic alliances, mergers, and acquisitions are prevalent strategies for market share expansion and portfolio diversification. Regional market growth is primarily shaped by economic development, energy policies, and infrastructure investments. The Asia-Pacific region is projected to lead market growth, propelled by rapid urbanization, robust economic expansion, and substantial infrastructure investment. North America and Europe are also expected to witness considerable growth, supported by sustainable lighting initiatives and rising consumer awareness of energy efficiency.
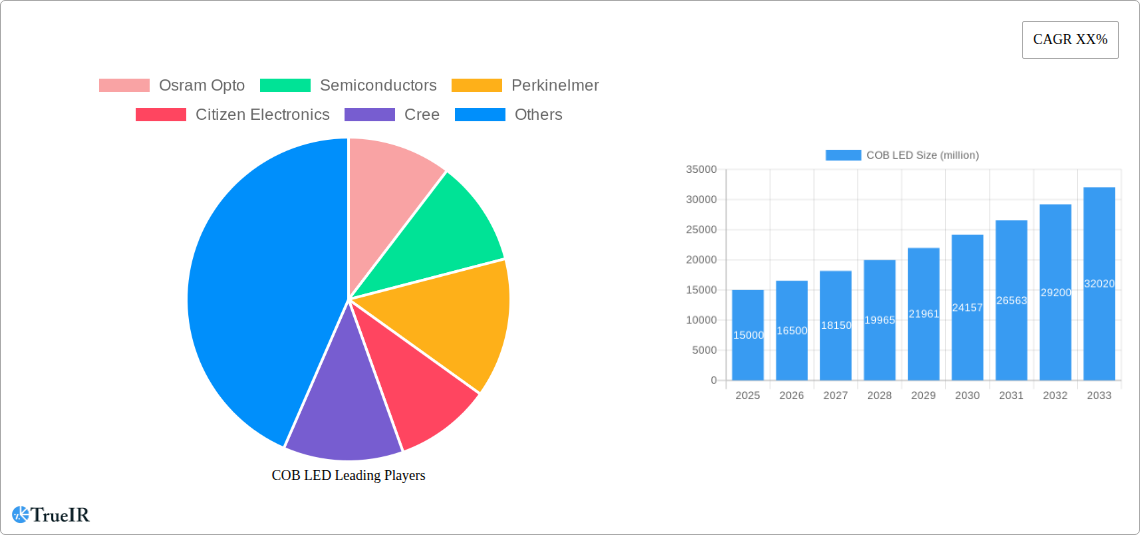
COB LED Company Market Share
This comprehensive report offers an in-depth analysis of the global COB LED market, covering its structure, competitive landscape, emerging trends, opportunities, and future projections. Through extensive research and data analysis, this report provides critical insights for industry professionals, investors, and strategic decision-makers. The analysis spans 2019-2033, with 2025 designated as the base and estimated year. The market size is projected to reach 3812.3 million by 2033, exhibiting a Compound Annual Growth Rate (CAGR) of 17.8% during the forecast period (2025-2033). The historical period analyzed is 2019-2024.
COB LED Market Structure & Competitive Landscape
The global COB LED market is characterized by a moderately concentrated structure, with several key players holding significant market share. The Herfindahl-Hirschman Index (HHI) is estimated at xx in 2025, indicating a moderately consolidated market. Innovation is a crucial driver, with companies continuously striving to improve efficiency, lifespan, and color rendering index (CRI) of COB LEDs. Stringent regulatory frameworks concerning energy efficiency and environmental impact also influence market dynamics. The market witnesses continuous M&A activity, as larger players seek to expand their product portfolios and market reach. For example, the acquisition of xx company by xx company in 2024 significantly impacted market concentration. The total value of M&A activities in the COB LED sector from 2019 to 2024 reached approximately xx million. End-user segmentation includes lighting manufacturers, automotive industry, general lighting applications, and architectural lighting. The high demand for energy-efficient lighting solutions from commercial and residential sectors fuels market growth.
- Market Concentration: HHI of xx in 2025
- Key Innovation Drivers: Improved efficiency, longer lifespan, higher CRI
- Regulatory Impacts: Stringent energy efficiency and environmental standards
- Product Substitutes: Other LED technologies, traditional lighting sources
- End-User Segmentation: Lighting manufacturers, automotive, commercial & residential
- M&A Trends: Significant M&A activity, totaling approximately xx million from 2019-2024
COB LED Market Trends & Opportunities
The COB LED market is experiencing robust growth, driven by increasing adoption in various applications. Technological advancements like miniaturization, improved thermal management, and advancements in color mixing techniques are fueling market expansion. Consumer preference shifts toward energy-efficient and aesthetically pleasing lighting solutions further stimulate demand. The market exhibits a strong preference for high-lumen output and high CRI COB LEDs. Competitive dynamics are shaped by price competition, product differentiation, and technological innovation. Market penetration rates are steadily increasing, with a projected xx% penetration in the general lighting segment by 2033.
The market size is expected to reach xx million by 2033, demonstrating significant growth compared to the xx million recorded in 2024. This signifies a considerable market opportunity for manufacturers and investors.
Dominant Markets & Segments in COB LED
The Asia-Pacific region dominates the global COB LED market, driven by rapid economic growth, robust infrastructure development, and government support for energy-efficient technologies. China, in particular, emerges as a leading market, with a projected market value of xx million by 2033.
Key Growth Drivers in Asia-Pacific:
- Rapid economic growth and urbanization
- Extensive infrastructure development projects
- Government initiatives promoting energy efficiency
- Increasing adoption of LED lighting in commercial and residential sectors
Detailed Analysis of Market Dominance: The region's large population base, rising disposable incomes, and increasing awareness regarding energy efficiency contribute to the high demand for COB LEDs. Supportive government policies and investment in infrastructure projects further accelerate market growth. The dominance of the Asia-Pacific region is expected to continue throughout the forecast period.
COB LED Product Analysis
COB LED technology offers several advantages over traditional LED packages, including improved light extraction efficiency, enhanced thermal management, and simplified assembly. Recent innovations focus on increasing luminous efficacy, reducing manufacturing costs, and integrating advanced functionalities like tunable white and smart lighting capabilities. COB LEDs find widespread applications in general lighting, automotive lighting, and architectural lighting, demonstrating excellent market fit due to their high performance and cost-effectiveness.
Key Drivers, Barriers & Challenges in COB LED
Key Drivers: The market is propelled by stringent energy efficiency regulations, increasing demand for high-quality lighting solutions, and technological advancements leading to improved product performance and lower costs. The growing adoption of smart lighting systems and the automotive industry's shift towards energy-efficient lighting solutions further drives growth.
Challenges: Supply chain disruptions, intense competition, and rising raw material prices pose significant challenges. Stringent regulatory compliance and potential trade barriers also constrain market growth. The xx% increase in raw material costs in 2024 impacted the market significantly.
Growth Drivers in the COB LED Market
Technological advancements, increasing energy efficiency standards, and rising demand for high-quality lighting solutions across various sectors are key growth drivers. Government incentives for energy-efficient lighting and the expanding adoption of smart lighting systems further fuel market expansion.
Challenges Impacting COB LED Growth
Supply chain disruptions, price fluctuations in raw materials, and intense competition among manufacturers create challenges. Stringent regulatory compliance and the potential for trade wars can also impede market growth.
Key Players Shaping the COB LED Market
- Osram Opto Semiconductors
- PerkinElmer
- Citizen Electronics
- Cree
- Seoul Semiconductor
- GE Lighting
- Enlux Lighting
- EMTEQ
- Prophotonix
- Cooper Lighting
- LumiShore Ltd
- Philips Lumileds Lighting
- Samsung Electronics
- Leiso Lighting
- Luminage
Significant COB LED Industry Milestones
- 2020: Seoul Semiconductor launches a new generation of high-efficiency COB LEDs.
- 2021: Cree introduces COB LEDs with enhanced thermal management capabilities.
- 2022: Osram Opto Semiconductors partners with a leading automotive manufacturer for COB LED integration in vehicle lighting systems.
- 2023: Significant investments in COB LED manufacturing capacity by several key players.
- 2024: Merger between two significant players leading to consolidation in the market.
Future Outlook for COB LED Market
The COB LED market is poised for continued growth, driven by ongoing technological innovation, expanding applications, and increasing demand for energy-efficient lighting. Strategic partnerships, investments in R&D, and expansion into new markets will be crucial for success. The market's potential is significant, offering promising opportunities for manufacturers and investors alike.
COB LED Segmentation
-
1. Application
- 1.1. LED Display
- 1.2. Traffic Light
- 1.3. Car Lights
- 1.4. Others
-
2. Types
- 2.1. Organic Light Emitting Diode
- 2.2. Inorganic Light Emitting Diode
COB LED Segmentation By Geography
-
1. North America
- 1.1. United States
- 1.2. Canada
- 1.3. Mexico
-
2. South America
- 2.1. Brazil
- 2.2. Argentina
- 2.3. Rest of South America
-
3. Europe
- 3.1. United Kingdom
- 3.2. Germany
- 3.3. France
- 3.4. Italy
- 3.5. Spain
- 3.6. Russia
- 3.7. Benelux
- 3.8. Nordics
- 3.9. Rest of Europe
-
4. Middle East & Africa
- 4.1. Turkey
- 4.2. Israel
- 4.3. GCC
- 4.4. North Africa
- 4.5. South Africa
- 4.6. Rest of Middle East & Africa
-
5. Asia Pacific
- 5.1. China
- 5.2. India
- 5.3. Japan
- 5.4. South Korea
- 5.5. ASEAN
- 5.6. Oceania
- 5.7. Rest of Asia Pacific
COB LED Regional Market Share
Geographic Coverage of COB LED
COB LED REPORT HIGHLIGHTS
| Aspects | Details |
|---|---|
| Study Period | 2020-2034 |
| Base Year | 2025 |
| Estimated Year | 2026 |
| Forecast Period | 2026-2034 |
| Historical Period | 2020-2025 |
| Growth Rate | CAGR of 17.8% from 2020-2034 |
| Segmentation |
|
Table of Contents
- 1. Introduction
- 1.1. Research Scope
- 1.2. Market Segmentation
- 1.3. Research Objective
- 1.4. Definitions and Assumptions
- 2. Executive Summary
- 2.1. Market Snapshot
- 3. Market Dynamics
- 3.1. Market Drivers
- 3.2. Market Restrains
- 3.3. Market Trends
- 3.4. Market Opportunities
- 4. Market Factor Analysis
- 4.1. Porters Five Forces
- 4.1.1. Bargaining Power of Suppliers
- 4.1.2. Bargaining Power of Buyers
- 4.1.3. Threat of New Entrants
- 4.1.4. Threat of Substitutes
- 4.1.5. Competitive Rivalry
- 4.2. PESTEL analysis
- 4.3. BCG Analysis
- 4.3.1. Stars (High Growth, High Market Share)
- 4.3.2. Cash Cows (Low Growth, High Market Share)
- 4.3.3. Question Mark (High Growth, Low Market Share)
- 4.3.4. Dogs (Low Growth, Low Market Share)
- 4.4. Ansoff Matrix Analysis
- 4.5. Supply Chain Analysis
- 4.6. Regulatory Landscape
- 4.7. Current Market Potential and Opportunity Assessment (TAM–SAM–SOM Framework)
- 4.8. TIR Analyst Note
- 4.1. Porters Five Forces
- 5. Market Analysis, Insights and Forecast 2021-2033
- 5.1. Market Analysis, Insights and Forecast - by Application
- 5.1.1. LED Display
- 5.1.2. Traffic Light
- 5.1.3. Car Lights
- 5.1.4. Others
- 5.2. Market Analysis, Insights and Forecast - by Types
- 5.2.1. Organic Light Emitting Diode
- 5.2.2. Inorganic Light Emitting Diode
- 5.3. Market Analysis, Insights and Forecast - by Region
- 5.3.1. North America
- 5.3.2. South America
- 5.3.3. Europe
- 5.3.4. Middle East & Africa
- 5.3.5. Asia Pacific
- 5.1. Market Analysis, Insights and Forecast - by Application
- 6. Global COB LED Analysis, Insights and Forecast, 2021-2033
- 6.1. Market Analysis, Insights and Forecast - by Application
- 6.1.1. LED Display
- 6.1.2. Traffic Light
- 6.1.3. Car Lights
- 6.1.4. Others
- 6.2. Market Analysis, Insights and Forecast - by Types
- 6.2.1. Organic Light Emitting Diode
- 6.2.2. Inorganic Light Emitting Diode
- 6.1. Market Analysis, Insights and Forecast - by Application
- 7. North America COB LED Analysis, Insights and Forecast, 2020-2032
- 7.1. Market Analysis, Insights and Forecast - by Application
- 7.1.1. LED Display
- 7.1.2. Traffic Light
- 7.1.3. Car Lights
- 7.1.4. Others
- 7.2. Market Analysis, Insights and Forecast - by Types
- 7.2.1. Organic Light Emitting Diode
- 7.2.2. Inorganic Light Emitting Diode
- 7.1. Market Analysis, Insights and Forecast - by Application
- 8. South America COB LED Analysis, Insights and Forecast, 2020-2032
- 8.1. Market Analysis, Insights and Forecast - by Application
- 8.1.1. LED Display
- 8.1.2. Traffic Light
- 8.1.3. Car Lights
- 8.1.4. Others
- 8.2. Market Analysis, Insights and Forecast - by Types
- 8.2.1. Organic Light Emitting Diode
- 8.2.2. Inorganic Light Emitting Diode
- 8.1. Market Analysis, Insights and Forecast - by Application
- 9. Europe COB LED Analysis, Insights and Forecast, 2020-2032
- 9.1. Market Analysis, Insights and Forecast - by Application
- 9.1.1. LED Display
- 9.1.2. Traffic Light
- 9.1.3. Car Lights
- 9.1.4. Others
- 9.2. Market Analysis, Insights and Forecast - by Types
- 9.2.1. Organic Light Emitting Diode
- 9.2.2. Inorganic Light Emitting Diode
- 9.1. Market Analysis, Insights and Forecast - by Application
- 10. Middle East & Africa COB LED Analysis, Insights and Forecast, 2020-2032
- 10.1. Market Analysis, Insights and Forecast - by Application
- 10.1.1. LED Display
- 10.1.2. Traffic Light
- 10.1.3. Car Lights
- 10.1.4. Others
- 10.2. Market Analysis, Insights and Forecast - by Types
- 10.2.1. Organic Light Emitting Diode
- 10.2.2. Inorganic Light Emitting Diode
- 10.1. Market Analysis, Insights and Forecast - by Application
- 11. Asia Pacific COB LED Analysis, Insights and Forecast, 2020-2032
- 11.1. Market Analysis, Insights and Forecast - by Application
- 11.1.1. LED Display
- 11.1.2. Traffic Light
- 11.1.3. Car Lights
- 11.1.4. Others
- 11.2. Market Analysis, Insights and Forecast - by Types
- 11.2.1. Organic Light Emitting Diode
- 11.2.2. Inorganic Light Emitting Diode
- 11.1. Market Analysis, Insights and Forecast - by Application
- 12. Competitive Analysis
- 12.1. Company Profiles
- 12.1.1 Osram Opto
- 12.1.1.1. Company Overview
- 12.1.1.2. Products
- 12.1.1.3. Company Financials
- 12.1.1.4. SWOT Analysis
- 12.1.2 Semiconductors
- 12.1.2.1. Company Overview
- 12.1.2.2. Products
- 12.1.2.3. Company Financials
- 12.1.2.4. SWOT Analysis
- 12.1.3 Perkinelmer
- 12.1.3.1. Company Overview
- 12.1.3.2. Products
- 12.1.3.3. Company Financials
- 12.1.3.4. SWOT Analysis
- 12.1.4 Citizen Electronics
- 12.1.4.1. Company Overview
- 12.1.4.2. Products
- 12.1.4.3. Company Financials
- 12.1.4.4. SWOT Analysis
- 12.1.5 Cree
- 12.1.5.1. Company Overview
- 12.1.5.2. Products
- 12.1.5.3. Company Financials
- 12.1.5.4. SWOT Analysis
- 12.1.6 Seoul Semiconductor
- 12.1.6.1. Company Overview
- 12.1.6.2. Products
- 12.1.6.3. Company Financials
- 12.1.6.4. SWOT Analysis
- 12.1.7 GE Lighting
- 12.1.7.1. Company Overview
- 12.1.7.2. Products
- 12.1.7.3. Company Financials
- 12.1.7.4. SWOT Analysis
- 12.1.8 Enlux Lighitng
- 12.1.8.1. Company Overview
- 12.1.8.2. Products
- 12.1.8.3. Company Financials
- 12.1.8.4. SWOT Analysis
- 12.1.9 EMTEQ
- 12.1.9.1. Company Overview
- 12.1.9.2. Products
- 12.1.9.3. Company Financials
- 12.1.9.4. SWOT Analysis
- 12.1.10 Prophotonix
- 12.1.10.1. Company Overview
- 12.1.10.2. Products
- 12.1.10.3. Company Financials
- 12.1.10.4. SWOT Analysis
- 12.1.11 Cooper Lighting
- 12.1.11.1. Company Overview
- 12.1.11.2. Products
- 12.1.11.3. Company Financials
- 12.1.11.4. SWOT Analysis
- 12.1.12 LumiShoreLtd
- 12.1.12.1. Company Overview
- 12.1.12.2. Products
- 12.1.12.3. Company Financials
- 12.1.12.4. SWOT Analysis
- 12.1.13 Philips Lumileds Lighting
- 12.1.13.1. Company Overview
- 12.1.13.2. Products
- 12.1.13.3. Company Financials
- 12.1.13.4. SWOT Analysis
- 12.1.14 Samsung Electronics
- 12.1.14.1. Company Overview
- 12.1.14.2. Products
- 12.1.14.3. Company Financials
- 12.1.14.4. SWOT Analysis
- 12.1.15 Leiso Lighting
- 12.1.15.1. Company Overview
- 12.1.15.2. Products
- 12.1.15.3. Company Financials
- 12.1.15.4. SWOT Analysis
- 12.1.16 Luminage
- 12.1.16.1. Company Overview
- 12.1.16.2. Products
- 12.1.16.3. Company Financials
- 12.1.16.4. SWOT Analysis
- 12.1.1 Osram Opto
- 12.2. Market Entropy
- 12.2.1 Company's Key Areas Served
- 12.2.2 Recent Developments
- 12.3. Company Market Share Analysis 2025
- 12.3.1 Top 5 Companies Market Share Analysis
- 12.3.2 Top 3 Companies Market Share Analysis
- 12.4. List of Potential Customers
- 13. Research Methodology
List of Figures
- Figure 1: Global COB LED Revenue Breakdown (million, %) by Region 2025 & 2033
- Figure 2: North America COB LED Revenue (million), by Application 2025 & 2033
- Figure 3: North America COB LED Revenue Share (%), by Application 2025 & 2033
- Figure 4: North America COB LED Revenue (million), by Types 2025 & 2033
- Figure 5: North America COB LED Revenue Share (%), by Types 2025 & 2033
- Figure 6: North America COB LED Revenue (million), by Country 2025 & 2033
- Figure 7: North America COB LED Revenue Share (%), by Country 2025 & 2033
- Figure 8: South America COB LED Revenue (million), by Application 2025 & 2033
- Figure 9: South America COB LED Revenue Share (%), by Application 2025 & 2033
- Figure 10: South America COB LED Revenue (million), by Types 2025 & 2033
- Figure 11: South America COB LED Revenue Share (%), by Types 2025 & 2033
- Figure 12: South America COB LED Revenue (million), by Country 2025 & 2033
- Figure 13: South America COB LED Revenue Share (%), by Country 2025 & 2033
- Figure 14: Europe COB LED Revenue (million), by Application 2025 & 2033
- Figure 15: Europe COB LED Revenue Share (%), by Application 2025 & 2033
- Figure 16: Europe COB LED Revenue (million), by Types 2025 & 2033
- Figure 17: Europe COB LED Revenue Share (%), by Types 2025 & 2033
- Figure 18: Europe COB LED Revenue (million), by Country 2025 & 2033
- Figure 19: Europe COB LED Revenue Share (%), by Country 2025 & 2033
- Figure 20: Middle East & Africa COB LED Revenue (million), by Application 2025 & 2033
- Figure 21: Middle East & Africa COB LED Revenue Share (%), by Application 2025 & 2033
- Figure 22: Middle East & Africa COB LED Revenue (million), by Types 2025 & 2033
- Figure 23: Middle East & Africa COB LED Revenue Share (%), by Types 2025 & 2033
- Figure 24: Middle East & Africa COB LED Revenue (million), by Country 2025 & 2033
- Figure 25: Middle East & Africa COB LED Revenue Share (%), by Country 2025 & 2033
- Figure 26: Asia Pacific COB LED Revenue (million), by Application 2025 & 2033
- Figure 27: Asia Pacific COB LED Revenue Share (%), by Application 2025 & 2033
- Figure 28: Asia Pacific COB LED Revenue (million), by Types 2025 & 2033
- Figure 29: Asia Pacific COB LED Revenue Share (%), by Types 2025 & 2033
- Figure 30: Asia Pacific COB LED Revenue (million), by Country 2025 & 2033
- Figure 31: Asia Pacific COB LED Revenue Share (%), by Country 2025 & 2033
List of Tables
- Table 1: Global COB LED Revenue million Forecast, by Application 2020 & 2033
- Table 2: Global COB LED Revenue million Forecast, by Types 2020 & 2033
- Table 3: Global COB LED Revenue million Forecast, by Region 2020 & 2033
- Table 4: Global COB LED Revenue million Forecast, by Application 2020 & 2033
- Table 5: Global COB LED Revenue million Forecast, by Types 2020 & 2033
- Table 6: Global COB LED Revenue million Forecast, by Country 2020 & 2033
- Table 7: United States COB LED Revenue (million) Forecast, by Application 2020 & 2033
- Table 8: Canada COB LED Revenue (million) Forecast, by Application 2020 & 2033
- Table 9: Mexico COB LED Revenue (million) Forecast, by Application 2020 & 2033
- Table 10: Global COB LED Revenue million Forecast, by Application 2020 & 2033
- Table 11: Global COB LED Revenue million Forecast, by Types 2020 & 2033
- Table 12: Global COB LED Revenue million Forecast, by Country 2020 & 2033
- Table 13: Brazil COB LED Revenue (million) Forecast, by Application 2020 & 2033
- Table 14: Argentina COB LED Revenue (million) Forecast, by Application 2020 & 2033
- Table 15: Rest of South America COB LED Revenue (million) Forecast, by Application 2020 & 2033
- Table 16: Global COB LED Revenue million Forecast, by Application 2020 & 2033
- Table 17: Global COB LED Revenue million Forecast, by Types 2020 & 2033
- Table 18: Global COB LED Revenue million Forecast, by Country 2020 & 2033
- Table 19: United Kingdom COB LED Revenue (million) Forecast, by Application 2020 & 2033
- Table 20: Germany COB LED Revenue (million) Forecast, by Application 2020 & 2033
- Table 21: France COB LED Revenue (million) Forecast, by Application 2020 & 2033
- Table 22: Italy COB LED Revenue (million) Forecast, by Application 2020 & 2033
- Table 23: Spain COB LED Revenue (million) Forecast, by Application 2020 & 2033
- Table 24: Russia COB LED Revenue (million) Forecast, by Application 2020 & 2033
- Table 25: Benelux COB LED Revenue (million) Forecast, by Application 2020 & 2033
- Table 26: Nordics COB LED Revenue (million) Forecast, by Application 2020 & 2033
- Table 27: Rest of Europe COB LED Revenue (million) Forecast, by Application 2020 & 2033
- Table 28: Global COB LED Revenue million Forecast, by Application 2020 & 2033
- Table 29: Global COB LED Revenue million Forecast, by Types 2020 & 2033
- Table 30: Global COB LED Revenue million Forecast, by Country 2020 & 2033
- Table 31: Turkey COB LED Revenue (million) Forecast, by Application 2020 & 2033
- Table 32: Israel COB LED Revenue (million) Forecast, by Application 2020 & 2033
- Table 33: GCC COB LED Revenue (million) Forecast, by Application 2020 & 2033
- Table 34: North Africa COB LED Revenue (million) Forecast, by Application 2020 & 2033
- Table 35: South Africa COB LED Revenue (million) Forecast, by Application 2020 & 2033
- Table 36: Rest of Middle East & Africa COB LED Revenue (million) Forecast, by Application 2020 & 2033
- Table 37: Global COB LED Revenue million Forecast, by Application 2020 & 2033
- Table 38: Global COB LED Revenue million Forecast, by Types 2020 & 2033
- Table 39: Global COB LED Revenue million Forecast, by Country 2020 & 2033
- Table 40: China COB LED Revenue (million) Forecast, by Application 2020 & 2033
- Table 41: India COB LED Revenue (million) Forecast, by Application 2020 & 2033
- Table 42: Japan COB LED Revenue (million) Forecast, by Application 2020 & 2033
- Table 43: South Korea COB LED Revenue (million) Forecast, by Application 2020 & 2033
- Table 44: ASEAN COB LED Revenue (million) Forecast, by Application 2020 & 2033
- Table 45: Oceania COB LED Revenue (million) Forecast, by Application 2020 & 2033
- Table 46: Rest of Asia Pacific COB LED Revenue (million) Forecast, by Application 2020 & 2033
Frequently Asked Questions
1. What is the projected Compound Annual Growth Rate (CAGR) of the COB LED?
The projected CAGR is approximately 17.8%.
2. Which companies are prominent players in the COB LED?
Key companies in the market include Osram Opto, Semiconductors, Perkinelmer, Citizen Electronics, Cree, Seoul Semiconductor, GE Lighting, Enlux Lighitng, EMTEQ, Prophotonix, Cooper Lighting, LumiShoreLtd, Philips Lumileds Lighting, Samsung Electronics, Leiso Lighting, Luminage.
3. What are the main segments of the COB LED?
The market segments include Application, Types.
4. Can you provide details about the market size?
The market size is estimated to be USD 3812.3 million as of 2022.
5. What are some drivers contributing to market growth?
N/A
6. What are the notable trends driving market growth?
N/A
7. Are there any restraints impacting market growth?
N/A
8. Can you provide examples of recent developments in the market?
N/A
9. What pricing options are available for accessing the report?
Pricing options include single-user, multi-user, and enterprise licenses priced at USD 4900.00, USD 7350.00, and USD 9800.00 respectively.
10. Is the market size provided in terms of value or volume?
The market size is provided in terms of value, measured in million.
11. Are there any specific market keywords associated with the report?
Yes, the market keyword associated with the report is "COB LED," which aids in identifying and referencing the specific market segment covered.
12. How do I determine which pricing option suits my needs best?
The pricing options vary based on user requirements and access needs. Individual users may opt for single-user licenses, while businesses requiring broader access may choose multi-user or enterprise licenses for cost-effective access to the report.
13. Are there any additional resources or data provided in the COB LED report?
While the report offers comprehensive insights, it's advisable to review the specific contents or supplementary materials provided to ascertain if additional resources or data are available.
14. How can I stay updated on further developments or reports in the COB LED?
To stay informed about further developments, trends, and reports in the COB LED, consider subscribing to industry newsletters, following relevant companies and organizations, or regularly checking reputable industry news sources and publications.
Methodology
Step 1 - Identification of Relevant Samples Size from Population Database


Step 2 - Approaches for Defining Global Market Size (Value, Volume* & Price*)

Note*: In applicable scenarios
Step 3 - Data Sources
Primary Research
- Web Analytics
- Survey Reports
- Research Institute
- Latest Research Reports
- Opinion Leaders
Secondary Research
- Annual Reports
- White Paper
- Latest Press Release
- Industry Association
- Paid Database
- Investor Presentations

Step 4 - Data Triangulation
Involves using different sources of information in order to increase the validity of a study
These sources are likely to be stakeholders in a program - participants, other researchers, program staff, other community members, and so on.
Then we put all data in single framework & apply various statistical tools to find out the dynamic on the market.
During the analysis stage, feedback from the stakeholder groups would be compared to determine areas of agreement as well as areas of divergence