

Key Insights
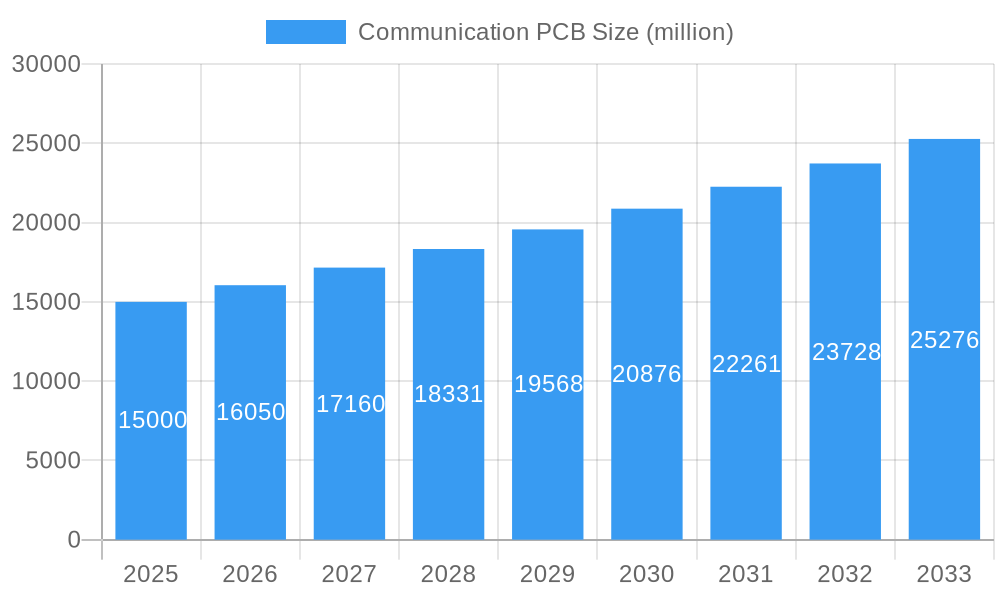
The communication Printed Circuit Board (PCB) market is experiencing robust growth, driven by the escalating demand for high-speed data transmission and advanced communication technologies. The proliferation of 5G networks, the Internet of Things (IoT), and the increasing adoption of cloud computing are key factors fueling this expansion. The market's value, estimated at $15 billion in 2025, is projected to experience a Compound Annual Growth Rate (CAGR) of 7% from 2025 to 2033, reaching an estimated $25 billion by 2033. This growth is further fueled by miniaturization trends in electronic devices, requiring more complex and sophisticated PCBs to accommodate increasing functionalities within smaller form factors. Key players are investing heavily in research and development to enhance PCB performance, focusing on higher density interconnects, improved signal integrity, and advanced materials to meet the demands of next-generation communication systems.
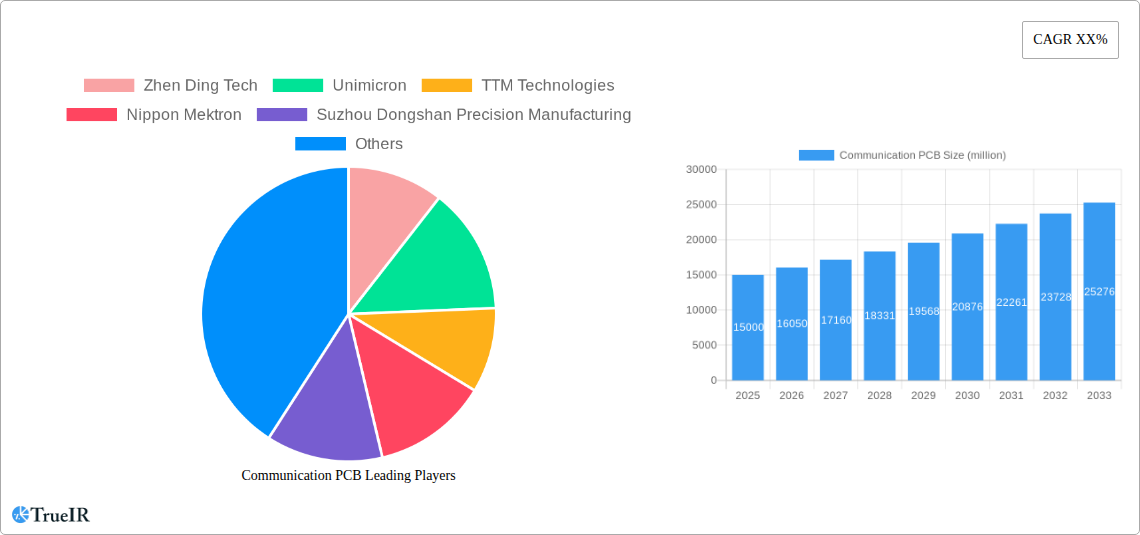
Communication PCB Market Size (In Billion)
Despite the positive outlook, challenges remain. Fluctuations in raw material prices, particularly for precious metals used in high-frequency PCBs, can impact profitability. Furthermore, intense competition among numerous established players and emerging manufacturers necessitates continuous innovation and cost optimization to maintain market share. The increasing complexity of PCB design and manufacturing also presents challenges, requiring specialized expertise and advanced equipment. Segment-wise, high-speed communication PCBs are expected to witness the fastest growth, fueled by the expansion of 5G and data center infrastructure. Geographic regions like North America and Asia are anticipated to dominate market share, reflecting the concentration of major technology hubs and manufacturing capabilities. The market's future trajectory will largely be determined by the pace of technological advancements in communication technologies, coupled with the strategic decisions made by major market players.
Communication PCB Company Market Share
Communication PCB Market Report: 2019-2033
This comprehensive report provides a detailed analysis of the global Communication PCB market, offering invaluable insights for stakeholders across the value chain. With a study period spanning 2019-2033, a base year of 2025, and an estimated and forecast period of 2025-2033, this report leverages extensive data analysis and expert insights to illuminate current market dynamics and future growth trajectories. The report covers a market valued at millions of dollars and impacting millions of consumers globally.
Communication PCB Market Structure & Competitive Landscape
The Communication PCB market exhibits a moderately concentrated structure, with a few major players commanding significant market share. In 2025, the top 5 players held approximately xx% of the global market, indicating considerable consolidation. Key drivers of innovation include advancements in high-speed data transmission technologies and miniaturization demands from the communication industry. Regulatory impacts, such as RoHS compliance and REACH regulations, significantly influence material selection and manufacturing processes. The primary product substitutes are alternative interconnect technologies, including flexible circuits and advanced packaging solutions, although their market penetration remains relatively low, at approximately xx% in 2025.
End-user segmentation is largely driven by the communication equipment industry, with significant contributions from smartphones, base stations, and data centers. The market witnesses moderate M&A activity, with approximately xx deals annually, driven by companies aiming to expand their product portfolio and geographical reach. However, significant barriers to entry, including high capital investments and technological expertise, limit new entrants. Further analysis reveals that larger companies, such as Zhen Ding Tech and Unimicron, have shown a propensity for strategic acquisitions in recent years.
Communication PCB Market Trends & Opportunities
The Communication PCB market is experiencing robust growth, with a projected CAGR of xx% during the forecast period (2025-2033). This expansion is fueled by several factors: the ever-increasing demand for high-speed data transmission, the proliferation of 5G and other wireless technologies, and the growth of the Internet of Things (IoT). Technological advancements, such as the incorporation of embedded components and advanced materials, continue to drive innovation. Consumer preferences increasingly favor smaller, lighter, and more energy-efficient devices, necessitating innovative PCB designs.
Competitive dynamics are characterized by intense rivalry among established players and emerging market entrants. Major players are actively investing in R&D to improve product performance and reduce manufacturing costs. The market penetration of advanced Communication PCBs is increasing steadily, with xx% of new communication devices incorporating these advanced technologies in 2025. This growth is expected to be further accelerated by innovations in substrate materials and manufacturing processes.
Dominant Markets & Segments in Communication PCB
The Asia-Pacific region dominates the Communication PCB market, accounting for approximately xx% of global revenue in 2025. China, in particular, is a key growth driver, fueled by robust domestic demand and a thriving electronics manufacturing industry.
- Key Growth Drivers in Asia-Pacific:
- Rapid expansion of 5G infrastructure.
- Government support for technological innovation.
- Large consumer base with increasing purchasing power.
- Presence of a robust electronics manufacturing ecosystem.
The high-speed Communication PCB segment is anticipated to witness the fastest growth, owing to the escalating demand for high-bandwidth applications. The market dominance of Asia-Pacific can be attributed to a confluence of factors, including lower manufacturing costs, abundant skilled labor, and supportive government policies promoting technological advancements within the electronics sector.
Communication PCB Product Analysis
Communication PCBs are evolving rapidly, incorporating increasingly complex functionalities and miniaturized designs. Advancements in materials science, such as the use of high-frequency materials like Rogers and Taconic, improve signal integrity and reduce signal loss. New applications, driven by the growth of 5G and IoT, demand improved thermal management, leading to innovative design approaches and heat-dissipating materials. This focus on improved performance and compact design is essential in meeting the demands of the modern communication landscape.
Key Drivers, Barriers & Challenges in Communication PCB
Key Drivers: The primary drivers for Communication PCB market growth are the relentless demand for higher data transmission speeds (driven by 5G and IoT), miniaturization of electronic devices, and advancements in high-frequency materials that improve signal integrity.
Challenges: Significant challenges include the escalating costs of raw materials and the complexity of manufacturing processes, leading to increased production costs. Furthermore, stringent environmental regulations, such as RoHS and REACH, necessitate the use of environmentally friendly materials which can add to the overall cost. Intense competition among established players and the emergence of new technologies add further pressure to margins.
Growth Drivers in the Communication PCB Market
The relentless demand for high-speed data transmission, spurred by 5G rollout and the expansion of the IoT, forms a primary growth driver. Technological advancements such as the adoption of advanced substrate materials and improved manufacturing techniques (e.g., HDI and AI-powered quality control) are also instrumental in this growth. Government policies promoting technological innovation and investment in infrastructure contribute significantly.
Challenges Impacting Communication PCB Growth
Supply chain disruptions, fluctuating raw material prices, and the increasing complexity of manufacturing pose significant challenges. Stringent environmental regulations add to production costs, while intense competition forces companies to constantly innovate to maintain market share. Geopolitical uncertainties also contribute to market instability, impacting the forecast.
Key Players Shaping the Communication PCB Market
- Zhen Ding Tech
- Unimicron
- TTM Technologies
- Nippon Mektron
- Suzhou Dongshan Precision Manufacturing
- Compeq Manufacturing
- Tripod
- Shennan Circuits
- AT&S
- Shengyi Technology
- Nan Ya PCB Corporation
- Founder Technology
- Zhejiang Wazam New Materials
- Shenzhen Kinwong Electronic
- Guangdong Ellington Electronics Technology
- Guangdong Champion Asia Electronics
- Olympic Circuit Technology
- Bomin Electronics
- Guangdong Goworld
- Tianjin Printronics Circuit
- Guangdong Chaohua Technology
- Shenzhen Fastprint Circuit Tech
- WUS Printed Circuit
- Huizhou China Eagle Electronic Technology
- Goldenmax International Technology
- Suntak Technology
- Aoshikang Technology
- Avary Holding
- Guangdong Kingshine Electronic Technology
Significant Communication PCB Industry Milestones
- 2020: Introduction of new high-frequency materials by Rogers Corporation significantly improved signal integrity in 5G communication PCBs.
- 2021: Several major mergers and acquisitions reshaped the competitive landscape. (Specific details on M&A would go here)
- 2022: Significant investments were made in AI-powered automation for PCB manufacturing, improving efficiency and reducing production times.
- 2023: The launch of several new embedded component solutions resulted in significant miniaturization of Communication PCBs.
- 2024: A significant increase in the adoption of flexible PCB technologies is observed. (Further details on specific milestones would be included here.)
Future Outlook for Communication PCB Market
The Communication PCB market is poised for sustained growth, driven by the continued expansion of 5G and the proliferation of IoT devices. Technological innovation, particularly in high-speed materials and embedded component solutions, will continue to shape the market. Strategic partnerships and acquisitions among major players are likely to further consolidate the market. The market's growth will also be influenced by emerging applications, such as autonomous vehicles and advanced robotics. The projected growth trajectory is expected to be highly positive, fueled by both technological advancements and burgeoning market demands.
Communication PCB Segmentation
- 1. Application
- 2. Types
Communication PCB Segmentation By Geography
-
1. North America
- 1.1. United States
- 1.2. Canada
- 1.3. Mexico
-
2. South America
- 2.1. Brazil
- 2.2. Argentina
- 2.3. Rest of South America
-
3. Europe
- 3.1. United Kingdom
- 3.2. Germany
- 3.3. France
- 3.4. Italy
- 3.5. Spain
- 3.6. Russia
- 3.7. Benelux
- 3.8. Nordics
- 3.9. Rest of Europe
-
4. Middle East & Africa
- 4.1. Turkey
- 4.2. Israel
- 4.3. GCC
- 4.4. North Africa
- 4.5. South Africa
- 4.6. Rest of Middle East & Africa
-
5. Asia Pacific
- 5.1. China
- 5.2. India
- 5.3. Japan
- 5.4. South Korea
- 5.5. ASEAN
- 5.6. Oceania
- 5.7. Rest of Asia Pacific
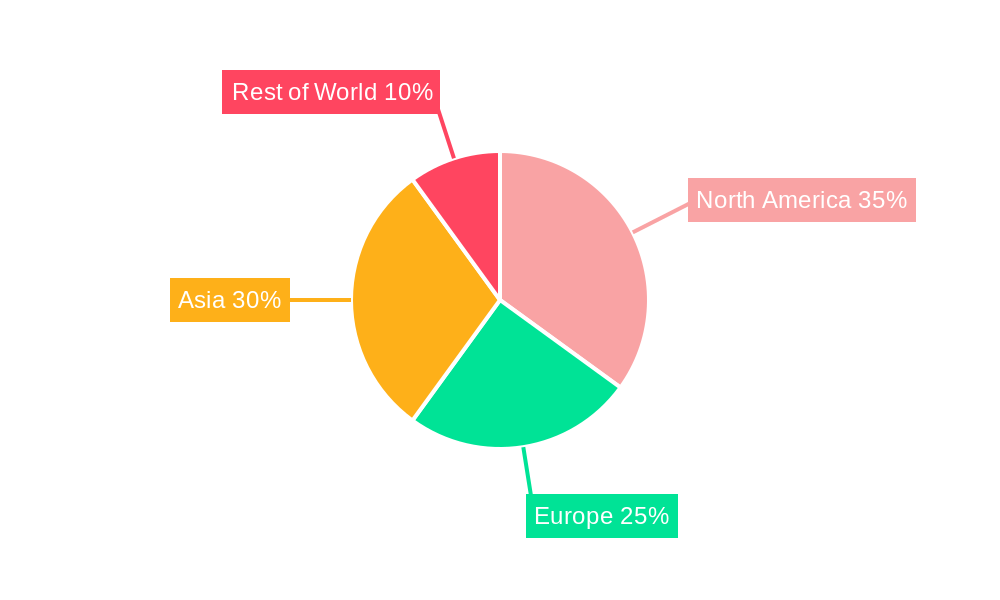
Communication PCB Regional Market Share
Geographic Coverage of Communication PCB
Communication PCB REPORT HIGHLIGHTS
| Aspects | Details |
|---|---|
| Study Period | 2020-2034 |
| Base Year | 2025 |
| Estimated Year | 2026 |
| Forecast Period | 2026-2034 |
| Historical Period | 2020-2025 |
| Growth Rate | CAGR of 7.5% from 2020-2034 |
| Segmentation |
|
Table of Contents
- 1. Introduction
- 1.1. Research Scope
- 1.2. Market Segmentation
- 1.3. Research Objective
- 1.4. Definitions and Assumptions
- 2. Executive Summary
- 2.1. Market Snapshot
- 3. Market Dynamics
- 3.1. Market Drivers
- 3.2. Market Restrains
- 3.3. Market Trends
- 3.4. Market Opportunities
- 4. Market Factor Analysis
- 4.1. Porters Five Forces
- 4.1.1. Bargaining Power of Suppliers
- 4.1.2. Bargaining Power of Buyers
- 4.1.3. Threat of New Entrants
- 4.1.4. Threat of Substitutes
- 4.1.5. Competitive Rivalry
- 4.2. PESTEL analysis
- 4.3. BCG Analysis
- 4.3.1. Stars (High Growth, High Market Share)
- 4.3.2. Cash Cows (Low Growth, High Market Share)
- 4.3.3. Question Mark (High Growth, Low Market Share)
- 4.3.4. Dogs (Low Growth, Low Market Share)
- 4.4. Ansoff Matrix Analysis
- 4.5. Supply Chain Analysis
- 4.6. Regulatory Landscape
- 4.7. Current Market Potential and Opportunity Assessment (TAM–SAM–SOM Framework)
- 4.8. TIR Analyst Note
- 4.1. Porters Five Forces
- 5. Market Analysis, Insights and Forecast 2021-2033
- 5.1. Market Analysis, Insights and Forecast - by Application
- 5.2. Market Analysis, Insights and Forecast - by Types
- 5.3. Market Analysis, Insights and Forecast - by Region
- 5.3.1. North America
- 5.3.2. South America
- 5.3.3. Europe
- 5.3.4. Middle East & Africa
- 5.3.5. Asia Pacific
- 6. Global Communication PCB Analysis, Insights and Forecast, 2021-2033
- 6.1. Market Analysis, Insights and Forecast - by Application
- 6.2. Market Analysis, Insights and Forecast - by Types
- 7. North America Communication PCB Analysis, Insights and Forecast, 2020-2032
- 7.1. Market Analysis, Insights and Forecast - by Application
- 7.2. Market Analysis, Insights and Forecast - by Types
- 8. South America Communication PCB Analysis, Insights and Forecast, 2020-2032
- 8.1. Market Analysis, Insights and Forecast - by Application
- 8.2. Market Analysis, Insights and Forecast - by Types
- 9. Europe Communication PCB Analysis, Insights and Forecast, 2020-2032
- 9.1. Market Analysis, Insights and Forecast - by Application
- 9.2. Market Analysis, Insights and Forecast - by Types
- 10. Middle East & Africa Communication PCB Analysis, Insights and Forecast, 2020-2032
- 10.1. Market Analysis, Insights and Forecast - by Application
- 10.2. Market Analysis, Insights and Forecast - by Types
- 11. Asia Pacific Communication PCB Analysis, Insights and Forecast, 2020-2032
- 11.1. Market Analysis, Insights and Forecast - by Application
- 11.2. Market Analysis, Insights and Forecast - by Types
- 12. Competitive Analysis
- 12.1. Company Profiles
- 12.1.1 Zhen Ding Tech
- 12.1.1.1. Company Overview
- 12.1.1.2. Products
- 12.1.1.3. Company Financials
- 12.1.1.4. SWOT Analysis
- 12.1.2 Unimicron
- 12.1.2.1. Company Overview
- 12.1.2.2. Products
- 12.1.2.3. Company Financials
- 12.1.2.4. SWOT Analysis
- 12.1.3 TTM Technologies
- 12.1.3.1. Company Overview
- 12.1.3.2. Products
- 12.1.3.3. Company Financials
- 12.1.3.4. SWOT Analysis
- 12.1.4 Nippon Mektron
- 12.1.4.1. Company Overview
- 12.1.4.2. Products
- 12.1.4.3. Company Financials
- 12.1.4.4. SWOT Analysis
- 12.1.5 Suzhou Dongshan Precision Manufacturing
- 12.1.5.1. Company Overview
- 12.1.5.2. Products
- 12.1.5.3. Company Financials
- 12.1.5.4. SWOT Analysis
- 12.1.6 Compeq Manufacturing
- 12.1.6.1. Company Overview
- 12.1.6.2. Products
- 12.1.6.3. Company Financials
- 12.1.6.4. SWOT Analysis
- 12.1.7 Tripod
- 12.1.7.1. Company Overview
- 12.1.7.2. Products
- 12.1.7.3. Company Financials
- 12.1.7.4. SWOT Analysis
- 12.1.8 Shennan Circuits
- 12.1.8.1. Company Overview
- 12.1.8.2. Products
- 12.1.8.3. Company Financials
- 12.1.8.4. SWOT Analysis
- 12.1.9 AT&S
- 12.1.9.1. Company Overview
- 12.1.9.2. Products
- 12.1.9.3. Company Financials
- 12.1.9.4. SWOT Analysis
- 12.1.10 Shengyi Technology
- 12.1.10.1. Company Overview
- 12.1.10.2. Products
- 12.1.10.3. Company Financials
- 12.1.10.4. SWOT Analysis
- 12.1.11 Nan Ya PCB Corporation
- 12.1.11.1. Company Overview
- 12.1.11.2. Products
- 12.1.11.3. Company Financials
- 12.1.11.4. SWOT Analysis
- 12.1.12 Founder Technology
- 12.1.12.1. Company Overview
- 12.1.12.2. Products
- 12.1.12.3. Company Financials
- 12.1.12.4. SWOT Analysis
- 12.1.13 Zhejiang Wazam New Materials
- 12.1.13.1. Company Overview
- 12.1.13.2. Products
- 12.1.13.3. Company Financials
- 12.1.13.4. SWOT Analysis
- 12.1.14 Shenzhen Kinwong Electronic
- 12.1.14.1. Company Overview
- 12.1.14.2. Products
- 12.1.14.3. Company Financials
- 12.1.14.4. SWOT Analysis
- 12.1.15 Guangdong Ellington Electronics Technology
- 12.1.15.1. Company Overview
- 12.1.15.2. Products
- 12.1.15.3. Company Financials
- 12.1.15.4. SWOT Analysis
- 12.1.16 Guangdong Champion Asia Electronics
- 12.1.16.1. Company Overview
- 12.1.16.2. Products
- 12.1.16.3. Company Financials
- 12.1.16.4. SWOT Analysis
- 12.1.17 Olympic Circuit Technology
- 12.1.17.1. Company Overview
- 12.1.17.2. Products
- 12.1.17.3. Company Financials
- 12.1.17.4. SWOT Analysis
- 12.1.18 Bomin Electronics
- 12.1.18.1. Company Overview
- 12.1.18.2. Products
- 12.1.18.3. Company Financials
- 12.1.18.4. SWOT Analysis
- 12.1.19 Guangdong Goworld
- 12.1.19.1. Company Overview
- 12.1.19.2. Products
- 12.1.19.3. Company Financials
- 12.1.19.4. SWOT Analysis
- 12.1.20 Tianjin Printronics Circuit
- 12.1.20.1. Company Overview
- 12.1.20.2. Products
- 12.1.20.3. Company Financials
- 12.1.20.4. SWOT Analysis
- 12.1.21 Guangdong Chaohua Technology
- 12.1.21.1. Company Overview
- 12.1.21.2. Products
- 12.1.21.3. Company Financials
- 12.1.21.4. SWOT Analysis
- 12.1.22 Shenzhen Fastprint Circuit Tech
- 12.1.22.1. Company Overview
- 12.1.22.2. Products
- 12.1.22.3. Company Financials
- 12.1.22.4. SWOT Analysis
- 12.1.23 WUS Printed Circuit
- 12.1.23.1. Company Overview
- 12.1.23.2. Products
- 12.1.23.3. Company Financials
- 12.1.23.4. SWOT Analysis
- 12.1.24 Huizhou China Eagle Electronic Technology
- 12.1.24.1. Company Overview
- 12.1.24.2. Products
- 12.1.24.3. Company Financials
- 12.1.24.4. SWOT Analysis
- 12.1.25 Goldenmax International Technology
- 12.1.25.1. Company Overview
- 12.1.25.2. Products
- 12.1.25.3. Company Financials
- 12.1.25.4. SWOT Analysis
- 12.1.26 Suntak Technology
- 12.1.26.1. Company Overview
- 12.1.26.2. Products
- 12.1.26.3. Company Financials
- 12.1.26.4. SWOT Analysis
- 12.1.27 Aoshikang Technology
- 12.1.27.1. Company Overview
- 12.1.27.2. Products
- 12.1.27.3. Company Financials
- 12.1.27.4. SWOT Analysis
- 12.1.28 Avary Holding
- 12.1.28.1. Company Overview
- 12.1.28.2. Products
- 12.1.28.3. Company Financials
- 12.1.28.4. SWOT Analysis
- 12.1.29 Guangdong Kingshine Electronic Technology
- 12.1.29.1. Company Overview
- 12.1.29.2. Products
- 12.1.29.3. Company Financials
- 12.1.29.4. SWOT Analysis
- 12.1.1 Zhen Ding Tech
- 12.2. Market Entropy
- 12.2.1 Company's Key Areas Served
- 12.2.2 Recent Developments
- 12.3. Company Market Share Analysis 2025
- 12.3.1 Top 5 Companies Market Share Analysis
- 12.3.2 Top 3 Companies Market Share Analysis
- 12.4. List of Potential Customers
- 13. Research Methodology
List of Figures
- Figure 1: Global Communication PCB Revenue Breakdown (undefined, %) by Region 2025 & 2033
- Figure 2: Global Communication PCB Volume Breakdown (K, %) by Region 2025 & 2033
- Figure 3: North America Communication PCB Revenue (undefined), by Application 2025 & 2033
- Figure 4: North America Communication PCB Volume (K), by Application 2025 & 2033
- Figure 5: North America Communication PCB Revenue Share (%), by Application 2025 & 2033
- Figure 6: North America Communication PCB Volume Share (%), by Application 2025 & 2033
- Figure 7: North America Communication PCB Revenue (undefined), by Types 2025 & 2033
- Figure 8: North America Communication PCB Volume (K), by Types 2025 & 2033
- Figure 9: North America Communication PCB Revenue Share (%), by Types 2025 & 2033
- Figure 10: North America Communication PCB Volume Share (%), by Types 2025 & 2033
- Figure 11: North America Communication PCB Revenue (undefined), by Country 2025 & 2033
- Figure 12: North America Communication PCB Volume (K), by Country 2025 & 2033
- Figure 13: North America Communication PCB Revenue Share (%), by Country 2025 & 2033
- Figure 14: North America Communication PCB Volume Share (%), by Country 2025 & 2033
- Figure 15: South America Communication PCB Revenue (undefined), by Application 2025 & 2033
- Figure 16: South America Communication PCB Volume (K), by Application 2025 & 2033
- Figure 17: South America Communication PCB Revenue Share (%), by Application 2025 & 2033
- Figure 18: South America Communication PCB Volume Share (%), by Application 2025 & 2033
- Figure 19: South America Communication PCB Revenue (undefined), by Types 2025 & 2033
- Figure 20: South America Communication PCB Volume (K), by Types 2025 & 2033
- Figure 21: South America Communication PCB Revenue Share (%), by Types 2025 & 2033
- Figure 22: South America Communication PCB Volume Share (%), by Types 2025 & 2033
- Figure 23: South America Communication PCB Revenue (undefined), by Country 2025 & 2033
- Figure 24: South America Communication PCB Volume (K), by Country 2025 & 2033
- Figure 25: South America Communication PCB Revenue Share (%), by Country 2025 & 2033
- Figure 26: South America Communication PCB Volume Share (%), by Country 2025 & 2033
- Figure 27: Europe Communication PCB Revenue (undefined), by Application 2025 & 2033
- Figure 28: Europe Communication PCB Volume (K), by Application 2025 & 2033
- Figure 29: Europe Communication PCB Revenue Share (%), by Application 2025 & 2033
- Figure 30: Europe Communication PCB Volume Share (%), by Application 2025 & 2033
- Figure 31: Europe Communication PCB Revenue (undefined), by Types 2025 & 2033
- Figure 32: Europe Communication PCB Volume (K), by Types 2025 & 2033
- Figure 33: Europe Communication PCB Revenue Share (%), by Types 2025 & 2033
- Figure 34: Europe Communication PCB Volume Share (%), by Types 2025 & 2033
- Figure 35: Europe Communication PCB Revenue (undefined), by Country 2025 & 2033
- Figure 36: Europe Communication PCB Volume (K), by Country 2025 & 2033
- Figure 37: Europe Communication PCB Revenue Share (%), by Country 2025 & 2033
- Figure 38: Europe Communication PCB Volume Share (%), by Country 2025 & 2033
- Figure 39: Middle East & Africa Communication PCB Revenue (undefined), by Application 2025 & 2033
- Figure 40: Middle East & Africa Communication PCB Volume (K), by Application 2025 & 2033
- Figure 41: Middle East & Africa Communication PCB Revenue Share (%), by Application 2025 & 2033
- Figure 42: Middle East & Africa Communication PCB Volume Share (%), by Application 2025 & 2033
- Figure 43: Middle East & Africa Communication PCB Revenue (undefined), by Types 2025 & 2033
- Figure 44: Middle East & Africa Communication PCB Volume (K), by Types 2025 & 2033
- Figure 45: Middle East & Africa Communication PCB Revenue Share (%), by Types 2025 & 2033
- Figure 46: Middle East & Africa Communication PCB Volume Share (%), by Types 2025 & 2033
- Figure 47: Middle East & Africa Communication PCB Revenue (undefined), by Country 2025 & 2033
- Figure 48: Middle East & Africa Communication PCB Volume (K), by Country 2025 & 2033
- Figure 49: Middle East & Africa Communication PCB Revenue Share (%), by Country 2025 & 2033
- Figure 50: Middle East & Africa Communication PCB Volume Share (%), by Country 2025 & 2033
- Figure 51: Asia Pacific Communication PCB Revenue (undefined), by Application 2025 & 2033
- Figure 52: Asia Pacific Communication PCB Volume (K), by Application 2025 & 2033
- Figure 53: Asia Pacific Communication PCB Revenue Share (%), by Application 2025 & 2033
- Figure 54: Asia Pacific Communication PCB Volume Share (%), by Application 2025 & 2033
- Figure 55: Asia Pacific Communication PCB Revenue (undefined), by Types 2025 & 2033
- Figure 56: Asia Pacific Communication PCB Volume (K), by Types 2025 & 2033
- Figure 57: Asia Pacific Communication PCB Revenue Share (%), by Types 2025 & 2033
- Figure 58: Asia Pacific Communication PCB Volume Share (%), by Types 2025 & 2033
- Figure 59: Asia Pacific Communication PCB Revenue (undefined), by Country 2025 & 2033
- Figure 60: Asia Pacific Communication PCB Volume (K), by Country 2025 & 2033
- Figure 61: Asia Pacific Communication PCB Revenue Share (%), by Country 2025 & 2033
- Figure 62: Asia Pacific Communication PCB Volume Share (%), by Country 2025 & 2033
List of Tables
- Table 1: Global Communication PCB Revenue undefined Forecast, by Application 2020 & 2033
- Table 2: Global Communication PCB Volume K Forecast, by Application 2020 & 2033
- Table 3: Global Communication PCB Revenue undefined Forecast, by Types 2020 & 2033
- Table 4: Global Communication PCB Volume K Forecast, by Types 2020 & 2033
- Table 5: Global Communication PCB Revenue undefined Forecast, by Region 2020 & 2033
- Table 6: Global Communication PCB Volume K Forecast, by Region 2020 & 2033
- Table 7: Global Communication PCB Revenue undefined Forecast, by Application 2020 & 2033
- Table 8: Global Communication PCB Volume K Forecast, by Application 2020 & 2033
- Table 9: Global Communication PCB Revenue undefined Forecast, by Types 2020 & 2033
- Table 10: Global Communication PCB Volume K Forecast, by Types 2020 & 2033
- Table 11: Global Communication PCB Revenue undefined Forecast, by Country 2020 & 2033
- Table 12: Global Communication PCB Volume K Forecast, by Country 2020 & 2033
- Table 13: United States Communication PCB Revenue (undefined) Forecast, by Application 2020 & 2033
- Table 14: United States Communication PCB Volume (K) Forecast, by Application 2020 & 2033
- Table 15: Canada Communication PCB Revenue (undefined) Forecast, by Application 2020 & 2033
- Table 16: Canada Communication PCB Volume (K) Forecast, by Application 2020 & 2033
- Table 17: Mexico Communication PCB Revenue (undefined) Forecast, by Application 2020 & 2033
- Table 18: Mexico Communication PCB Volume (K) Forecast, by Application 2020 & 2033
- Table 19: Global Communication PCB Revenue undefined Forecast, by Application 2020 & 2033
- Table 20: Global Communication PCB Volume K Forecast, by Application 2020 & 2033
- Table 21: Global Communication PCB Revenue undefined Forecast, by Types 2020 & 2033
- Table 22: Global Communication PCB Volume K Forecast, by Types 2020 & 2033
- Table 23: Global Communication PCB Revenue undefined Forecast, by Country 2020 & 2033
- Table 24: Global Communication PCB Volume K Forecast, by Country 2020 & 2033
- Table 25: Brazil Communication PCB Revenue (undefined) Forecast, by Application 2020 & 2033
- Table 26: Brazil Communication PCB Volume (K) Forecast, by Application 2020 & 2033
- Table 27: Argentina Communication PCB Revenue (undefined) Forecast, by Application 2020 & 2033
- Table 28: Argentina Communication PCB Volume (K) Forecast, by Application 2020 & 2033
- Table 29: Rest of South America Communication PCB Revenue (undefined) Forecast, by Application 2020 & 2033
- Table 30: Rest of South America Communication PCB Volume (K) Forecast, by Application 2020 & 2033
- Table 31: Global Communication PCB Revenue undefined Forecast, by Application 2020 & 2033
- Table 32: Global Communication PCB Volume K Forecast, by Application 2020 & 2033
- Table 33: Global Communication PCB Revenue undefined Forecast, by Types 2020 & 2033
- Table 34: Global Communication PCB Volume K Forecast, by Types 2020 & 2033
- Table 35: Global Communication PCB Revenue undefined Forecast, by Country 2020 & 2033
- Table 36: Global Communication PCB Volume K Forecast, by Country 2020 & 2033
- Table 37: United Kingdom Communication PCB Revenue (undefined) Forecast, by Application 2020 & 2033
- Table 38: United Kingdom Communication PCB Volume (K) Forecast, by Application 2020 & 2033
- Table 39: Germany Communication PCB Revenue (undefined) Forecast, by Application 2020 & 2033
- Table 40: Germany Communication PCB Volume (K) Forecast, by Application 2020 & 2033
- Table 41: France Communication PCB Revenue (undefined) Forecast, by Application 2020 & 2033
- Table 42: France Communication PCB Volume (K) Forecast, by Application 2020 & 2033
- Table 43: Italy Communication PCB Revenue (undefined) Forecast, by Application 2020 & 2033
- Table 44: Italy Communication PCB Volume (K) Forecast, by Application 2020 & 2033
- Table 45: Spain Communication PCB Revenue (undefined) Forecast, by Application 2020 & 2033
- Table 46: Spain Communication PCB Volume (K) Forecast, by Application 2020 & 2033
- Table 47: Russia Communication PCB Revenue (undefined) Forecast, by Application 2020 & 2033
- Table 48: Russia Communication PCB Volume (K) Forecast, by Application 2020 & 2033
- Table 49: Benelux Communication PCB Revenue (undefined) Forecast, by Application 2020 & 2033
- Table 50: Benelux Communication PCB Volume (K) Forecast, by Application 2020 & 2033
- Table 51: Nordics Communication PCB Revenue (undefined) Forecast, by Application 2020 & 2033
- Table 52: Nordics Communication PCB Volume (K) Forecast, by Application 2020 & 2033
- Table 53: Rest of Europe Communication PCB Revenue (undefined) Forecast, by Application 2020 & 2033
- Table 54: Rest of Europe Communication PCB Volume (K) Forecast, by Application 2020 & 2033
- Table 55: Global Communication PCB Revenue undefined Forecast, by Application 2020 & 2033
- Table 56: Global Communication PCB Volume K Forecast, by Application 2020 & 2033
- Table 57: Global Communication PCB Revenue undefined Forecast, by Types 2020 & 2033
- Table 58: Global Communication PCB Volume K Forecast, by Types 2020 & 2033
- Table 59: Global Communication PCB Revenue undefined Forecast, by Country 2020 & 2033
- Table 60: Global Communication PCB Volume K Forecast, by Country 2020 & 2033
- Table 61: Turkey Communication PCB Revenue (undefined) Forecast, by Application 2020 & 2033
- Table 62: Turkey Communication PCB Volume (K) Forecast, by Application 2020 & 2033
- Table 63: Israel Communication PCB Revenue (undefined) Forecast, by Application 2020 & 2033
- Table 64: Israel Communication PCB Volume (K) Forecast, by Application 2020 & 2033
- Table 65: GCC Communication PCB Revenue (undefined) Forecast, by Application 2020 & 2033
- Table 66: GCC Communication PCB Volume (K) Forecast, by Application 2020 & 2033
- Table 67: North Africa Communication PCB Revenue (undefined) Forecast, by Application 2020 & 2033
- Table 68: North Africa Communication PCB Volume (K) Forecast, by Application 2020 & 2033
- Table 69: South Africa Communication PCB Revenue (undefined) Forecast, by Application 2020 & 2033
- Table 70: South Africa Communication PCB Volume (K) Forecast, by Application 2020 & 2033
- Table 71: Rest of Middle East & Africa Communication PCB Revenue (undefined) Forecast, by Application 2020 & 2033
- Table 72: Rest of Middle East & Africa Communication PCB Volume (K) Forecast, by Application 2020 & 2033
- Table 73: Global Communication PCB Revenue undefined Forecast, by Application 2020 & 2033
- Table 74: Global Communication PCB Volume K Forecast, by Application 2020 & 2033
- Table 75: Global Communication PCB Revenue undefined Forecast, by Types 2020 & 2033
- Table 76: Global Communication PCB Volume K Forecast, by Types 2020 & 2033
- Table 77: Global Communication PCB Revenue undefined Forecast, by Country 2020 & 2033
- Table 78: Global Communication PCB Volume K Forecast, by Country 2020 & 2033
- Table 79: China Communication PCB Revenue (undefined) Forecast, by Application 2020 & 2033
- Table 80: China Communication PCB Volume (K) Forecast, by Application 2020 & 2033
- Table 81: India Communication PCB Revenue (undefined) Forecast, by Application 2020 & 2033
- Table 82: India Communication PCB Volume (K) Forecast, by Application 2020 & 2033
- Table 83: Japan Communication PCB Revenue (undefined) Forecast, by Application 2020 & 2033
- Table 84: Japan Communication PCB Volume (K) Forecast, by Application 2020 & 2033
- Table 85: South Korea Communication PCB Revenue (undefined) Forecast, by Application 2020 & 2033
- Table 86: South Korea Communication PCB Volume (K) Forecast, by Application 2020 & 2033
- Table 87: ASEAN Communication PCB Revenue (undefined) Forecast, by Application 2020 & 2033
- Table 88: ASEAN Communication PCB Volume (K) Forecast, by Application 2020 & 2033
- Table 89: Oceania Communication PCB Revenue (undefined) Forecast, by Application 2020 & 2033
- Table 90: Oceania Communication PCB Volume (K) Forecast, by Application 2020 & 2033
- Table 91: Rest of Asia Pacific Communication PCB Revenue (undefined) Forecast, by Application 2020 & 2033
- Table 92: Rest of Asia Pacific Communication PCB Volume (K) Forecast, by Application 2020 & 2033
Frequently Asked Questions
1. What is the projected Compound Annual Growth Rate (CAGR) of the Communication PCB?
The projected CAGR is approximately 7.5%.
2. Which companies are prominent players in the Communication PCB?
Key companies in the market include Zhen Ding Tech, Unimicron, TTM Technologies, Nippon Mektron, Suzhou Dongshan Precision Manufacturing, Compeq Manufacturing, Tripod, Shennan Circuits, AT&S, Shengyi Technology, Nan Ya PCB Corporation, Founder Technology, Zhejiang Wazam New Materials, Shenzhen Kinwong Electronic, Guangdong Ellington Electronics Technology, Guangdong Champion Asia Electronics, Olympic Circuit Technology, Bomin Electronics, Guangdong Goworld, Tianjin Printronics Circuit, Guangdong Chaohua Technology, Shenzhen Fastprint Circuit Tech, WUS Printed Circuit, Huizhou China Eagle Electronic Technology, Goldenmax International Technology, Suntak Technology, Aoshikang Technology, Avary Holding, Guangdong Kingshine Electronic Technology.
3. What are the main segments of the Communication PCB?
The market segments include Application, Types.
4. Can you provide details about the market size?
The market size is estimated to be USD XXX N/A as of 2022.
5. What are some drivers contributing to market growth?
N/A
6. What are the notable trends driving market growth?
N/A
7. Are there any restraints impacting market growth?
N/A
8. Can you provide examples of recent developments in the market?
N/A
9. What pricing options are available for accessing the report?
Pricing options include single-user, multi-user, and enterprise licenses priced at USD 4350.00, USD 6525.00, and USD 8700.00 respectively.
10. Is the market size provided in terms of value or volume?
The market size is provided in terms of value, measured in N/A and volume, measured in K.
11. Are there any specific market keywords associated with the report?
Yes, the market keyword associated with the report is "Communication PCB," which aids in identifying and referencing the specific market segment covered.
12. How do I determine which pricing option suits my needs best?
The pricing options vary based on user requirements and access needs. Individual users may opt for single-user licenses, while businesses requiring broader access may choose multi-user or enterprise licenses for cost-effective access to the report.
13. Are there any additional resources or data provided in the Communication PCB report?
While the report offers comprehensive insights, it's advisable to review the specific contents or supplementary materials provided to ascertain if additional resources or data are available.
14. How can I stay updated on further developments or reports in the Communication PCB?
To stay informed about further developments, trends, and reports in the Communication PCB, consider subscribing to industry newsletters, following relevant companies and organizations, or regularly checking reputable industry news sources and publications.
Methodology
Step 1 - Identification of Relevant Samples Size from Population Database


Step 2 - Approaches for Defining Global Market Size (Value, Volume* & Price*)

Note*: In applicable scenarios
Step 3 - Data Sources
Primary Research
- Web Analytics
- Survey Reports
- Research Institute
- Latest Research Reports
- Opinion Leaders
Secondary Research
- Annual Reports
- White Paper
- Latest Press Release
- Industry Association
- Paid Database
- Investor Presentations

Step 4 - Data Triangulation
Involves using different sources of information in order to increase the validity of a study
These sources are likely to be stakeholders in a program - participants, other researchers, program staff, other community members, and so on.
Then we put all data in single framework & apply various statistical tools to find out the dynamic on the market.
During the analysis stage, feedback from the stakeholder groups would be compared to determine areas of agreement as well as areas of divergence