

Key Insights
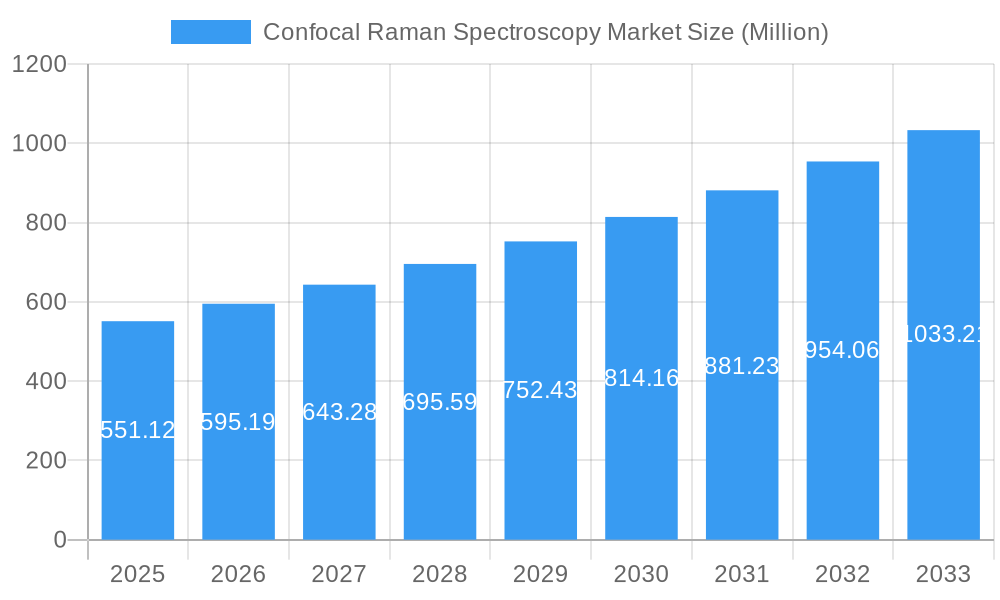
The confocal Raman spectroscopy market, valued at $551.12 million in 2025, is projected to experience robust growth, driven by increasing applications in diverse fields such as life sciences, materials science, and pharmaceuticals. The market's Compound Annual Growth Rate (CAGR) of 8% from 2025 to 2033 indicates a significant expansion, fueled by technological advancements leading to improved sensitivity, resolution, and speed of analysis. This growth is further propelled by the rising demand for non-destructive, label-free analytical techniques, making confocal Raman spectroscopy an attractive alternative to traditional methods. Key drivers include the increasing adoption of this technology in research and development, the growing need for quality control and assurance in various industries, and the development of user-friendly and portable instruments. The market is segmented based on applications (e.g., biomedical imaging, material characterization, environmental monitoring) and instrument types (e.g., portable, benchtop). Leading players like HORIBA, Renishaw, and Bruker are actively investing in R&D and strategic partnerships to enhance their market position and capitalize on emerging opportunities. Competitive landscape analysis reveals a trend toward developing integrated solutions combining Raman spectroscopy with other analytical techniques for comprehensive data analysis.
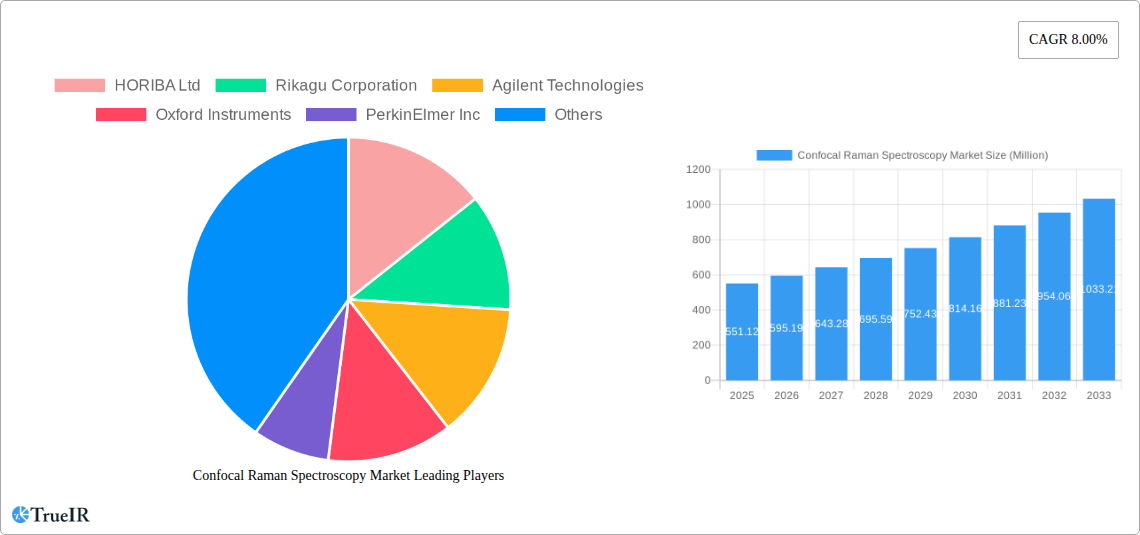
Confocal Raman Spectroscopy Market Market Size (In Million)
The projected market size in 2033, considering the 8% CAGR, is estimated to be approximately $1,165 million. This substantial growth is expected despite potential restraints such as the relatively high cost of instruments and the need for specialized expertise for operation and data interpretation. However, ongoing miniaturization and automation efforts are mitigating these constraints, making confocal Raman spectroscopy more accessible to a wider range of users. The market is geographically diverse, with significant contributions anticipated from North America, Europe, and Asia Pacific regions. Future growth will depend on technological innovation, expanding applications, and successful market penetration strategies by key players.
Confocal Raman Spectroscopy Market Company Market Share
Confocal Raman Spectroscopy Market: A Comprehensive Report (2019-2033)
This dynamic report provides a thorough analysis of the Confocal Raman Spectroscopy market, offering invaluable insights for businesses, researchers, and investors. Covering the period from 2019 to 2033, with a focus on 2025, this study details market size, growth projections, competitive dynamics, and key technological advancements. The report leverages extensive data analysis and expert insights to illuminate current trends and predict future market trajectories. Expect detailed segmentation analysis, competitive landscaping, and identification of lucrative opportunities within this rapidly evolving sector.
Confocal Raman Spectroscopy Market Structure & Competitive Landscape
The Confocal Raman Spectroscopy market exhibits a moderately concentrated structure, with several key players dominating market share. The market concentration ratio (CR4) is estimated at xx%, indicating a presence of significant competition alongside a few major players. Innovation is a critical driver, with companies constantly striving to improve instrument sensitivity, resolution, and ease of use. Regulatory impacts vary by region, with some jurisdictions having stricter guidelines for medical applications than others. Product substitutes, such as other spectroscopic techniques (e.g., FTIR), exert competitive pressure, necessitating continuous innovation to maintain market position.
The market is segmented by end-user, with significant demand from pharmaceutical and biomedical research, materials science, and nanotechnology sectors. The end-user segmentation will be extensively discussed in subsequent sections with detailed market size data for each segment.
Mergers and acquisitions (M&A) activity has been moderate in recent years, with xx M&A deals recorded between 2019 and 2024. Notable examples include the February 2024 acquisition of Nanophoton Corporation by Bruker Corporation, significantly bolstering Bruker's market presence. These M&A activities are expected to continue, driven by a need for expansion into new markets and technologies.
- Market Concentration: CR4 estimated at xx%
- Innovation Drivers: Enhanced sensitivity, resolution, ease of use
- Regulatory Impacts: Vary by region and application
- Product Substitutes: FTIR, other spectroscopic techniques
- End-User Segmentation: Pharmaceuticals, Biomedical research, Materials science, Nanotechnology
- M&A Trends: xx deals between 2019 and 2024, significant strategic moves observed.
Confocal Raman Spectroscopy Market Trends & Opportunities
The Confocal Raman Spectroscopy market is projected to experience significant growth during the forecast period (2025-2033), with a Compound Annual Growth Rate (CAGR) of xx%. This growth is driven by several key factors, including the increasing adoption of confocal Raman spectroscopy in various applications, technological advancements leading to improved instrument performance and affordability, and rising research and development activities across diverse scientific fields. Furthermore, growing demand for advanced analytical techniques in quality control, process monitoring and the life sciences industries is further fueling this market expansion. Market penetration rates are expected to increase steadily across key segments.
The market is witnessing a notable shift toward miniaturized, portable systems, enabling in-situ and real-time analysis. This trend is attracting new applications in diverse fields such as environmental monitoring and industrial process control, further contributing to market expansion. The competitive landscape is highly dynamic, characterized by continuous innovation in terms of instrument design, software, and data analysis capabilities. This necessitates continuous improvement in technology and strategic adaptations to cater to changing market demands. Market leaders are investing significantly in research and development to maintain their edge.
Dominant Markets & Segments in Confocal Raman Spectroscopy Market
North America currently holds the dominant position in the Confocal Raman Spectroscopy market, driven primarily by significant investments in research and development, strong government support for scientific endeavors, and the presence of major industry players. Europe is another significant market, followed by Asia-Pacific, with particularly strong growth projected in China and Japan.
Key Growth Drivers in North America:
- High R&D expenditure in academia and industry
- Robust government funding for scientific research
- Presence of major instrumentation manufacturers
- Well-established regulatory framework
Key Growth Drivers in Asia-Pacific:
- Rapid industrialization and economic growth
- Increasing government investment in scientific infrastructure
- Expanding pharmaceutical and biopharmaceutical sectors
- Growing demand for advanced analytical techniques in quality control.
The biomedical research sector presents a particularly strong growth opportunity, driven by the technique's capacity for non-destructive, high-resolution analysis of biological samples. The materials science sector also displays promising growth potential due to the increasing need for characterizing nanomaterials and advanced materials.
Confocal Raman Spectroscopy Market Product Analysis
Recent innovations in confocal Raman spectroscopy have focused on enhancing sensitivity, resolution, and speed of analysis. Advances in laser technology, detectors, and data processing algorithms are driving these improvements. The integration of advanced features such as automated sample handling, sophisticated data analysis software and advanced microscopy techniques provide significant competitive advantages. This is leading to the wider adoption of these systems across a broad range of applications and scientific disciplines. The market’s evolving demand necessitates continuous development of specialized instruments tailored for specific end-user applications, such as high-throughput screening, single-cell analysis and chemical mapping.
Key Drivers, Barriers & Challenges in Confocal Raman Spectroscopy Market
Key Drivers:
- Technological advancements: Improved sensitivity, resolution, and speed of analysis.
- Growing applications: Expanding applications in diverse fields such as pharmaceuticals, materials science, and nanotechnology.
- Increasing demand: Growing need for advanced analytical techniques in research and industrial settings.
Challenges and Restraints:
- High cost of instrumentation: Confocal Raman microscopes represent significant capital expenditure, limiting accessibility for certain organizations.
- Complex data analysis: Data interpretation can be challenging, requiring specialized expertise.
- Competitive pressure: The market is quite competitive with many established companies, leading to pressure on pricing and margins. This competition is also driving innovation.
Growth Drivers in the Confocal Raman Spectroscopy Market
Technological advancements, such as improved laser sources, detectors, and data processing algorithms, are driving significant growth. The broadening range of applications in fields like biomedical research, materials science, and environmental monitoring are also crucial factors. Government funding and industry investments in R&D further enhance the market's expansion.
Challenges Impacting Confocal Raman Spectroscopy Market Growth
High initial costs, coupled with the need for skilled operators, pose significant barriers to entry for some potential users. Furthermore, the complexity of data analysis and interpretation requires specific expertise, while the competitive landscape necessitates continued innovation to maintain a competitive edge.
Key Players Shaping the Confocal Raman Spectroscopy Market
Significant Confocal Raman Spectroscopy Market Industry Milestones
- June 2024: Shimadzu launched the AIRsight Infrared/Raman Microscope, merging FTIR and Raman spectroscopy into a single instrument, enhancing analysis efficiency and accuracy.
- February 2024: Bruker Corporation acquired Nanophoton Corporation, expanding its portfolio of Raman microscopes and global reach.
Future Outlook for Confocal Raman Spectroscopy Market
The Confocal Raman Spectroscopy market is poised for continued growth, driven by ongoing technological advancements, the expansion into new applications, and increasing investments in research and development. The market presents strong opportunities for companies that can offer innovative solutions, user-friendly interfaces and comprehensive support to a broad range of end-users. Strategic partnerships and acquisitions will likely play a key role in shaping future market dynamics. The integration of artificial intelligence and machine learning in data analysis is expected to further enhance the technology’s capabilities, thereby driving wider adoption across many sectors.
Confocal Raman Spectroscopy Market Segmentation
-
1. Type
- 1.1. Desktop
- 1.2. Portable
-
2. End User
- 2.1. Pharmaceuticals
- 2.2. R&D in Academia
- 2.3. Industrial Sectors
- 2.4. Others
Confocal Raman Spectroscopy Market Segmentation By Geography
- 1. North America
- 2. Europe
- 3. Asia
- 4. Australia and New Zealand
- 5. Latin America
- 6. Middle East and Africa
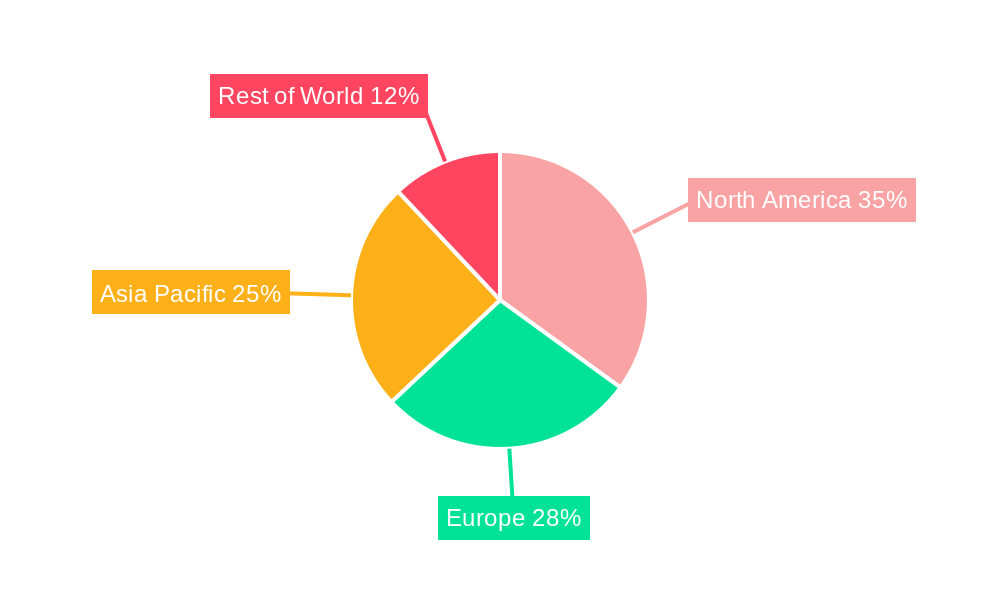
Confocal Raman Spectroscopy Market Regional Market Share
Geographic Coverage of Confocal Raman Spectroscopy Market
Confocal Raman Spectroscopy Market REPORT HIGHLIGHTS
| Aspects | Details |
|---|---|
| Study Period | 2020-2034 |
| Base Year | 2025 |
| Estimated Year | 2026 |
| Forecast Period | 2026-2034 |
| Historical Period | 2020-2025 |
| Growth Rate | CAGR of 8.00% from 2020-2034 |
| Segmentation |
|
Table of Contents
- 1. Introduction
- 1.1. Research Scope
- 1.2. Market Segmentation
- 1.3. Research Objective
- 1.4. Definitions and Assumptions
- 2. Executive Summary
- 2.1. Market Snapshot
- 3. Market Dynamics
- 3.1. Market Drivers
- 3.2. Market Restrains
- 3.3. Market Trends
- 3.4. Market Opportunities
- 4. Market Factor Analysis
- 4.1. Porters Five Forces
- 4.1.1. Bargaining Power of Suppliers
- 4.1.2. Bargaining Power of Buyers
- 4.1.3. Threat of New Entrants
- 4.1.4. Threat of Substitutes
- 4.1.5. Competitive Rivalry
- 4.2. PESTEL analysis
- 4.3. BCG Analysis
- 4.3.1. Stars (High Growth, High Market Share)
- 4.3.2. Cash Cows (Low Growth, High Market Share)
- 4.3.3. Question Mark (High Growth, Low Market Share)
- 4.3.4. Dogs (Low Growth, Low Market Share)
- 4.4. Ansoff Matrix Analysis
- 4.5. Supply Chain Analysis
- 4.6. Regulatory Landscape
- 4.7. Current Market Potential and Opportunity Assessment (TAM–SAM–SOM Framework)
- 4.8. TIR Analyst Note
- 4.1. Porters Five Forces
- 5. Market Analysis, Insights and Forecast 2021-2033
- 5.1. Market Analysis, Insights and Forecast - by Type
- 5.1.1. Desktop
- 5.1.2. Portable
- 5.2. Market Analysis, Insights and Forecast - by End User
- 5.2.1. Pharmaceuticals
- 5.2.2. R&D in Academia
- 5.2.3. Industrial Sectors
- 5.2.4. Others
- 5.3. Market Analysis, Insights and Forecast - by Region
- 5.3.1. North America
- 5.3.2. Europe
- 5.3.3. Asia
- 5.3.4. Australia and New Zealand
- 5.3.5. Latin America
- 5.3.6. Middle East and Africa
- 5.1. Market Analysis, Insights and Forecast - by Type
- 6. Global Confocal Raman Spectroscopy Market Analysis, Insights and Forecast, 2021-2033
- 6.1. Market Analysis, Insights and Forecast - by Type
- 6.1.1. Desktop
- 6.1.2. Portable
- 6.2. Market Analysis, Insights and Forecast - by End User
- 6.2.1. Pharmaceuticals
- 6.2.2. R&D in Academia
- 6.2.3. Industrial Sectors
- 6.2.4. Others
- 6.1. Market Analysis, Insights and Forecast - by Type
- 7. North America Confocal Raman Spectroscopy Market Analysis, Insights and Forecast, 2020-2032
- 7.1. Market Analysis, Insights and Forecast - by Type
- 7.1.1. Desktop
- 7.1.2. Portable
- 7.2. Market Analysis, Insights and Forecast - by End User
- 7.2.1. Pharmaceuticals
- 7.2.2. R&D in Academia
- 7.2.3. Industrial Sectors
- 7.2.4. Others
- 7.1. Market Analysis, Insights and Forecast - by Type
- 8. Europe Confocal Raman Spectroscopy Market Analysis, Insights and Forecast, 2020-2032
- 8.1. Market Analysis, Insights and Forecast - by Type
- 8.1.1. Desktop
- 8.1.2. Portable
- 8.2. Market Analysis, Insights and Forecast - by End User
- 8.2.1. Pharmaceuticals
- 8.2.2. R&D in Academia
- 8.2.3. Industrial Sectors
- 8.2.4. Others
- 8.1. Market Analysis, Insights and Forecast - by Type
- 9. Asia Confocal Raman Spectroscopy Market Analysis, Insights and Forecast, 2020-2032
- 9.1. Market Analysis, Insights and Forecast - by Type
- 9.1.1. Desktop
- 9.1.2. Portable
- 9.2. Market Analysis, Insights and Forecast - by End User
- 9.2.1. Pharmaceuticals
- 9.2.2. R&D in Academia
- 9.2.3. Industrial Sectors
- 9.2.4. Others
- 9.1. Market Analysis, Insights and Forecast - by Type
- 10. Australia and New Zealand Confocal Raman Spectroscopy Market Analysis, Insights and Forecast, 2020-2032
- 10.1. Market Analysis, Insights and Forecast - by Type
- 10.1.1. Desktop
- 10.1.2. Portable
- 10.2. Market Analysis, Insights and Forecast - by End User
- 10.2.1. Pharmaceuticals
- 10.2.2. R&D in Academia
- 10.2.3. Industrial Sectors
- 10.2.4. Others
- 10.1. Market Analysis, Insights and Forecast - by Type
- 11. Latin America Confocal Raman Spectroscopy Market Analysis, Insights and Forecast, 2020-2032
- 11.1. Market Analysis, Insights and Forecast - by Type
- 11.1.1. Desktop
- 11.1.2. Portable
- 11.2. Market Analysis, Insights and Forecast - by End User
- 11.2.1. Pharmaceuticals
- 11.2.2. R&D in Academia
- 11.2.3. Industrial Sectors
- 11.2.4. Others
- 11.1. Market Analysis, Insights and Forecast - by Type
- 12. Middle East and Africa Confocal Raman Spectroscopy Market Analysis, Insights and Forecast, 2020-2032
- 12.1. Market Analysis, Insights and Forecast - by Type
- 12.1.1. Desktop
- 12.1.2. Portable
- 12.2. Market Analysis, Insights and Forecast - by End User
- 12.2.1. Pharmaceuticals
- 12.2.2. R&D in Academia
- 12.2.3. Industrial Sectors
- 12.2.4. Others
- 12.1. Market Analysis, Insights and Forecast - by Type
- 13. Competitive Analysis
- 13.1. Company Profiles
- 13.1.1 HORIBA Ltd
- 13.1.1.1. Company Overview
- 13.1.1.2. Products
- 13.1.1.3. Company Financials
- 13.1.1.4. SWOT Analysis
- 13.1.2 Rikagu Corporation
- 13.1.2.1. Company Overview
- 13.1.2.2. Products
- 13.1.2.3. Company Financials
- 13.1.2.4. SWOT Analysis
- 13.1.3 Agilent Technologies
- 13.1.3.1. Company Overview
- 13.1.3.2. Products
- 13.1.3.3. Company Financials
- 13.1.3.4. SWOT Analysis
- 13.1.4 Oxford Instruments
- 13.1.4.1. Company Overview
- 13.1.4.2. Products
- 13.1.4.3. Company Financials
- 13.1.4.4. SWOT Analysis
- 13.1.5 PerkinElmer Inc
- 13.1.5.1. Company Overview
- 13.1.5.2. Products
- 13.1.5.3. Company Financials
- 13.1.5.4. SWOT Analysis
- 13.1.6 Renishaw PLC
- 13.1.6.1. Company Overview
- 13.1.6.2. Products
- 13.1.6.3. Company Financials
- 13.1.6.4. SWOT Analysis
- 13.1.7 Bruker Corporation
- 13.1.7.1. Company Overview
- 13.1.7.2. Products
- 13.1.7.3. Company Financials
- 13.1.7.4. SWOT Analysis
- 13.1.8 Thermo Fisher Scientific Inc
- 13.1.8.1. Company Overview
- 13.1.8.2. Products
- 13.1.8.3. Company Financials
- 13.1.8.4. SWOT Analysis
- 13.1.9 Mettler Toledo
- 13.1.9.1. Company Overview
- 13.1.9.2. Products
- 13.1.9.3. Company Financials
- 13.1.9.4. SWOT Analysis
- 13.1.10 Hamamatsu Photonics KK*List Not Exhaustive
- 13.1.10.1. Company Overview
- 13.1.10.2. Products
- 13.1.10.3. Company Financials
- 13.1.10.4. SWOT Analysis
- 13.1.1 HORIBA Ltd
- 13.2. Market Entropy
- 13.2.1 Company's Key Areas Served
- 13.2.2 Recent Developments
- 13.3. Company Market Share Analysis 2025
- 13.3.1 Top 5 Companies Market Share Analysis
- 13.3.2 Top 3 Companies Market Share Analysis
- 13.4. List of Potential Customers
- 14. Research Methodology
List of Figures
- Figure 1: Global Confocal Raman Spectroscopy Market Revenue Breakdown (Million, %) by Region 2025 & 2033
- Figure 2: Global Confocal Raman Spectroscopy Market Volume Breakdown (Million, %) by Region 2025 & 2033
- Figure 3: North America Confocal Raman Spectroscopy Market Revenue (Million), by Type 2025 & 2033
- Figure 4: North America Confocal Raman Spectroscopy Market Volume (Million), by Type 2025 & 2033
- Figure 5: North America Confocal Raman Spectroscopy Market Revenue Share (%), by Type 2025 & 2033
- Figure 6: North America Confocal Raman Spectroscopy Market Volume Share (%), by Type 2025 & 2033
- Figure 7: North America Confocal Raman Spectroscopy Market Revenue (Million), by End User 2025 & 2033
- Figure 8: North America Confocal Raman Spectroscopy Market Volume (Million), by End User 2025 & 2033
- Figure 9: North America Confocal Raman Spectroscopy Market Revenue Share (%), by End User 2025 & 2033
- Figure 10: North America Confocal Raman Spectroscopy Market Volume Share (%), by End User 2025 & 2033
- Figure 11: North America Confocal Raman Spectroscopy Market Revenue (Million), by Country 2025 & 2033
- Figure 12: North America Confocal Raman Spectroscopy Market Volume (Million), by Country 2025 & 2033
- Figure 13: North America Confocal Raman Spectroscopy Market Revenue Share (%), by Country 2025 & 2033
- Figure 14: North America Confocal Raman Spectroscopy Market Volume Share (%), by Country 2025 & 2033
- Figure 15: Europe Confocal Raman Spectroscopy Market Revenue (Million), by Type 2025 & 2033
- Figure 16: Europe Confocal Raman Spectroscopy Market Volume (Million), by Type 2025 & 2033
- Figure 17: Europe Confocal Raman Spectroscopy Market Revenue Share (%), by Type 2025 & 2033
- Figure 18: Europe Confocal Raman Spectroscopy Market Volume Share (%), by Type 2025 & 2033
- Figure 19: Europe Confocal Raman Spectroscopy Market Revenue (Million), by End User 2025 & 2033
- Figure 20: Europe Confocal Raman Spectroscopy Market Volume (Million), by End User 2025 & 2033
- Figure 21: Europe Confocal Raman Spectroscopy Market Revenue Share (%), by End User 2025 & 2033
- Figure 22: Europe Confocal Raman Spectroscopy Market Volume Share (%), by End User 2025 & 2033
- Figure 23: Europe Confocal Raman Spectroscopy Market Revenue (Million), by Country 2025 & 2033
- Figure 24: Europe Confocal Raman Spectroscopy Market Volume (Million), by Country 2025 & 2033
- Figure 25: Europe Confocal Raman Spectroscopy Market Revenue Share (%), by Country 2025 & 2033
- Figure 26: Europe Confocal Raman Spectroscopy Market Volume Share (%), by Country 2025 & 2033
- Figure 27: Asia Confocal Raman Spectroscopy Market Revenue (Million), by Type 2025 & 2033
- Figure 28: Asia Confocal Raman Spectroscopy Market Volume (Million), by Type 2025 & 2033
- Figure 29: Asia Confocal Raman Spectroscopy Market Revenue Share (%), by Type 2025 & 2033
- Figure 30: Asia Confocal Raman Spectroscopy Market Volume Share (%), by Type 2025 & 2033
- Figure 31: Asia Confocal Raman Spectroscopy Market Revenue (Million), by End User 2025 & 2033
- Figure 32: Asia Confocal Raman Spectroscopy Market Volume (Million), by End User 2025 & 2033
- Figure 33: Asia Confocal Raman Spectroscopy Market Revenue Share (%), by End User 2025 & 2033
- Figure 34: Asia Confocal Raman Spectroscopy Market Volume Share (%), by End User 2025 & 2033
- Figure 35: Asia Confocal Raman Spectroscopy Market Revenue (Million), by Country 2025 & 2033
- Figure 36: Asia Confocal Raman Spectroscopy Market Volume (Million), by Country 2025 & 2033
- Figure 37: Asia Confocal Raman Spectroscopy Market Revenue Share (%), by Country 2025 & 2033
- Figure 38: Asia Confocal Raman Spectroscopy Market Volume Share (%), by Country 2025 & 2033
- Figure 39: Australia and New Zealand Confocal Raman Spectroscopy Market Revenue (Million), by Type 2025 & 2033
- Figure 40: Australia and New Zealand Confocal Raman Spectroscopy Market Volume (Million), by Type 2025 & 2033
- Figure 41: Australia and New Zealand Confocal Raman Spectroscopy Market Revenue Share (%), by Type 2025 & 2033
- Figure 42: Australia and New Zealand Confocal Raman Spectroscopy Market Volume Share (%), by Type 2025 & 2033
- Figure 43: Australia and New Zealand Confocal Raman Spectroscopy Market Revenue (Million), by End User 2025 & 2033
- Figure 44: Australia and New Zealand Confocal Raman Spectroscopy Market Volume (Million), by End User 2025 & 2033
- Figure 45: Australia and New Zealand Confocal Raman Spectroscopy Market Revenue Share (%), by End User 2025 & 2033
- Figure 46: Australia and New Zealand Confocal Raman Spectroscopy Market Volume Share (%), by End User 2025 & 2033
- Figure 47: Australia and New Zealand Confocal Raman Spectroscopy Market Revenue (Million), by Country 2025 & 2033
- Figure 48: Australia and New Zealand Confocal Raman Spectroscopy Market Volume (Million), by Country 2025 & 2033
- Figure 49: Australia and New Zealand Confocal Raman Spectroscopy Market Revenue Share (%), by Country 2025 & 2033
- Figure 50: Australia and New Zealand Confocal Raman Spectroscopy Market Volume Share (%), by Country 2025 & 2033
- Figure 51: Latin America Confocal Raman Spectroscopy Market Revenue (Million), by Type 2025 & 2033
- Figure 52: Latin America Confocal Raman Spectroscopy Market Volume (Million), by Type 2025 & 2033
- Figure 53: Latin America Confocal Raman Spectroscopy Market Revenue Share (%), by Type 2025 & 2033
- Figure 54: Latin America Confocal Raman Spectroscopy Market Volume Share (%), by Type 2025 & 2033
- Figure 55: Latin America Confocal Raman Spectroscopy Market Revenue (Million), by End User 2025 & 2033
- Figure 56: Latin America Confocal Raman Spectroscopy Market Volume (Million), by End User 2025 & 2033
- Figure 57: Latin America Confocal Raman Spectroscopy Market Revenue Share (%), by End User 2025 & 2033
- Figure 58: Latin America Confocal Raman Spectroscopy Market Volume Share (%), by End User 2025 & 2033
- Figure 59: Latin America Confocal Raman Spectroscopy Market Revenue (Million), by Country 2025 & 2033
- Figure 60: Latin America Confocal Raman Spectroscopy Market Volume (Million), by Country 2025 & 2033
- Figure 61: Latin America Confocal Raman Spectroscopy Market Revenue Share (%), by Country 2025 & 2033
- Figure 62: Latin America Confocal Raman Spectroscopy Market Volume Share (%), by Country 2025 & 2033
- Figure 63: Middle East and Africa Confocal Raman Spectroscopy Market Revenue (Million), by Type 2025 & 2033
- Figure 64: Middle East and Africa Confocal Raman Spectroscopy Market Volume (Million), by Type 2025 & 2033
- Figure 65: Middle East and Africa Confocal Raman Spectroscopy Market Revenue Share (%), by Type 2025 & 2033
- Figure 66: Middle East and Africa Confocal Raman Spectroscopy Market Volume Share (%), by Type 2025 & 2033
- Figure 67: Middle East and Africa Confocal Raman Spectroscopy Market Revenue (Million), by End User 2025 & 2033
- Figure 68: Middle East and Africa Confocal Raman Spectroscopy Market Volume (Million), by End User 2025 & 2033
- Figure 69: Middle East and Africa Confocal Raman Spectroscopy Market Revenue Share (%), by End User 2025 & 2033
- Figure 70: Middle East and Africa Confocal Raman Spectroscopy Market Volume Share (%), by End User 2025 & 2033
- Figure 71: Middle East and Africa Confocal Raman Spectroscopy Market Revenue (Million), by Country 2025 & 2033
- Figure 72: Middle East and Africa Confocal Raman Spectroscopy Market Volume (Million), by Country 2025 & 2033
- Figure 73: Middle East and Africa Confocal Raman Spectroscopy Market Revenue Share (%), by Country 2025 & 2033
- Figure 74: Middle East and Africa Confocal Raman Spectroscopy Market Volume Share (%), by Country 2025 & 2033
List of Tables
- Table 1: Global Confocal Raman Spectroscopy Market Revenue Million Forecast, by Type 2020 & 2033
- Table 2: Global Confocal Raman Spectroscopy Market Volume Million Forecast, by Type 2020 & 2033
- Table 3: Global Confocal Raman Spectroscopy Market Revenue Million Forecast, by End User 2020 & 2033
- Table 4: Global Confocal Raman Spectroscopy Market Volume Million Forecast, by End User 2020 & 2033
- Table 5: Global Confocal Raman Spectroscopy Market Revenue Million Forecast, by Region 2020 & 2033
- Table 6: Global Confocal Raman Spectroscopy Market Volume Million Forecast, by Region 2020 & 2033
- Table 7: Global Confocal Raman Spectroscopy Market Revenue Million Forecast, by Type 2020 & 2033
- Table 8: Global Confocal Raman Spectroscopy Market Volume Million Forecast, by Type 2020 & 2033
- Table 9: Global Confocal Raman Spectroscopy Market Revenue Million Forecast, by End User 2020 & 2033
- Table 10: Global Confocal Raman Spectroscopy Market Volume Million Forecast, by End User 2020 & 2033
- Table 11: Global Confocal Raman Spectroscopy Market Revenue Million Forecast, by Country 2020 & 2033
- Table 12: Global Confocal Raman Spectroscopy Market Volume Million Forecast, by Country 2020 & 2033
- Table 13: Global Confocal Raman Spectroscopy Market Revenue Million Forecast, by Type 2020 & 2033
- Table 14: Global Confocal Raman Spectroscopy Market Volume Million Forecast, by Type 2020 & 2033
- Table 15: Global Confocal Raman Spectroscopy Market Revenue Million Forecast, by End User 2020 & 2033
- Table 16: Global Confocal Raman Spectroscopy Market Volume Million Forecast, by End User 2020 & 2033
- Table 17: Global Confocal Raman Spectroscopy Market Revenue Million Forecast, by Country 2020 & 2033
- Table 18: Global Confocal Raman Spectroscopy Market Volume Million Forecast, by Country 2020 & 2033
- Table 19: Global Confocal Raman Spectroscopy Market Revenue Million Forecast, by Type 2020 & 2033
- Table 20: Global Confocal Raman Spectroscopy Market Volume Million Forecast, by Type 2020 & 2033
- Table 21: Global Confocal Raman Spectroscopy Market Revenue Million Forecast, by End User 2020 & 2033
- Table 22: Global Confocal Raman Spectroscopy Market Volume Million Forecast, by End User 2020 & 2033
- Table 23: Global Confocal Raman Spectroscopy Market Revenue Million Forecast, by Country 2020 & 2033
- Table 24: Global Confocal Raman Spectroscopy Market Volume Million Forecast, by Country 2020 & 2033
- Table 25: Global Confocal Raman Spectroscopy Market Revenue Million Forecast, by Type 2020 & 2033
- Table 26: Global Confocal Raman Spectroscopy Market Volume Million Forecast, by Type 2020 & 2033
- Table 27: Global Confocal Raman Spectroscopy Market Revenue Million Forecast, by End User 2020 & 2033
- Table 28: Global Confocal Raman Spectroscopy Market Volume Million Forecast, by End User 2020 & 2033
- Table 29: Global Confocal Raman Spectroscopy Market Revenue Million Forecast, by Country 2020 & 2033
- Table 30: Global Confocal Raman Spectroscopy Market Volume Million Forecast, by Country 2020 & 2033
- Table 31: Global Confocal Raman Spectroscopy Market Revenue Million Forecast, by Type 2020 & 2033
- Table 32: Global Confocal Raman Spectroscopy Market Volume Million Forecast, by Type 2020 & 2033
- Table 33: Global Confocal Raman Spectroscopy Market Revenue Million Forecast, by End User 2020 & 2033
- Table 34: Global Confocal Raman Spectroscopy Market Volume Million Forecast, by End User 2020 & 2033
- Table 35: Global Confocal Raman Spectroscopy Market Revenue Million Forecast, by Country 2020 & 2033
- Table 36: Global Confocal Raman Spectroscopy Market Volume Million Forecast, by Country 2020 & 2033
- Table 37: Global Confocal Raman Spectroscopy Market Revenue Million Forecast, by Type 2020 & 2033
- Table 38: Global Confocal Raman Spectroscopy Market Volume Million Forecast, by Type 2020 & 2033
- Table 39: Global Confocal Raman Spectroscopy Market Revenue Million Forecast, by End User 2020 & 2033
- Table 40: Global Confocal Raman Spectroscopy Market Volume Million Forecast, by End User 2020 & 2033
- Table 41: Global Confocal Raman Spectroscopy Market Revenue Million Forecast, by Country 2020 & 2033
- Table 42: Global Confocal Raman Spectroscopy Market Volume Million Forecast, by Country 2020 & 2033
Frequently Asked Questions
1. What is the projected Compound Annual Growth Rate (CAGR) of the Confocal Raman Spectroscopy Market?
The projected CAGR is approximately 8.00%.
2. Which companies are prominent players in the Confocal Raman Spectroscopy Market?
Key companies in the market include HORIBA Ltd, Rikagu Corporation, Agilent Technologies, Oxford Instruments, PerkinElmer Inc, Renishaw PLC, Bruker Corporation, Thermo Fisher Scientific Inc, Mettler Toledo, Hamamatsu Photonics KK*List Not Exhaustive.
3. What are the main segments of the Confocal Raman Spectroscopy Market?
The market segments include Type, End User.
4. Can you provide details about the market size?
The market size is estimated to be USD 551.12 Million as of 2022.
5. What are some drivers contributing to market growth?
Rising Investment Towards Drug Development; Growing Application in Forensic Science. Food Safety. and Gemology.
6. What are the notable trends driving market growth?
The Portable Segment is Driving Popularity.
7. Are there any restraints impacting market growth?
Rising Investment Towards Drug Development; Growing Application in Forensic Science. Food Safety. and Gemology.
8. Can you provide examples of recent developments in the market?
June 2024: The Shimadzu AIRsight Infrared/Raman Microscope revolutionized molecular analysis. By merging Fourier transform infrared (FTIR) and Raman spectroscopy into a single instrument, it equips researchers with a robust tool for in-depth sample examination. This innovation allows for the simultaneous acquisition of both spectra from a stationary sample, streamlining the process and enhancing the accuracy of technique correlation.February 2024: Brukar Corporation acquired Nanophoton Corporation, which is based in Osaka and boasts a diverse range of cutting-edge Raman microscopes, catering to both academic and industrial research, predominantly in Japan. This strategic move enhanced Bruker's molecular microscopy offerings. The company aims to promote Nanophoton's rapid, adaptable, and sensitive Raman systems globally across various fields, including life sciences, biopharma, advanced materials, semiconductors, and polymers.
9. What pricing options are available for accessing the report?
Pricing options include single-user, multi-user, and enterprise licenses priced at USD 4750, USD 5250, and USD 8750 respectively.
10. Is the market size provided in terms of value or volume?
The market size is provided in terms of value, measured in Million and volume, measured in Million.
11. Are there any specific market keywords associated with the report?
Yes, the market keyword associated with the report is "Confocal Raman Spectroscopy Market," which aids in identifying and referencing the specific market segment covered.
12. How do I determine which pricing option suits my needs best?
The pricing options vary based on user requirements and access needs. Individual users may opt for single-user licenses, while businesses requiring broader access may choose multi-user or enterprise licenses for cost-effective access to the report.
13. Are there any additional resources or data provided in the Confocal Raman Spectroscopy Market report?
While the report offers comprehensive insights, it's advisable to review the specific contents or supplementary materials provided to ascertain if additional resources or data are available.
14. How can I stay updated on further developments or reports in the Confocal Raman Spectroscopy Market?
To stay informed about further developments, trends, and reports in the Confocal Raman Spectroscopy Market, consider subscribing to industry newsletters, following relevant companies and organizations, or regularly checking reputable industry news sources and publications.
Methodology
Step 1 - Identification of Relevant Samples Size from Population Database


Step 2 - Approaches for Defining Global Market Size (Value, Volume* & Price*)

Note*: In applicable scenarios
Step 3 - Data Sources
Primary Research
- Web Analytics
- Survey Reports
- Research Institute
- Latest Research Reports
- Opinion Leaders
Secondary Research
- Annual Reports
- White Paper
- Latest Press Release
- Industry Association
- Paid Database
- Investor Presentations

Step 4 - Data Triangulation
Involves using different sources of information in order to increase the validity of a study
These sources are likely to be stakeholders in a program - participants, other researchers, program staff, other community members, and so on.
Then we put all data in single framework & apply various statistical tools to find out the dynamic on the market.
During the analysis stage, feedback from the stakeholder groups would be compared to determine areas of agreement as well as areas of divergence