

Key Insights
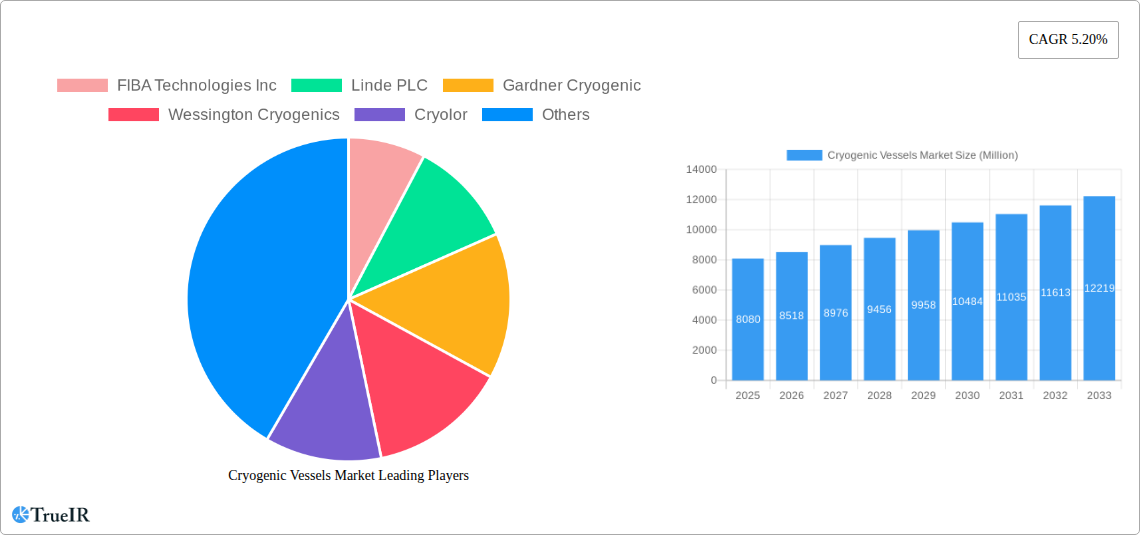
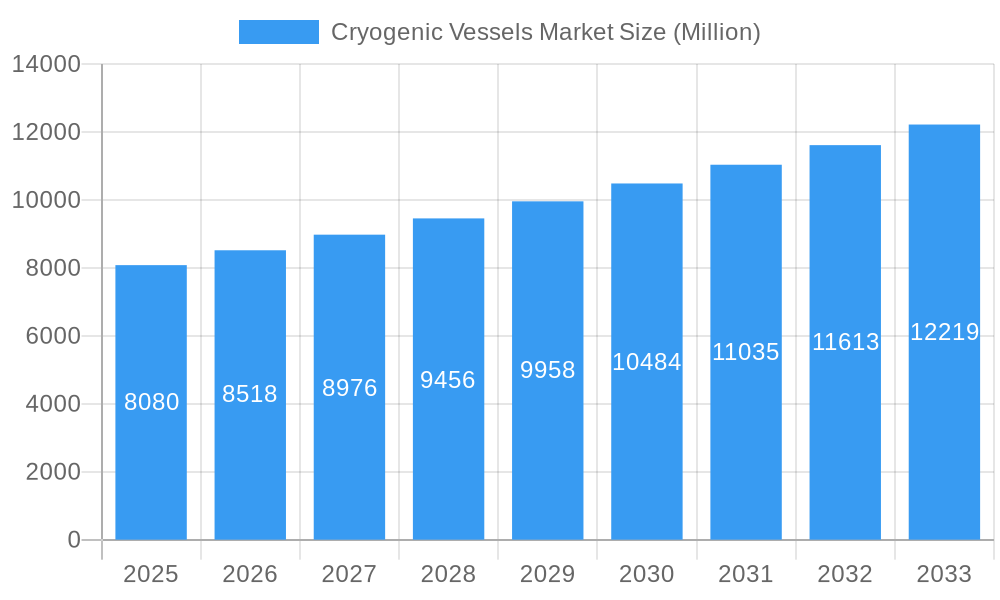
The global cryogenic vessels market, valued at $8.08 billion in 2025, is projected to experience robust growth, driven by increasing demand across diverse sectors. A compound annual growth rate (CAGR) of 5.20% from 2025 to 2033 indicates a significant expansion, fueled primarily by the energy generation sector's reliance on liquefied natural gas (LNG) storage and transportation. Advancements in materials science, particularly the development of high-strength, lightweight alloys like nickel and aluminum alloys, are contributing to improved vessel efficiency and reduced operational costs. Furthermore, the growing healthcare industry, with its increasing reliance on cryogenic preservation techniques for biological samples and medical treatments, is a major driver of market expansion. The market segmentation reveals a significant share held by LNG within the cryogenic liquids segment, underscoring the importance of the energy transition in fueling market growth. Steel continues to be a dominant raw material, though the adoption of advanced alloys is expected to increase gradually. The geographical distribution of the market shows strong growth potential in the Asia-Pacific region, driven by rapid industrialization and infrastructure development in countries like China and India.
Cryogenic Vessels Market Market Size (In Billion)
The restraints on market growth primarily include high initial investment costs for cryogenic vessels and the stringent safety regulations surrounding their handling and transportation. However, technological advancements in cryogenic vessel design and manufacturing, coupled with rising demand across various industries, are expected to mitigate these challenges. The development of more efficient and eco-friendly cryogenic vessels, along with ongoing research into novel materials, will further enhance market growth prospects. Competitive rivalry among established players and new entrants is also expected to spur innovation and drive down costs, further benefiting market expansion. Future growth will likely be influenced by government policies promoting cleaner energy sources and investments in infrastructure supporting cryogenic technologies. The continued development and adoption of cryogenic technologies in emerging applications, such as hydrogen energy storage and transportation, will play a crucial role in shaping the future landscape of this dynamic market.
Cryogenic Vessels Market Company Market Share
This comprehensive report provides a detailed analysis of the Cryogenic Vessels Market, offering invaluable insights for stakeholders across the industry. With a study period spanning 2019-2033, a base year of 2025, and a forecast period of 2025-2033, this report leverages extensive market research to deliver actionable intelligence. Covering key segments, competitive landscapes, and future trends, this report is essential for businesses seeking to navigate the dynamic cryogenic vessels market. The market is projected to reach xx Million by 2033.
Cryogenic Vessels Market Structure & Competitive Landscape
The Cryogenic Vessels Market is characterized by a moderately concentrated structure, with several key players holding significant market share. The Herfindahl-Hirschman Index (HHI) is estimated at xx, indicating a moderately consolidated market. Innovation plays a crucial role, driven by the increasing demand for efficient and sustainable cryogenic storage and transport solutions. Regulatory frameworks, particularly those focused on safety and environmental standards, heavily influence market dynamics. Steel remains the dominant raw material, although the adoption of advanced materials like nickel and aluminum alloys is increasing due to their superior properties at cryogenic temperatures. Substitute materials and technologies, although limited, are starting to emerge. The market witnesses both organic growth through product development and inorganic growth through mergers and acquisitions (M&A). The total M&A volume in the Cryogenic Vessels Market during the historical period (2019-2024) is estimated at xx Million. Key M&A trends include acquisitions of smaller specialized companies by larger players, aiming to expand product portfolios and geographical reach.
- Market Concentration: Moderately concentrated, with a HHI of xx.
- Innovation Drivers: Demand for efficient and sustainable cryogenic solutions.
- Regulatory Impact: Stringent safety and environmental regulations.
- Product Substitutes: Limited, but emerging technologies are creating potential substitutes.
- End-User Segmentation: Energy generation, healthcare, food & beverage, and metal processing are key segments.
- M&A Trends: Acquisitions of smaller companies to expand portfolios and market reach.
Cryogenic Vessels Market Market Trends & Opportunities
The Cryogenic Vessels Market exhibits significant growth potential, driven by increasing demand across various end-user industries. The market size is estimated at xx Million in 2025, projected to reach xx Million by 2033, exhibiting a Compound Annual Growth Rate (CAGR) of xx%. Technological advancements, particularly in materials science and cryogenic engineering, are creating opportunities for enhanced vessel designs with improved efficiency, safety, and durability. Consumer preference is shifting towards lighter, more efficient, and environmentally friendly cryogenic vessels. Competitive dynamics are characterized by innovation, pricing strategies, and geographical expansion. Market penetration rates vary significantly depending on the region and end-user industry. The adoption of cryogenic vessels is particularly strong in regions with established LNG infrastructure and developing healthcare sectors. The increasing adoption of renewable energy sources and the growth of cryogenic storage for green hydrogen are key drivers for market growth.
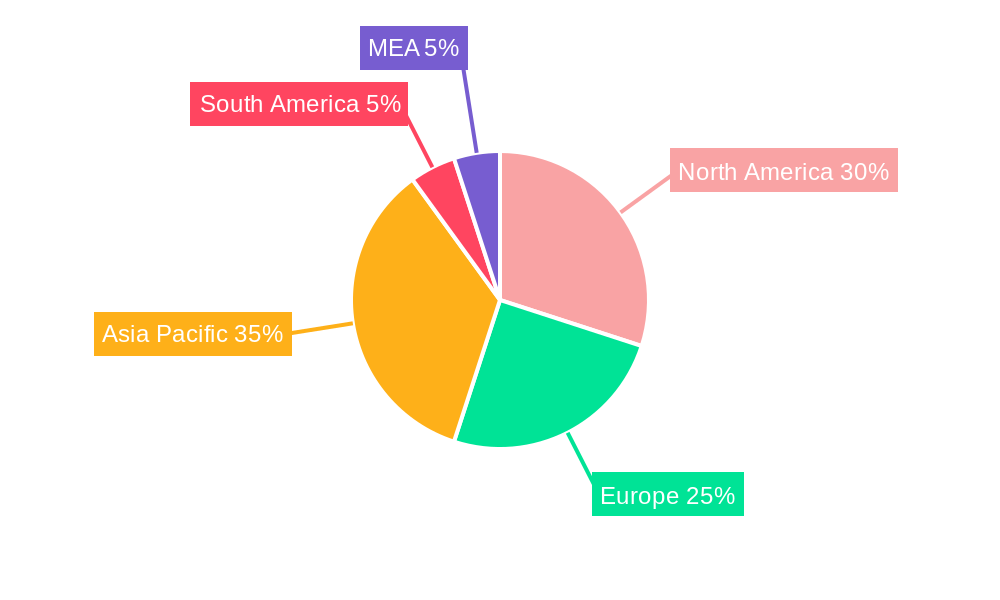
Dominant Markets & Segments in Cryogenic Vessels Market
The Asia-Pacific region is currently the dominant market for cryogenic vessels, driven by rapid industrialization and increasing energy consumption. Within this region, China and India are key growth markets. Among the segments, Liquid Nitrogen and Liquid Oxygen represent the largest portion of the cryogenic liquid market, with high demand driven by the medical, industrial gas, and food & beverage industries. Steel remains the leading raw material owing to its cost-effectiveness and availability. Storage applications dominate the overall market, with a significant portion of the vessels employed for LNG storage in the energy sector.
- Key Growth Drivers:
- Increasing energy demand.
- Expansion of healthcare facilities.
- Growing food & beverage industry.
- Government initiatives promoting renewable energy and green hydrogen storage.
- Regional Dominance: Asia-Pacific, particularly China and India.
- Segment Dominance: Liquid Nitrogen and Liquid Oxygen; Steel as the primary raw material; Storage as the primary application.
Cryogenic Vessels Market Product Analysis
Recent product innovations focus on improving efficiency, reducing weight, and enhancing safety features. Advancements in materials science have led to the development of lighter and more durable cryogenic vessels, minimizing transportation costs and enhancing operational efficiency. The market is witnessing increased adoption of vacuum-insulated vessels for better thermal performance and improved storage lifespan. These innovations offer competitive advantages, leading to better market fit and increased adoption rates across diverse applications.
Key Drivers, Barriers & Challenges in Cryogenic Vessels Market
Key Drivers: The increasing demand for cryogenic storage solutions in diverse industries (particularly LNG and green hydrogen) is a primary driver, supported by advancements in materials science enabling improved vessel designs. Government policies promoting renewable energy infrastructure further fuel growth.
Challenges: Regulatory complexities surrounding the transportation and handling of cryogenic liquids pose significant challenges. Supply chain disruptions, particularly related to raw materials like specialized steels and alloys, can impact production and delivery timelines. Intense competition and pricing pressures limit profitability for some market players.
Growth Drivers in the Cryogenic Vessels Market Market
The growth of LNG, hydrogen, and other cryogenic gas markets is boosting demand for storage and transport solutions. Technological advancements, like improved insulation techniques and materials, enhance vessel efficiency and safety. Favorable government regulations and policies supporting renewable energy and cryogenic infrastructure are creating significant growth opportunities.
Challenges Impacting Cryogenic Vessels Market Growth
Stringent safety and environmental regulations increase production costs and add complexity. Supply chain vulnerabilities, specifically regarding specialized materials, can disrupt production. The highly competitive market puts downward pressure on prices, potentially reducing profitability.
Key Players Shaping the Cryogenic Vessels Market Market
- FIBA Technologies Inc
- Linde PLC
- Gardner Cryogenic
- Wessington Cryogenics
- Cryolor
- Air Water Inc
- Cryofab Inc
- INOX India Ltd
- Chart Industries Inc
- ISISAN A S
Significant Cryogenic Vessels Market Industry Milestones
- March 2023: INOXCVA's new 30-acre manufacturing facility in Vadodara, India, significantly increases production capacity for cryogenic equipment.
- April 2023: The National Composites Centre's program to test composite cryogenic storage tanks in the UK, focused on liquid hydrogen storage, indicates a shift towards advanced materials.
Future Outlook for Cryogenic Vessels Market Market
The Cryogenic Vessels Market is poised for continued growth, driven by increasing demand for cryogenic fluids across various industries. Strategic investments in research and development, particularly focusing on lightweight and high-efficiency materials, will shape the future of the market. The growing adoption of renewable energy and green hydrogen technologies offers significant growth potential, creating opportunities for manufacturers to capitalize on the shift towards sustainable energy solutions. The market will continue to see intense competition, with innovation and cost optimization being crucial for success.
Cryogenic Vessels Market Segmentation
-
1. Application
- 1.1. Storage
- 1.2. Transport
-
2. End-User Industry
- 2.1. Energy Generation
- 2.2. Metal Processing
- 2.3. Healthcare
- 2.4. Food and Beverages
- 2.5. Other End-User Industries
-
3. Cryogenic Liquid
- 3.1. LNG
- 3.2. Liquid Nitrogen
- 3.3. Liquid Oxygen
- 3.4. Liquid Hydrogen
- 3.5. Other Cryogenic Liquids
-
4. Raw Material
- 4.1. Steel
- 4.2. Nickel Alloy
- 4.3. Aluminum Alloy
- 4.4. Other Raw Materials
Cryogenic Vessels Market Segmentation By Geography
-
1. North America
- 1.1. United States
- 1.2. Canada
- 1.3. Rest of North America
-
2. Europe
- 2.1. Germany
- 2.2. France
- 2.3. United Kingdom
- 2.4. Russia
- 2.5. Rest of Europe
-
3. Asia Pacific
- 3.1. China
- 3.2. India
- 3.3. Australia
- 3.4. Japan
- 3.5. Malaysia
- 3.6. Rest of Asia Pacific
-
4. Middle East and Africa
- 4.1. Saudi Arabia
- 4.2. UAE
- 4.3. Nigeria
- 4.4. South Africa
- 4.5. Rest of Middle East and Africa
-
5. South America
- 5.1. Brazil
- 5.2. Argentina
- 5.3. Chile
- 5.4. Rest of South America
Cryogenic Vessels Market Regional Market Share
Geographic Coverage of Cryogenic Vessels Market
Cryogenic Vessels Market REPORT HIGHLIGHTS
| Aspects | Details |
|---|---|
| Study Period | 2020-2034 |
| Base Year | 2025 |
| Estimated Year | 2026 |
| Forecast Period | 2026-2034 |
| Historical Period | 2020-2025 |
| Growth Rate | CAGR of 5.20% from 2020-2034 |
| Segmentation |
|
Table of Contents
- 1. Introduction
- 1.1. Research Scope
- 1.2. Market Segmentation
- 1.3. Research Objective
- 1.4. Definitions and Assumptions
- 2. Executive Summary
- 2.1. Market Snapshot
- 3. Market Dynamics
- 3.1. Market Drivers
- 3.2. Market Restrains
- 3.3. Market Trends
- 3.4. Market Opportunities
- 4. Market Factor Analysis
- 4.1. Porters Five Forces
- 4.1.1. Bargaining Power of Suppliers
- 4.1.2. Bargaining Power of Buyers
- 4.1.3. Threat of New Entrants
- 4.1.4. Threat of Substitutes
- 4.1.5. Competitive Rivalry
- 4.2. PESTEL analysis
- 4.3. BCG Analysis
- 4.3.1. Stars (High Growth, High Market Share)
- 4.3.2. Cash Cows (Low Growth, High Market Share)
- 4.3.3. Question Mark (High Growth, Low Market Share)
- 4.3.4. Dogs (Low Growth, Low Market Share)
- 4.4. Ansoff Matrix Analysis
- 4.5. Supply Chain Analysis
- 4.6. Regulatory Landscape
- 4.7. Current Market Potential and Opportunity Assessment (TAM–SAM–SOM Framework)
- 4.8. TIR Analyst Note
- 4.1. Porters Five Forces
- 5. Market Analysis, Insights and Forecast 2021-2033
- 5.1. Market Analysis, Insights and Forecast - by Application
- 5.1.1. Storage
- 5.1.2. Transport
- 5.2. Market Analysis, Insights and Forecast - by End-User Industry
- 5.2.1. Energy Generation
- 5.2.2. Metal Processing
- 5.2.3. Healthcare
- 5.2.4. Food and Beverages
- 5.2.5. Other End-User Industries
- 5.3. Market Analysis, Insights and Forecast - by Cryogenic Liquid
- 5.3.1. LNG
- 5.3.2. Liquid Nitrogen
- 5.3.3. Liquid Oxygen
- 5.3.4. Liquid Hydrogen
- 5.3.5. Other Cryogenic Liquids
- 5.4. Market Analysis, Insights and Forecast - by Raw Material
- 5.4.1. Steel
- 5.4.2. Nickel Alloy
- 5.4.3. Aluminum Alloy
- 5.4.4. Other Raw Materials
- 5.5. Market Analysis, Insights and Forecast - by Region
- 5.5.1. North America
- 5.5.2. Europe
- 5.5.3. Asia Pacific
- 5.5.4. Middle East and Africa
- 5.5.5. South America
- 5.1. Market Analysis, Insights and Forecast - by Application
- 6. Global Cryogenic Vessels Market Analysis, Insights and Forecast, 2021-2033
- 6.1. Market Analysis, Insights and Forecast - by Application
- 6.1.1. Storage
- 6.1.2. Transport
- 6.2. Market Analysis, Insights and Forecast - by End-User Industry
- 6.2.1. Energy Generation
- 6.2.2. Metal Processing
- 6.2.3. Healthcare
- 6.2.4. Food and Beverages
- 6.2.5. Other End-User Industries
- 6.3. Market Analysis, Insights and Forecast - by Cryogenic Liquid
- 6.3.1. LNG
- 6.3.2. Liquid Nitrogen
- 6.3.3. Liquid Oxygen
- 6.3.4. Liquid Hydrogen
- 6.3.5. Other Cryogenic Liquids
- 6.4. Market Analysis, Insights and Forecast - by Raw Material
- 6.4.1. Steel
- 6.4.2. Nickel Alloy
- 6.4.3. Aluminum Alloy
- 6.4.4. Other Raw Materials
- 6.1. Market Analysis, Insights and Forecast - by Application
- 7. North America Cryogenic Vessels Market Analysis, Insights and Forecast, 2020-2032
- 7.1. Market Analysis, Insights and Forecast - by Application
- 7.1.1. Storage
- 7.1.2. Transport
- 7.2. Market Analysis, Insights and Forecast - by End-User Industry
- 7.2.1. Energy Generation
- 7.2.2. Metal Processing
- 7.2.3. Healthcare
- 7.2.4. Food and Beverages
- 7.2.5. Other End-User Industries
- 7.3. Market Analysis, Insights and Forecast - by Cryogenic Liquid
- 7.3.1. LNG
- 7.3.2. Liquid Nitrogen
- 7.3.3. Liquid Oxygen
- 7.3.4. Liquid Hydrogen
- 7.3.5. Other Cryogenic Liquids
- 7.4. Market Analysis, Insights and Forecast - by Raw Material
- 7.4.1. Steel
- 7.4.2. Nickel Alloy
- 7.4.3. Aluminum Alloy
- 7.4.4. Other Raw Materials
- 7.1. Market Analysis, Insights and Forecast - by Application
- 8. Europe Cryogenic Vessels Market Analysis, Insights and Forecast, 2020-2032
- 8.1. Market Analysis, Insights and Forecast - by Application
- 8.1.1. Storage
- 8.1.2. Transport
- 8.2. Market Analysis, Insights and Forecast - by End-User Industry
- 8.2.1. Energy Generation
- 8.2.2. Metal Processing
- 8.2.3. Healthcare
- 8.2.4. Food and Beverages
- 8.2.5. Other End-User Industries
- 8.3. Market Analysis, Insights and Forecast - by Cryogenic Liquid
- 8.3.1. LNG
- 8.3.2. Liquid Nitrogen
- 8.3.3. Liquid Oxygen
- 8.3.4. Liquid Hydrogen
- 8.3.5. Other Cryogenic Liquids
- 8.4. Market Analysis, Insights and Forecast - by Raw Material
- 8.4.1. Steel
- 8.4.2. Nickel Alloy
- 8.4.3. Aluminum Alloy
- 8.4.4. Other Raw Materials
- 8.1. Market Analysis, Insights and Forecast - by Application
- 9. Asia Pacific Cryogenic Vessels Market Analysis, Insights and Forecast, 2020-2032
- 9.1. Market Analysis, Insights and Forecast - by Application
- 9.1.1. Storage
- 9.1.2. Transport
- 9.2. Market Analysis, Insights and Forecast - by End-User Industry
- 9.2.1. Energy Generation
- 9.2.2. Metal Processing
- 9.2.3. Healthcare
- 9.2.4. Food and Beverages
- 9.2.5. Other End-User Industries
- 9.3. Market Analysis, Insights and Forecast - by Cryogenic Liquid
- 9.3.1. LNG
- 9.3.2. Liquid Nitrogen
- 9.3.3. Liquid Oxygen
- 9.3.4. Liquid Hydrogen
- 9.3.5. Other Cryogenic Liquids
- 9.4. Market Analysis, Insights and Forecast - by Raw Material
- 9.4.1. Steel
- 9.4.2. Nickel Alloy
- 9.4.3. Aluminum Alloy
- 9.4.4. Other Raw Materials
- 9.1. Market Analysis, Insights and Forecast - by Application
- 10. Middle East and Africa Cryogenic Vessels Market Analysis, Insights and Forecast, 2020-2032
- 10.1. Market Analysis, Insights and Forecast - by Application
- 10.1.1. Storage
- 10.1.2. Transport
- 10.2. Market Analysis, Insights and Forecast - by End-User Industry
- 10.2.1. Energy Generation
- 10.2.2. Metal Processing
- 10.2.3. Healthcare
- 10.2.4. Food and Beverages
- 10.2.5. Other End-User Industries
- 10.3. Market Analysis, Insights and Forecast - by Cryogenic Liquid
- 10.3.1. LNG
- 10.3.2. Liquid Nitrogen
- 10.3.3. Liquid Oxygen
- 10.3.4. Liquid Hydrogen
- 10.3.5. Other Cryogenic Liquids
- 10.4. Market Analysis, Insights and Forecast - by Raw Material
- 10.4.1. Steel
- 10.4.2. Nickel Alloy
- 10.4.3. Aluminum Alloy
- 10.4.4. Other Raw Materials
- 10.1. Market Analysis, Insights and Forecast - by Application
- 11. South America Cryogenic Vessels Market Analysis, Insights and Forecast, 2020-2032
- 11.1. Market Analysis, Insights and Forecast - by Application
- 11.1.1. Storage
- 11.1.2. Transport
- 11.2. Market Analysis, Insights and Forecast - by End-User Industry
- 11.2.1. Energy Generation
- 11.2.2. Metal Processing
- 11.2.3. Healthcare
- 11.2.4. Food and Beverages
- 11.2.5. Other End-User Industries
- 11.3. Market Analysis, Insights and Forecast - by Cryogenic Liquid
- 11.3.1. LNG
- 11.3.2. Liquid Nitrogen
- 11.3.3. Liquid Oxygen
- 11.3.4. Liquid Hydrogen
- 11.3.5. Other Cryogenic Liquids
- 11.4. Market Analysis, Insights and Forecast - by Raw Material
- 11.4.1. Steel
- 11.4.2. Nickel Alloy
- 11.4.3. Aluminum Alloy
- 11.4.4. Other Raw Materials
- 11.1. Market Analysis, Insights and Forecast - by Application
- 12. Competitive Analysis
- 12.1. Company Profiles
- 12.1.1 FIBA Technologies Inc
- 12.1.1.1. Company Overview
- 12.1.1.2. Products
- 12.1.1.3. Company Financials
- 12.1.1.4. SWOT Analysis
- 12.1.2 Linde PLC
- 12.1.2.1. Company Overview
- 12.1.2.2. Products
- 12.1.2.3. Company Financials
- 12.1.2.4. SWOT Analysis
- 12.1.3 Gardner Cryogenic
- 12.1.3.1. Company Overview
- 12.1.3.2. Products
- 12.1.3.3. Company Financials
- 12.1.3.4. SWOT Analysis
- 12.1.4 Wessington Cryogenics
- 12.1.4.1. Company Overview
- 12.1.4.2. Products
- 12.1.4.3. Company Financials
- 12.1.4.4. SWOT Analysis
- 12.1.5 Cryolor
- 12.1.5.1. Company Overview
- 12.1.5.2. Products
- 12.1.5.3. Company Financials
- 12.1.5.4. SWOT Analysis
- 12.1.6 Air Water Inc
- 12.1.6.1. Company Overview
- 12.1.6.2. Products
- 12.1.6.3. Company Financials
- 12.1.6.4. SWOT Analysis
- 12.1.7 Cryofab Inc
- 12.1.7.1. Company Overview
- 12.1.7.2. Products
- 12.1.7.3. Company Financials
- 12.1.7.4. SWOT Analysis
- 12.1.8 INOX India Ltd
- 12.1.8.1. Company Overview
- 12.1.8.2. Products
- 12.1.8.3. Company Financials
- 12.1.8.4. SWOT Analysis
- 12.1.9 Chart Industries Inc
- 12.1.9.1. Company Overview
- 12.1.9.2. Products
- 12.1.9.3. Company Financials
- 12.1.9.4. SWOT Analysis
- 12.1.10 ISISAN A S
- 12.1.10.1. Company Overview
- 12.1.10.2. Products
- 12.1.10.3. Company Financials
- 12.1.10.4. SWOT Analysis
- 12.1.1 FIBA Technologies Inc
- 12.2. Market Entropy
- 12.2.1 Company's Key Areas Served
- 12.2.2 Recent Developments
- 12.3. Company Market Share Analysis 2025
- 12.3.1 Top 5 Companies Market Share Analysis
- 12.3.2 Top 3 Companies Market Share Analysis
- 12.4. List of Potential Customers
- 13. Research Methodology
List of Figures
- Figure 1: Global Cryogenic Vessels Market Revenue Breakdown (Million, %) by Region 2025 & 2033
- Figure 2: Global Cryogenic Vessels Market Volume Breakdown (K Unit, %) by Region 2025 & 2033
- Figure 3: North America Cryogenic Vessels Market Revenue (Million), by Application 2025 & 2033
- Figure 4: North America Cryogenic Vessels Market Volume (K Unit), by Application 2025 & 2033
- Figure 5: North America Cryogenic Vessels Market Revenue Share (%), by Application 2025 & 2033
- Figure 6: North America Cryogenic Vessels Market Volume Share (%), by Application 2025 & 2033
- Figure 7: North America Cryogenic Vessels Market Revenue (Million), by End-User Industry 2025 & 2033
- Figure 8: North America Cryogenic Vessels Market Volume (K Unit), by End-User Industry 2025 & 2033
- Figure 9: North America Cryogenic Vessels Market Revenue Share (%), by End-User Industry 2025 & 2033
- Figure 10: North America Cryogenic Vessels Market Volume Share (%), by End-User Industry 2025 & 2033
- Figure 11: North America Cryogenic Vessels Market Revenue (Million), by Cryogenic Liquid 2025 & 2033
- Figure 12: North America Cryogenic Vessels Market Volume (K Unit), by Cryogenic Liquid 2025 & 2033
- Figure 13: North America Cryogenic Vessels Market Revenue Share (%), by Cryogenic Liquid 2025 & 2033
- Figure 14: North America Cryogenic Vessels Market Volume Share (%), by Cryogenic Liquid 2025 & 2033
- Figure 15: North America Cryogenic Vessels Market Revenue (Million), by Raw Material 2025 & 2033
- Figure 16: North America Cryogenic Vessels Market Volume (K Unit), by Raw Material 2025 & 2033
- Figure 17: North America Cryogenic Vessels Market Revenue Share (%), by Raw Material 2025 & 2033
- Figure 18: North America Cryogenic Vessels Market Volume Share (%), by Raw Material 2025 & 2033
- Figure 19: North America Cryogenic Vessels Market Revenue (Million), by Country 2025 & 2033
- Figure 20: North America Cryogenic Vessels Market Volume (K Unit), by Country 2025 & 2033
- Figure 21: North America Cryogenic Vessels Market Revenue Share (%), by Country 2025 & 2033
- Figure 22: North America Cryogenic Vessels Market Volume Share (%), by Country 2025 & 2033
- Figure 23: Europe Cryogenic Vessels Market Revenue (Million), by Application 2025 & 2033
- Figure 24: Europe Cryogenic Vessels Market Volume (K Unit), by Application 2025 & 2033
- Figure 25: Europe Cryogenic Vessels Market Revenue Share (%), by Application 2025 & 2033
- Figure 26: Europe Cryogenic Vessels Market Volume Share (%), by Application 2025 & 2033
- Figure 27: Europe Cryogenic Vessels Market Revenue (Million), by End-User Industry 2025 & 2033
- Figure 28: Europe Cryogenic Vessels Market Volume (K Unit), by End-User Industry 2025 & 2033
- Figure 29: Europe Cryogenic Vessels Market Revenue Share (%), by End-User Industry 2025 & 2033
- Figure 30: Europe Cryogenic Vessels Market Volume Share (%), by End-User Industry 2025 & 2033
- Figure 31: Europe Cryogenic Vessels Market Revenue (Million), by Cryogenic Liquid 2025 & 2033
- Figure 32: Europe Cryogenic Vessels Market Volume (K Unit), by Cryogenic Liquid 2025 & 2033
- Figure 33: Europe Cryogenic Vessels Market Revenue Share (%), by Cryogenic Liquid 2025 & 2033
- Figure 34: Europe Cryogenic Vessels Market Volume Share (%), by Cryogenic Liquid 2025 & 2033
- Figure 35: Europe Cryogenic Vessels Market Revenue (Million), by Raw Material 2025 & 2033
- Figure 36: Europe Cryogenic Vessels Market Volume (K Unit), by Raw Material 2025 & 2033
- Figure 37: Europe Cryogenic Vessels Market Revenue Share (%), by Raw Material 2025 & 2033
- Figure 38: Europe Cryogenic Vessels Market Volume Share (%), by Raw Material 2025 & 2033
- Figure 39: Europe Cryogenic Vessels Market Revenue (Million), by Country 2025 & 2033
- Figure 40: Europe Cryogenic Vessels Market Volume (K Unit), by Country 2025 & 2033
- Figure 41: Europe Cryogenic Vessels Market Revenue Share (%), by Country 2025 & 2033
- Figure 42: Europe Cryogenic Vessels Market Volume Share (%), by Country 2025 & 2033
- Figure 43: Asia Pacific Cryogenic Vessels Market Revenue (Million), by Application 2025 & 2033
- Figure 44: Asia Pacific Cryogenic Vessels Market Volume (K Unit), by Application 2025 & 2033
- Figure 45: Asia Pacific Cryogenic Vessels Market Revenue Share (%), by Application 2025 & 2033
- Figure 46: Asia Pacific Cryogenic Vessels Market Volume Share (%), by Application 2025 & 2033
- Figure 47: Asia Pacific Cryogenic Vessels Market Revenue (Million), by End-User Industry 2025 & 2033
- Figure 48: Asia Pacific Cryogenic Vessels Market Volume (K Unit), by End-User Industry 2025 & 2033
- Figure 49: Asia Pacific Cryogenic Vessels Market Revenue Share (%), by End-User Industry 2025 & 2033
- Figure 50: Asia Pacific Cryogenic Vessels Market Volume Share (%), by End-User Industry 2025 & 2033
- Figure 51: Asia Pacific Cryogenic Vessels Market Revenue (Million), by Cryogenic Liquid 2025 & 2033
- Figure 52: Asia Pacific Cryogenic Vessels Market Volume (K Unit), by Cryogenic Liquid 2025 & 2033
- Figure 53: Asia Pacific Cryogenic Vessels Market Revenue Share (%), by Cryogenic Liquid 2025 & 2033
- Figure 54: Asia Pacific Cryogenic Vessels Market Volume Share (%), by Cryogenic Liquid 2025 & 2033
- Figure 55: Asia Pacific Cryogenic Vessels Market Revenue (Million), by Raw Material 2025 & 2033
- Figure 56: Asia Pacific Cryogenic Vessels Market Volume (K Unit), by Raw Material 2025 & 2033
- Figure 57: Asia Pacific Cryogenic Vessels Market Revenue Share (%), by Raw Material 2025 & 2033
- Figure 58: Asia Pacific Cryogenic Vessels Market Volume Share (%), by Raw Material 2025 & 2033
- Figure 59: Asia Pacific Cryogenic Vessels Market Revenue (Million), by Country 2025 & 2033
- Figure 60: Asia Pacific Cryogenic Vessels Market Volume (K Unit), by Country 2025 & 2033
- Figure 61: Asia Pacific Cryogenic Vessels Market Revenue Share (%), by Country 2025 & 2033
- Figure 62: Asia Pacific Cryogenic Vessels Market Volume Share (%), by Country 2025 & 2033
- Figure 63: Middle East and Africa Cryogenic Vessels Market Revenue (Million), by Application 2025 & 2033
- Figure 64: Middle East and Africa Cryogenic Vessels Market Volume (K Unit), by Application 2025 & 2033
- Figure 65: Middle East and Africa Cryogenic Vessels Market Revenue Share (%), by Application 2025 & 2033
- Figure 66: Middle East and Africa Cryogenic Vessels Market Volume Share (%), by Application 2025 & 2033
- Figure 67: Middle East and Africa Cryogenic Vessels Market Revenue (Million), by End-User Industry 2025 & 2033
- Figure 68: Middle East and Africa Cryogenic Vessels Market Volume (K Unit), by End-User Industry 2025 & 2033
- Figure 69: Middle East and Africa Cryogenic Vessels Market Revenue Share (%), by End-User Industry 2025 & 2033
- Figure 70: Middle East and Africa Cryogenic Vessels Market Volume Share (%), by End-User Industry 2025 & 2033
- Figure 71: Middle East and Africa Cryogenic Vessels Market Revenue (Million), by Cryogenic Liquid 2025 & 2033
- Figure 72: Middle East and Africa Cryogenic Vessels Market Volume (K Unit), by Cryogenic Liquid 2025 & 2033
- Figure 73: Middle East and Africa Cryogenic Vessels Market Revenue Share (%), by Cryogenic Liquid 2025 & 2033
- Figure 74: Middle East and Africa Cryogenic Vessels Market Volume Share (%), by Cryogenic Liquid 2025 & 2033
- Figure 75: Middle East and Africa Cryogenic Vessels Market Revenue (Million), by Raw Material 2025 & 2033
- Figure 76: Middle East and Africa Cryogenic Vessels Market Volume (K Unit), by Raw Material 2025 & 2033
- Figure 77: Middle East and Africa Cryogenic Vessels Market Revenue Share (%), by Raw Material 2025 & 2033
- Figure 78: Middle East and Africa Cryogenic Vessels Market Volume Share (%), by Raw Material 2025 & 2033
- Figure 79: Middle East and Africa Cryogenic Vessels Market Revenue (Million), by Country 2025 & 2033
- Figure 80: Middle East and Africa Cryogenic Vessels Market Volume (K Unit), by Country 2025 & 2033
- Figure 81: Middle East and Africa Cryogenic Vessels Market Revenue Share (%), by Country 2025 & 2033
- Figure 82: Middle East and Africa Cryogenic Vessels Market Volume Share (%), by Country 2025 & 2033
- Figure 83: South America Cryogenic Vessels Market Revenue (Million), by Application 2025 & 2033
- Figure 84: South America Cryogenic Vessels Market Volume (K Unit), by Application 2025 & 2033
- Figure 85: South America Cryogenic Vessels Market Revenue Share (%), by Application 2025 & 2033
- Figure 86: South America Cryogenic Vessels Market Volume Share (%), by Application 2025 & 2033
- Figure 87: South America Cryogenic Vessels Market Revenue (Million), by End-User Industry 2025 & 2033
- Figure 88: South America Cryogenic Vessels Market Volume (K Unit), by End-User Industry 2025 & 2033
- Figure 89: South America Cryogenic Vessels Market Revenue Share (%), by End-User Industry 2025 & 2033
- Figure 90: South America Cryogenic Vessels Market Volume Share (%), by End-User Industry 2025 & 2033
- Figure 91: South America Cryogenic Vessels Market Revenue (Million), by Cryogenic Liquid 2025 & 2033
- Figure 92: South America Cryogenic Vessels Market Volume (K Unit), by Cryogenic Liquid 2025 & 2033
- Figure 93: South America Cryogenic Vessels Market Revenue Share (%), by Cryogenic Liquid 2025 & 2033
- Figure 94: South America Cryogenic Vessels Market Volume Share (%), by Cryogenic Liquid 2025 & 2033
- Figure 95: South America Cryogenic Vessels Market Revenue (Million), by Raw Material 2025 & 2033
- Figure 96: South America Cryogenic Vessels Market Volume (K Unit), by Raw Material 2025 & 2033
- Figure 97: South America Cryogenic Vessels Market Revenue Share (%), by Raw Material 2025 & 2033
- Figure 98: South America Cryogenic Vessels Market Volume Share (%), by Raw Material 2025 & 2033
- Figure 99: South America Cryogenic Vessels Market Revenue (Million), by Country 2025 & 2033
- Figure 100: South America Cryogenic Vessels Market Volume (K Unit), by Country 2025 & 2033
- Figure 101: South America Cryogenic Vessels Market Revenue Share (%), by Country 2025 & 2033
- Figure 102: South America Cryogenic Vessels Market Volume Share (%), by Country 2025 & 2033
List of Tables
- Table 1: Global Cryogenic Vessels Market Revenue Million Forecast, by Application 2020 & 2033
- Table 2: Global Cryogenic Vessels Market Volume K Unit Forecast, by Application 2020 & 2033
- Table 3: Global Cryogenic Vessels Market Revenue Million Forecast, by End-User Industry 2020 & 2033
- Table 4: Global Cryogenic Vessels Market Volume K Unit Forecast, by End-User Industry 2020 & 2033
- Table 5: Global Cryogenic Vessels Market Revenue Million Forecast, by Cryogenic Liquid 2020 & 2033
- Table 6: Global Cryogenic Vessels Market Volume K Unit Forecast, by Cryogenic Liquid 2020 & 2033
- Table 7: Global Cryogenic Vessels Market Revenue Million Forecast, by Raw Material 2020 & 2033
- Table 8: Global Cryogenic Vessels Market Volume K Unit Forecast, by Raw Material 2020 & 2033
- Table 9: Global Cryogenic Vessels Market Revenue Million Forecast, by Region 2020 & 2033
- Table 10: Global Cryogenic Vessels Market Volume K Unit Forecast, by Region 2020 & 2033
- Table 11: Global Cryogenic Vessels Market Revenue Million Forecast, by Application 2020 & 2033
- Table 12: Global Cryogenic Vessels Market Volume K Unit Forecast, by Application 2020 & 2033
- Table 13: Global Cryogenic Vessels Market Revenue Million Forecast, by End-User Industry 2020 & 2033
- Table 14: Global Cryogenic Vessels Market Volume K Unit Forecast, by End-User Industry 2020 & 2033
- Table 15: Global Cryogenic Vessels Market Revenue Million Forecast, by Cryogenic Liquid 2020 & 2033
- Table 16: Global Cryogenic Vessels Market Volume K Unit Forecast, by Cryogenic Liquid 2020 & 2033
- Table 17: Global Cryogenic Vessels Market Revenue Million Forecast, by Raw Material 2020 & 2033
- Table 18: Global Cryogenic Vessels Market Volume K Unit Forecast, by Raw Material 2020 & 2033
- Table 19: Global Cryogenic Vessels Market Revenue Million Forecast, by Country 2020 & 2033
- Table 20: Global Cryogenic Vessels Market Volume K Unit Forecast, by Country 2020 & 2033
- Table 21: United States Cryogenic Vessels Market Revenue (Million) Forecast, by Application 2020 & 2033
- Table 22: United States Cryogenic Vessels Market Volume (K Unit) Forecast, by Application 2020 & 2033
- Table 23: Canada Cryogenic Vessels Market Revenue (Million) Forecast, by Application 2020 & 2033
- Table 24: Canada Cryogenic Vessels Market Volume (K Unit) Forecast, by Application 2020 & 2033
- Table 25: Rest of North America Cryogenic Vessels Market Revenue (Million) Forecast, by Application 2020 & 2033
- Table 26: Rest of North America Cryogenic Vessels Market Volume (K Unit) Forecast, by Application 2020 & 2033
- Table 27: Global Cryogenic Vessels Market Revenue Million Forecast, by Application 2020 & 2033
- Table 28: Global Cryogenic Vessels Market Volume K Unit Forecast, by Application 2020 & 2033
- Table 29: Global Cryogenic Vessels Market Revenue Million Forecast, by End-User Industry 2020 & 2033
- Table 30: Global Cryogenic Vessels Market Volume K Unit Forecast, by End-User Industry 2020 & 2033
- Table 31: Global Cryogenic Vessels Market Revenue Million Forecast, by Cryogenic Liquid 2020 & 2033
- Table 32: Global Cryogenic Vessels Market Volume K Unit Forecast, by Cryogenic Liquid 2020 & 2033
- Table 33: Global Cryogenic Vessels Market Revenue Million Forecast, by Raw Material 2020 & 2033
- Table 34: Global Cryogenic Vessels Market Volume K Unit Forecast, by Raw Material 2020 & 2033
- Table 35: Global Cryogenic Vessels Market Revenue Million Forecast, by Country 2020 & 2033
- Table 36: Global Cryogenic Vessels Market Volume K Unit Forecast, by Country 2020 & 2033
- Table 37: Germany Cryogenic Vessels Market Revenue (Million) Forecast, by Application 2020 & 2033
- Table 38: Germany Cryogenic Vessels Market Volume (K Unit) Forecast, by Application 2020 & 2033
- Table 39: France Cryogenic Vessels Market Revenue (Million) Forecast, by Application 2020 & 2033
- Table 40: France Cryogenic Vessels Market Volume (K Unit) Forecast, by Application 2020 & 2033
- Table 41: United Kingdom Cryogenic Vessels Market Revenue (Million) Forecast, by Application 2020 & 2033
- Table 42: United Kingdom Cryogenic Vessels Market Volume (K Unit) Forecast, by Application 2020 & 2033
- Table 43: Russia Cryogenic Vessels Market Revenue (Million) Forecast, by Application 2020 & 2033
- Table 44: Russia Cryogenic Vessels Market Volume (K Unit) Forecast, by Application 2020 & 2033
- Table 45: Rest of Europe Cryogenic Vessels Market Revenue (Million) Forecast, by Application 2020 & 2033
- Table 46: Rest of Europe Cryogenic Vessels Market Volume (K Unit) Forecast, by Application 2020 & 2033
- Table 47: Global Cryogenic Vessels Market Revenue Million Forecast, by Application 2020 & 2033
- Table 48: Global Cryogenic Vessels Market Volume K Unit Forecast, by Application 2020 & 2033
- Table 49: Global Cryogenic Vessels Market Revenue Million Forecast, by End-User Industry 2020 & 2033
- Table 50: Global Cryogenic Vessels Market Volume K Unit Forecast, by End-User Industry 2020 & 2033
- Table 51: Global Cryogenic Vessels Market Revenue Million Forecast, by Cryogenic Liquid 2020 & 2033
- Table 52: Global Cryogenic Vessels Market Volume K Unit Forecast, by Cryogenic Liquid 2020 & 2033
- Table 53: Global Cryogenic Vessels Market Revenue Million Forecast, by Raw Material 2020 & 2033
- Table 54: Global Cryogenic Vessels Market Volume K Unit Forecast, by Raw Material 2020 & 2033
- Table 55: Global Cryogenic Vessels Market Revenue Million Forecast, by Country 2020 & 2033
- Table 56: Global Cryogenic Vessels Market Volume K Unit Forecast, by Country 2020 & 2033
- Table 57: China Cryogenic Vessels Market Revenue (Million) Forecast, by Application 2020 & 2033
- Table 58: China Cryogenic Vessels Market Volume (K Unit) Forecast, by Application 2020 & 2033
- Table 59: India Cryogenic Vessels Market Revenue (Million) Forecast, by Application 2020 & 2033
- Table 60: India Cryogenic Vessels Market Volume (K Unit) Forecast, by Application 2020 & 2033
- Table 61: Australia Cryogenic Vessels Market Revenue (Million) Forecast, by Application 2020 & 2033
- Table 62: Australia Cryogenic Vessels Market Volume (K Unit) Forecast, by Application 2020 & 2033
- Table 63: Japan Cryogenic Vessels Market Revenue (Million) Forecast, by Application 2020 & 2033
- Table 64: Japan Cryogenic Vessels Market Volume (K Unit) Forecast, by Application 2020 & 2033
- Table 65: Malaysia Cryogenic Vessels Market Revenue (Million) Forecast, by Application 2020 & 2033
- Table 66: Malaysia Cryogenic Vessels Market Volume (K Unit) Forecast, by Application 2020 & 2033
- Table 67: Rest of Asia Pacific Cryogenic Vessels Market Revenue (Million) Forecast, by Application 2020 & 2033
- Table 68: Rest of Asia Pacific Cryogenic Vessels Market Volume (K Unit) Forecast, by Application 2020 & 2033
- Table 69: Global Cryogenic Vessels Market Revenue Million Forecast, by Application 2020 & 2033
- Table 70: Global Cryogenic Vessels Market Volume K Unit Forecast, by Application 2020 & 2033
- Table 71: Global Cryogenic Vessels Market Revenue Million Forecast, by End-User Industry 2020 & 2033
- Table 72: Global Cryogenic Vessels Market Volume K Unit Forecast, by End-User Industry 2020 & 2033
- Table 73: Global Cryogenic Vessels Market Revenue Million Forecast, by Cryogenic Liquid 2020 & 2033
- Table 74: Global Cryogenic Vessels Market Volume K Unit Forecast, by Cryogenic Liquid 2020 & 2033
- Table 75: Global Cryogenic Vessels Market Revenue Million Forecast, by Raw Material 2020 & 2033
- Table 76: Global Cryogenic Vessels Market Volume K Unit Forecast, by Raw Material 2020 & 2033
- Table 77: Global Cryogenic Vessels Market Revenue Million Forecast, by Country 2020 & 2033
- Table 78: Global Cryogenic Vessels Market Volume K Unit Forecast, by Country 2020 & 2033
- Table 79: Saudi Arabia Cryogenic Vessels Market Revenue (Million) Forecast, by Application 2020 & 2033
- Table 80: Saudi Arabia Cryogenic Vessels Market Volume (K Unit) Forecast, by Application 2020 & 2033
- Table 81: UAE Cryogenic Vessels Market Revenue (Million) Forecast, by Application 2020 & 2033
- Table 82: UAE Cryogenic Vessels Market Volume (K Unit) Forecast, by Application 2020 & 2033
- Table 83: Nigeria Cryogenic Vessels Market Revenue (Million) Forecast, by Application 2020 & 2033
- Table 84: Nigeria Cryogenic Vessels Market Volume (K Unit) Forecast, by Application 2020 & 2033
- Table 85: South Africa Cryogenic Vessels Market Revenue (Million) Forecast, by Application 2020 & 2033
- Table 86: South Africa Cryogenic Vessels Market Volume (K Unit) Forecast, by Application 2020 & 2033
- Table 87: Rest of Middle East and Africa Cryogenic Vessels Market Revenue (Million) Forecast, by Application 2020 & 2033
- Table 88: Rest of Middle East and Africa Cryogenic Vessels Market Volume (K Unit) Forecast, by Application 2020 & 2033
- Table 89: Global Cryogenic Vessels Market Revenue Million Forecast, by Application 2020 & 2033
- Table 90: Global Cryogenic Vessels Market Volume K Unit Forecast, by Application 2020 & 2033
- Table 91: Global Cryogenic Vessels Market Revenue Million Forecast, by End-User Industry 2020 & 2033
- Table 92: Global Cryogenic Vessels Market Volume K Unit Forecast, by End-User Industry 2020 & 2033
- Table 93: Global Cryogenic Vessels Market Revenue Million Forecast, by Cryogenic Liquid 2020 & 2033
- Table 94: Global Cryogenic Vessels Market Volume K Unit Forecast, by Cryogenic Liquid 2020 & 2033
- Table 95: Global Cryogenic Vessels Market Revenue Million Forecast, by Raw Material 2020 & 2033
- Table 96: Global Cryogenic Vessels Market Volume K Unit Forecast, by Raw Material 2020 & 2033
- Table 97: Global Cryogenic Vessels Market Revenue Million Forecast, by Country 2020 & 2033
- Table 98: Global Cryogenic Vessels Market Volume K Unit Forecast, by Country 2020 & 2033
- Table 99: Brazil Cryogenic Vessels Market Revenue (Million) Forecast, by Application 2020 & 2033
- Table 100: Brazil Cryogenic Vessels Market Volume (K Unit) Forecast, by Application 2020 & 2033
- Table 101: Argentina Cryogenic Vessels Market Revenue (Million) Forecast, by Application 2020 & 2033
- Table 102: Argentina Cryogenic Vessels Market Volume (K Unit) Forecast, by Application 2020 & 2033
- Table 103: Chile Cryogenic Vessels Market Revenue (Million) Forecast, by Application 2020 & 2033
- Table 104: Chile Cryogenic Vessels Market Volume (K Unit) Forecast, by Application 2020 & 2033
- Table 105: Rest of South America Cryogenic Vessels Market Revenue (Million) Forecast, by Application 2020 & 2033
- Table 106: Rest of South America Cryogenic Vessels Market Volume (K Unit) Forecast, by Application 2020 & 2033
Frequently Asked Questions
1. What is the projected Compound Annual Growth Rate (CAGR) of the Cryogenic Vessels Market?
The projected CAGR is approximately 5.20%.
2. Which companies are prominent players in the Cryogenic Vessels Market?
Key companies in the market include FIBA Technologies Inc, Linde PLC, Gardner Cryogenic, Wessington Cryogenics, Cryolor, Air Water Inc, Cryofab Inc, INOX India Ltd, Chart Industries Inc, ISISAN A S.
3. What are the main segments of the Cryogenic Vessels Market?
The market segments include Application, End-User Industry, Cryogenic Liquid, Raw Material.
4. Can you provide details about the market size?
The market size is estimated to be USD 8.08 Million as of 2022.
5. What are some drivers contributing to market growth?
4.; Increasing Demand for Liquefied Natural Gas (LNG).
6. What are the notable trends driving market growth?
Metal Processing Industry To Dominate The Market.
7. Are there any restraints impacting market growth?
4.; High Operational and Maintenance Costs.
8. Can you provide examples of recent developments in the market?
April 2023: The National Composites Centre (NCC), located in Bristol, U.K., unveiled a program dedicated to testing composite cryogenic storage tanks within the United Kingdom. This initiative aims to validate and expedite the capabilities to design, manufacture, and test such tanks. The program is projected to evaluate a linerless carbon fiber tank that stores liquid hydrogen (LH2).
9. What pricing options are available for accessing the report?
Pricing options include single-user, multi-user, and enterprise licenses priced at USD 4750, USD 5250, and USD 8750 respectively.
10. Is the market size provided in terms of value or volume?
The market size is provided in terms of value, measured in Million and volume, measured in K Unit.
11. Are there any specific market keywords associated with the report?
Yes, the market keyword associated with the report is "Cryogenic Vessels Market," which aids in identifying and referencing the specific market segment covered.
12. How do I determine which pricing option suits my needs best?
The pricing options vary based on user requirements and access needs. Individual users may opt for single-user licenses, while businesses requiring broader access may choose multi-user or enterprise licenses for cost-effective access to the report.
13. Are there any additional resources or data provided in the Cryogenic Vessels Market report?
While the report offers comprehensive insights, it's advisable to review the specific contents or supplementary materials provided to ascertain if additional resources or data are available.
14. How can I stay updated on further developments or reports in the Cryogenic Vessels Market?
To stay informed about further developments, trends, and reports in the Cryogenic Vessels Market, consider subscribing to industry newsletters, following relevant companies and organizations, or regularly checking reputable industry news sources and publications.
Methodology
Step 1 - Identification of Relevant Samples Size from Population Database


Step 2 - Approaches for Defining Global Market Size (Value, Volume* & Price*)

Note*: In applicable scenarios
Step 3 - Data Sources
Primary Research
- Web Analytics
- Survey Reports
- Research Institute
- Latest Research Reports
- Opinion Leaders
Secondary Research
- Annual Reports
- White Paper
- Latest Press Release
- Industry Association
- Paid Database
- Investor Presentations

Step 4 - Data Triangulation
Involves using different sources of information in order to increase the validity of a study
These sources are likely to be stakeholders in a program - participants, other researchers, program staff, other community members, and so on.
Then we put all data in single framework & apply various statistical tools to find out the dynamic on the market.
During the analysis stage, feedback from the stakeholder groups would be compared to determine areas of agreement as well as areas of divergence