

Key Insights
The display fingerprint technology market is poised for substantial expansion, driven by escalating demand for advanced smartphone security and an integrated user experience. The market, valued at 11.46 billion in the base year 2025, is projected to achieve a Compound Annual Growth Rate (CAGR) of 11.7% from 2025 to 2033. This robust growth trajectory is underpinned by several key drivers: the pervasive adoption of smartphones and mobile devices globally, the imperative for seamless integration in bezel-less mobile designs, and continuous technological advancements enhancing sensor accuracy, speed, and reliability. Both optical and ultrasonic sensor segments are expanding, with ultrasonic technology demonstrating notable traction due to superior performance in diverse conditions. Leading companies like Qualcomm, Synaptics, and Goodix are actively investing in research and development and forging strategic alliances. The Asia-Pacific region, led by China and India, is expected to maintain market dominance, while North America and Europe present significant growth potential fueled by consumer interest in sophisticated mobile security features.
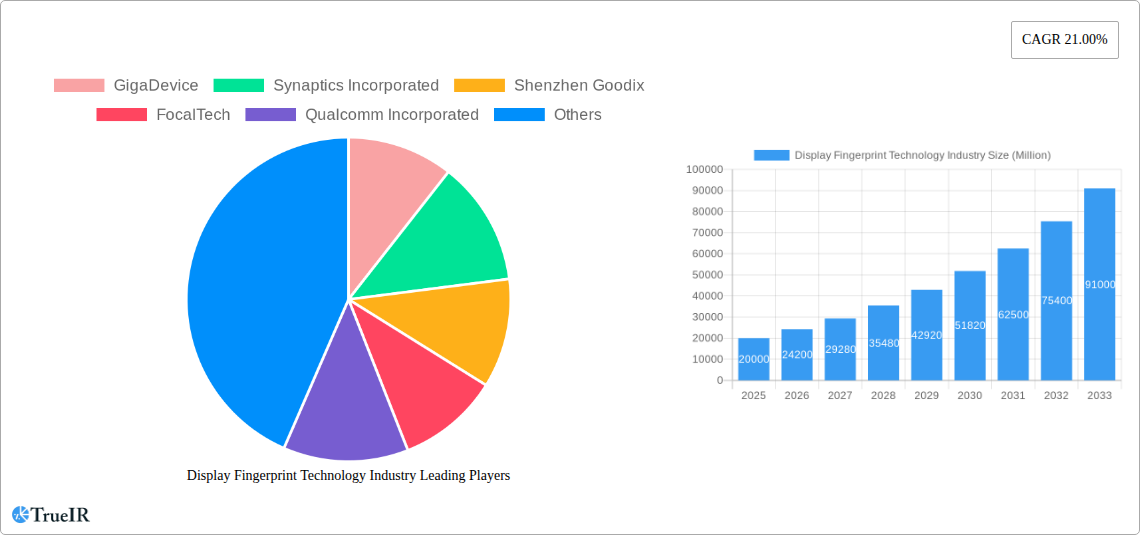
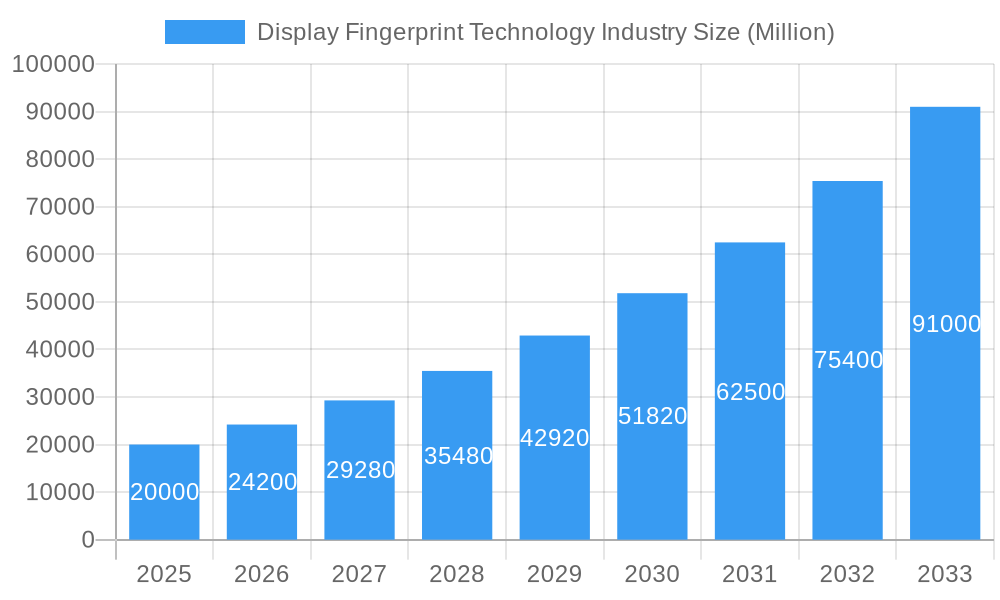
Display Fingerprint Technology Industry Market Size (In Billion)
Market growth faces challenges including higher manufacturing costs for integrated display fingerprint solutions and ongoing improvements in sensor accuracy and reliability. Segmentation by product type highlights the mobile phone segment as the primary growth engine, aligning with overall smartphone market trends. The competitive landscape is characterized by both established innovators and emerging players focused on technological advancements and OEM partnerships. The forecast period of 2025-2033 anticipates sustained robust growth, offering significant opportunities within the display fingerprint sensor industry.
Display Fingerprint Technology Industry Company Market Share
Display Fingerprint Technology Market Report: 2019-2033
This comprehensive report provides an in-depth analysis of the global display fingerprint technology market, offering valuable insights for stakeholders across the industry value chain. The report covers the period from 2019 to 2033, with a focus on the estimated year 2025 and a forecast period of 2025-2033. The market size is projected to reach xx Million by 2033, exhibiting a robust CAGR of xx% during the forecast period. This detailed analysis explores market segmentation by product type (Mobile, Notebook, Tablet) and technology type (Optical, Ultrasound), identifying key growth drivers, challenges, and opportunities.
Display Fingerprint Technology Industry Market Structure & Competitive Landscape
The display fingerprint technology market exhibits a moderately concentrated structure, with key players like GigaDevice, Synaptics Incorporated, Shenzhen Goodix, FocalTech, Qualcomm Incorporated, Fingerprint Cards AB, NEC Corporation, and Vkansee holding significant market shares. The Herfindahl-Hirschman Index (HHI) is estimated at xx, indicating a moderately concentrated market. Innovation is a crucial driver, with companies continuously investing in advanced technologies like ultrasonic and optical sensing. Regulatory landscapes, particularly concerning data privacy and security, significantly impact market growth. Product substitution, primarily from traditional fingerprint sensors and other biometric authentication methods, presents a challenge. The market witnesses significant end-user segmentation across mobile devices, laptops, and tablets, with mobile phones dominating. M&A activity in the sector has been moderate, with xx Million in deals recorded during the historical period (2019-2024), primarily focused on consolidating technology and expanding market reach.
- Market Concentration: HHI estimated at xx
- Innovation Drivers: Advanced sensor technologies, improved accuracy, and enhanced security features.
- Regulatory Impacts: Data privacy regulations and security standards influence adoption rates.
- Product Substitutes: Traditional fingerprint scanners, facial recognition, and other biometric technologies.
- End-User Segmentation: Mobile devices (largest segment), laptops, and tablets.
- M&A Trends: xx Million in M&A deals during 2019-2024.
Display Fingerprint Technology Industry Market Trends & Opportunities
The display fingerprint technology market is experiencing significant growth driven by several factors. The increasing adoption of smartphones and other mobile devices, coupled with rising consumer demand for enhanced security features, fuels market expansion. Technological advancements, particularly in miniaturization and improved accuracy of sensors, are key drivers. The shift towards bezel-less designs in mobile devices has further accelerated the adoption of in-display fingerprint sensors. Consumer preference for seamless user experiences and secure authentication methods contributes to strong market growth. Competitive dynamics are characterized by continuous innovation and price competition among key players. The market is projected to reach xx Million by 2033, with a CAGR of xx% from 2025 to 2033. Market penetration is expected to increase from xx% in 2025 to xx% by 2033. The growing adoption of in-display fingerprint sensors in notebooks and tablets presents a significant growth opportunity.
Dominant Markets & Segments in Display Fingerprint Technology Industry
The mobile segment dominates the display fingerprint technology market, accounting for approximately xx Million in revenue in 2025. Asia-Pacific is the leading region, driven by high smartphone penetration and strong demand from China and India. Optical sensors currently hold the largest market share by type, but ultrasound technology is expected to gain significant traction due to its improved performance in various conditions.
- Key Growth Drivers (Mobile Segment): High smartphone penetration, increasing demand for secure authentication, and technological advancements in miniaturization.
- Key Growth Drivers (Asia-Pacific Region): High smartphone adoption rates in China and India, increasing disposable income, and expanding e-commerce sector.
- Market Dominance Analysis: The mobile segment's dominance is driven by its large user base and the inherent need for secure authentication. The Asia-Pacific region benefits from its massive population and high smartphone adoption rates.
Display Fingerprint Technology Industry Product Analysis
Display fingerprint technology encompasses optical and ultrasonic sensors integrated directly into mobile device screens. Optical sensors utilize light to capture fingerprint images, while ultrasonic sensors employ sound waves to create 3D fingerprint maps, offering improved accuracy and performance in various conditions. Competitive advantages stem from factors like sensor accuracy, speed, reliability, and cost-effectiveness. Technological advancements focus on miniaturization, improved image processing, and enhanced security features. The market fit is largely dependent on the integration capabilities with existing mobile device designs and the overall cost-effectiveness of the technology.
Key Drivers, Barriers & Challenges in Display Fingerprint Technology Industry
Key Drivers:
- The increasing demand for secure authentication in mobile devices.
- Technological advancements leading to smaller, more accurate, and faster sensors.
- Growing adoption of bezel-less smartphone designs.
Challenges and Restraints:
- High manufacturing costs, particularly for advanced ultrasonic sensors.
- Supply chain disruptions impacting sensor availability and pricing.
- Security concerns related to data breaches and privacy violations. This has a quantifiable impact, potentially slowing adoption by xx% in sensitive sectors.
Growth Drivers in the Display Fingerprint Technology Industry Market
The market is driven by increasing demand for secure authentication in mobile devices and the integration of fingerprint sensors into screens. Technological advancements such as miniaturization and improved accuracy of sensors, along with favorable government policies promoting digital security, further contribute to growth. The expanding adoption of biometric authentication in various applications beyond mobile devices also fuels market expansion.
Challenges Impacting Display Fingerprint Technology Industry Growth
High manufacturing costs, supply chain vulnerabilities, and intense competition pose challenges to market growth. Concerns over data security and privacy also impact consumer adoption.
Key Players Shaping the Display Fingerprint Technology Industry Market
- GigaDevice
- Synaptics Incorporated
- Shenzhen Goodix
- FocalTech
- Qualcomm Incorporated
- Fingerprint Cards AB
- NEC Corporation
- Vkansee
Significant Display Fingerprint Technology Industry Milestones
- 2020: Qualcomm launches its first ultrasonic in-display fingerprint sensor.
- 2021: Synaptics introduces an improved optical in-display fingerprint sensor with enhanced security features.
- 2022: Several companies announce strategic partnerships to develop next-generation in-display fingerprint technologies.
Future Outlook for Display Fingerprint Technology Industry Market
The display fingerprint technology market is poised for continued growth driven by ongoing technological advancements, increased demand for secure authentication across various applications, and rising adoption in emerging markets. Strategic partnerships and collaborations among industry players will further accelerate innovation and market penetration. The market is expected to witness significant expansion in the coming years, creating lucrative opportunities for established players and new entrants alike.
Display Fingerprint Technology Industry Segmentation
-
1. Product Type
- 1.1. Mobile
- 1.2. Notebook
- 1.3. Tablet
-
2. Type
- 2.1. Optical
- 2.2. Ultrasound
Display Fingerprint Technology Industry Segmentation By Geography
- 1. North America
- 2. Europe
- 3. Asia Pacific
- 4. Rest of the World
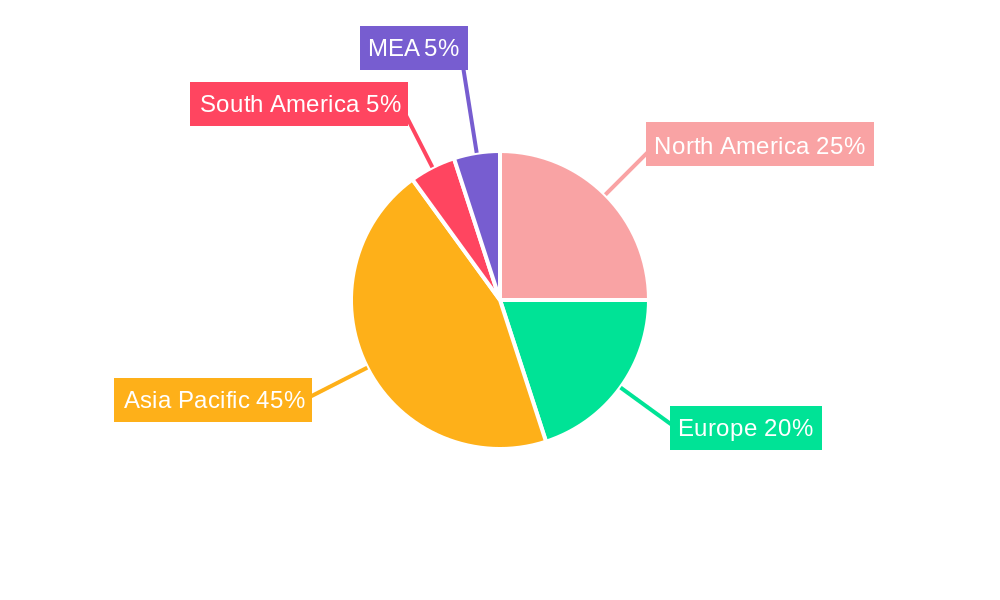
Display Fingerprint Technology Industry Regional Market Share
Geographic Coverage of Display Fingerprint Technology Industry
Display Fingerprint Technology Industry REPORT HIGHLIGHTS
| Aspects | Details |
|---|---|
| Study Period | 2020-2034 |
| Base Year | 2025 |
| Estimated Year | 2026 |
| Forecast Period | 2026-2034 |
| Historical Period | 2020-2025 |
| Growth Rate | CAGR of 11.7% from 2020-2034 |
| Segmentation |
|
Table of Contents
- 1. Introduction
- 1.1. Research Scope
- 1.2. Market Segmentation
- 1.3. Research Objective
- 1.4. Definitions and Assumptions
- 2. Executive Summary
- 2.1. Market Snapshot
- 3. Market Dynamics
- 3.1. Market Drivers
- 3.2. Market Restrains
- 3.3. Market Trends
- 3.4. Market Opportunities
- 4. Market Factor Analysis
- 4.1. Porters Five Forces
- 4.1.1. Bargaining Power of Suppliers
- 4.1.2. Bargaining Power of Buyers
- 4.1.3. Threat of New Entrants
- 4.1.4. Threat of Substitutes
- 4.1.5. Competitive Rivalry
- 4.2. PESTEL analysis
- 4.3. BCG Analysis
- 4.3.1. Stars (High Growth, High Market Share)
- 4.3.2. Cash Cows (Low Growth, High Market Share)
- 4.3.3. Question Mark (High Growth, Low Market Share)
- 4.3.4. Dogs (Low Growth, Low Market Share)
- 4.4. Ansoff Matrix Analysis
- 4.5. Supply Chain Analysis
- 4.6. Regulatory Landscape
- 4.7. Current Market Potential and Opportunity Assessment (TAM–SAM–SOM Framework)
- 4.8. TIR Analyst Note
- 4.1. Porters Five Forces
- 5. Market Analysis, Insights and Forecast 2021-2033
- 5.1. Market Analysis, Insights and Forecast - by Product Type
- 5.1.1. Mobile
- 5.1.2. Notebook
- 5.1.3. Tablet
- 5.2. Market Analysis, Insights and Forecast - by Type
- 5.2.1. Optical
- 5.2.2. Ultrasound
- 5.3. Market Analysis, Insights and Forecast - by Region
- 5.3.1. North America
- 5.3.2. Europe
- 5.3.3. Asia Pacific
- 5.3.4. Rest of the World
- 5.1. Market Analysis, Insights and Forecast - by Product Type
- 6. Global Display Fingerprint Technology Industry Analysis, Insights and Forecast, 2021-2033
- 6.1. Market Analysis, Insights and Forecast - by Product Type
- 6.1.1. Mobile
- 6.1.2. Notebook
- 6.1.3. Tablet
- 6.2. Market Analysis, Insights and Forecast - by Type
- 6.2.1. Optical
- 6.2.2. Ultrasound
- 6.1. Market Analysis, Insights and Forecast - by Product Type
- 7. North America Display Fingerprint Technology Industry Analysis, Insights and Forecast, 2020-2032
- 7.1. Market Analysis, Insights and Forecast - by Product Type
- 7.1.1. Mobile
- 7.1.2. Notebook
- 7.1.3. Tablet
- 7.2. Market Analysis, Insights and Forecast - by Type
- 7.2.1. Optical
- 7.2.2. Ultrasound
- 7.1. Market Analysis, Insights and Forecast - by Product Type
- 8. Europe Display Fingerprint Technology Industry Analysis, Insights and Forecast, 2020-2032
- 8.1. Market Analysis, Insights and Forecast - by Product Type
- 8.1.1. Mobile
- 8.1.2. Notebook
- 8.1.3. Tablet
- 8.2. Market Analysis, Insights and Forecast - by Type
- 8.2.1. Optical
- 8.2.2. Ultrasound
- 8.1. Market Analysis, Insights and Forecast - by Product Type
- 9. Asia Pacific Display Fingerprint Technology Industry Analysis, Insights and Forecast, 2020-2032
- 9.1. Market Analysis, Insights and Forecast - by Product Type
- 9.1.1. Mobile
- 9.1.2. Notebook
- 9.1.3. Tablet
- 9.2. Market Analysis, Insights and Forecast - by Type
- 9.2.1. Optical
- 9.2.2. Ultrasound
- 9.1. Market Analysis, Insights and Forecast - by Product Type
- 10. Rest of the World Display Fingerprint Technology Industry Analysis, Insights and Forecast, 2020-2032
- 10.1. Market Analysis, Insights and Forecast - by Product Type
- 10.1.1. Mobile
- 10.1.2. Notebook
- 10.1.3. Tablet
- 10.2. Market Analysis, Insights and Forecast - by Type
- 10.2.1. Optical
- 10.2.2. Ultrasound
- 10.1. Market Analysis, Insights and Forecast - by Product Type
- 11. Competitive Analysis
- 11.1. Company Profiles
- 11.1.1 GigaDevice
- 11.1.1.1. Company Overview
- 11.1.1.2. Products
- 11.1.1.3. Company Financials
- 11.1.1.4. SWOT Analysis
- 11.1.2 Synaptics Incorporated
- 11.1.2.1. Company Overview
- 11.1.2.2. Products
- 11.1.2.3. Company Financials
- 11.1.2.4. SWOT Analysis
- 11.1.3 Shenzhen Goodix
- 11.1.3.1. Company Overview
- 11.1.3.2. Products
- 11.1.3.3. Company Financials
- 11.1.3.4. SWOT Analysis
- 11.1.4 FocalTech
- 11.1.4.1. Company Overview
- 11.1.4.2. Products
- 11.1.4.3. Company Financials
- 11.1.4.4. SWOT Analysis
- 11.1.5 Qualcomm Incorporated
- 11.1.5.1. Company Overview
- 11.1.5.2. Products
- 11.1.5.3. Company Financials
- 11.1.5.4. SWOT Analysis
- 11.1.6 Fingerprint Cards AB
- 11.1.6.1. Company Overview
- 11.1.6.2. Products
- 11.1.6.3. Company Financials
- 11.1.6.4. SWOT Analysis
- 11.1.7 NEC Corporation
- 11.1.7.1. Company Overview
- 11.1.7.2. Products
- 11.1.7.3. Company Financials
- 11.1.7.4. SWOT Analysis
- 11.1.8 Vkansee
- 11.1.8.1. Company Overview
- 11.1.8.2. Products
- 11.1.8.3. Company Financials
- 11.1.8.4. SWOT Analysis
- 11.1.1 GigaDevice
- 11.2. Market Entropy
- 11.2.1 Company's Key Areas Served
- 11.2.2 Recent Developments
- 11.3. Company Market Share Analysis 2025
- 11.3.1 Top 5 Companies Market Share Analysis
- 11.3.2 Top 3 Companies Market Share Analysis
- 11.4. List of Potential Customers
- 12. Research Methodology
List of Figures
- Figure 1: Global Display Fingerprint Technology Industry Revenue Breakdown (billion, %) by Region 2025 & 2033
- Figure 2: North America Display Fingerprint Technology Industry Revenue (billion), by Product Type 2025 & 2033
- Figure 3: North America Display Fingerprint Technology Industry Revenue Share (%), by Product Type 2025 & 2033
- Figure 4: North America Display Fingerprint Technology Industry Revenue (billion), by Type 2025 & 2033
- Figure 5: North America Display Fingerprint Technology Industry Revenue Share (%), by Type 2025 & 2033
- Figure 6: North America Display Fingerprint Technology Industry Revenue (billion), by Country 2025 & 2033
- Figure 7: North America Display Fingerprint Technology Industry Revenue Share (%), by Country 2025 & 2033
- Figure 8: Europe Display Fingerprint Technology Industry Revenue (billion), by Product Type 2025 & 2033
- Figure 9: Europe Display Fingerprint Technology Industry Revenue Share (%), by Product Type 2025 & 2033
- Figure 10: Europe Display Fingerprint Technology Industry Revenue (billion), by Type 2025 & 2033
- Figure 11: Europe Display Fingerprint Technology Industry Revenue Share (%), by Type 2025 & 2033
- Figure 12: Europe Display Fingerprint Technology Industry Revenue (billion), by Country 2025 & 2033
- Figure 13: Europe Display Fingerprint Technology Industry Revenue Share (%), by Country 2025 & 2033
- Figure 14: Asia Pacific Display Fingerprint Technology Industry Revenue (billion), by Product Type 2025 & 2033
- Figure 15: Asia Pacific Display Fingerprint Technology Industry Revenue Share (%), by Product Type 2025 & 2033
- Figure 16: Asia Pacific Display Fingerprint Technology Industry Revenue (billion), by Type 2025 & 2033
- Figure 17: Asia Pacific Display Fingerprint Technology Industry Revenue Share (%), by Type 2025 & 2033
- Figure 18: Asia Pacific Display Fingerprint Technology Industry Revenue (billion), by Country 2025 & 2033
- Figure 19: Asia Pacific Display Fingerprint Technology Industry Revenue Share (%), by Country 2025 & 2033
- Figure 20: Rest of the World Display Fingerprint Technology Industry Revenue (billion), by Product Type 2025 & 2033
- Figure 21: Rest of the World Display Fingerprint Technology Industry Revenue Share (%), by Product Type 2025 & 2033
- Figure 22: Rest of the World Display Fingerprint Technology Industry Revenue (billion), by Type 2025 & 2033
- Figure 23: Rest of the World Display Fingerprint Technology Industry Revenue Share (%), by Type 2025 & 2033
- Figure 24: Rest of the World Display Fingerprint Technology Industry Revenue (billion), by Country 2025 & 2033
- Figure 25: Rest of the World Display Fingerprint Technology Industry Revenue Share (%), by Country 2025 & 2033
List of Tables
- Table 1: Global Display Fingerprint Technology Industry Revenue billion Forecast, by Product Type 2020 & 2033
- Table 2: Global Display Fingerprint Technology Industry Revenue billion Forecast, by Type 2020 & 2033
- Table 3: Global Display Fingerprint Technology Industry Revenue billion Forecast, by Region 2020 & 2033
- Table 4: Global Display Fingerprint Technology Industry Revenue billion Forecast, by Product Type 2020 & 2033
- Table 5: Global Display Fingerprint Technology Industry Revenue billion Forecast, by Type 2020 & 2033
- Table 6: Global Display Fingerprint Technology Industry Revenue billion Forecast, by Country 2020 & 2033
- Table 7: Global Display Fingerprint Technology Industry Revenue billion Forecast, by Product Type 2020 & 2033
- Table 8: Global Display Fingerprint Technology Industry Revenue billion Forecast, by Type 2020 & 2033
- Table 9: Global Display Fingerprint Technology Industry Revenue billion Forecast, by Country 2020 & 2033
- Table 10: Global Display Fingerprint Technology Industry Revenue billion Forecast, by Product Type 2020 & 2033
- Table 11: Global Display Fingerprint Technology Industry Revenue billion Forecast, by Type 2020 & 2033
- Table 12: Global Display Fingerprint Technology Industry Revenue billion Forecast, by Country 2020 & 2033
- Table 13: Global Display Fingerprint Technology Industry Revenue billion Forecast, by Product Type 2020 & 2033
- Table 14: Global Display Fingerprint Technology Industry Revenue billion Forecast, by Type 2020 & 2033
- Table 15: Global Display Fingerprint Technology Industry Revenue billion Forecast, by Country 2020 & 2033
Frequently Asked Questions
1. What is the projected Compound Annual Growth Rate (CAGR) of the Display Fingerprint Technology Industry?
The projected CAGR is approximately 11.7%.
2. Which companies are prominent players in the Display Fingerprint Technology Industry?
Key companies in the market include GigaDevice, Synaptics Incorporated, Shenzhen Goodix, FocalTech, Qualcomm Incorporated, Fingerprint Cards AB, NEC Corporation, Vkansee.
3. What are the main segments of the Display Fingerprint Technology Industry?
The market segments include Product Type, Type.
4. Can you provide details about the market size?
The market size is estimated to be USD 11.46 billion as of 2022.
5. What are some drivers contributing to market growth?
; Increasing Demand for Ease of Convenience to use the Device; Increasing Security Awareness.
6. What are the notable trends driving market growth?
optical under-display sensors.
7. Are there any restraints impacting market growth?
; In-display Fingerprints are Comparatively Slow Compared to Conventional Fingerprint Sensors.
8. Can you provide examples of recent developments in the market?
N/A
9. What pricing options are available for accessing the report?
Pricing options include single-user, multi-user, and enterprise licenses priced at USD 4750, USD 5250, and USD 8750 respectively.
10. Is the market size provided in terms of value or volume?
The market size is provided in terms of value, measured in billion.
11. Are there any specific market keywords associated with the report?
Yes, the market keyword associated with the report is "Display Fingerprint Technology Industry," which aids in identifying and referencing the specific market segment covered.
12. How do I determine which pricing option suits my needs best?
The pricing options vary based on user requirements and access needs. Individual users may opt for single-user licenses, while businesses requiring broader access may choose multi-user or enterprise licenses for cost-effective access to the report.
13. Are there any additional resources or data provided in the Display Fingerprint Technology Industry report?
While the report offers comprehensive insights, it's advisable to review the specific contents or supplementary materials provided to ascertain if additional resources or data are available.
14. How can I stay updated on further developments or reports in the Display Fingerprint Technology Industry?
To stay informed about further developments, trends, and reports in the Display Fingerprint Technology Industry, consider subscribing to industry newsletters, following relevant companies and organizations, or regularly checking reputable industry news sources and publications.
Methodology
Step 1 - Identification of Relevant Samples Size from Population Database


Step 2 - Approaches for Defining Global Market Size (Value, Volume* & Price*)

Note*: In applicable scenarios
Step 3 - Data Sources
Primary Research
- Web Analytics
- Survey Reports
- Research Institute
- Latest Research Reports
- Opinion Leaders
Secondary Research
- Annual Reports
- White Paper
- Latest Press Release
- Industry Association
- Paid Database
- Investor Presentations

Step 4 - Data Triangulation
Involves using different sources of information in order to increase the validity of a study
These sources are likely to be stakeholders in a program - participants, other researchers, program staff, other community members, and so on.
Then we put all data in single framework & apply various statistical tools to find out the dynamic on the market.
During the analysis stage, feedback from the stakeholder groups would be compared to determine areas of agreement as well as areas of divergence