

Key Insights
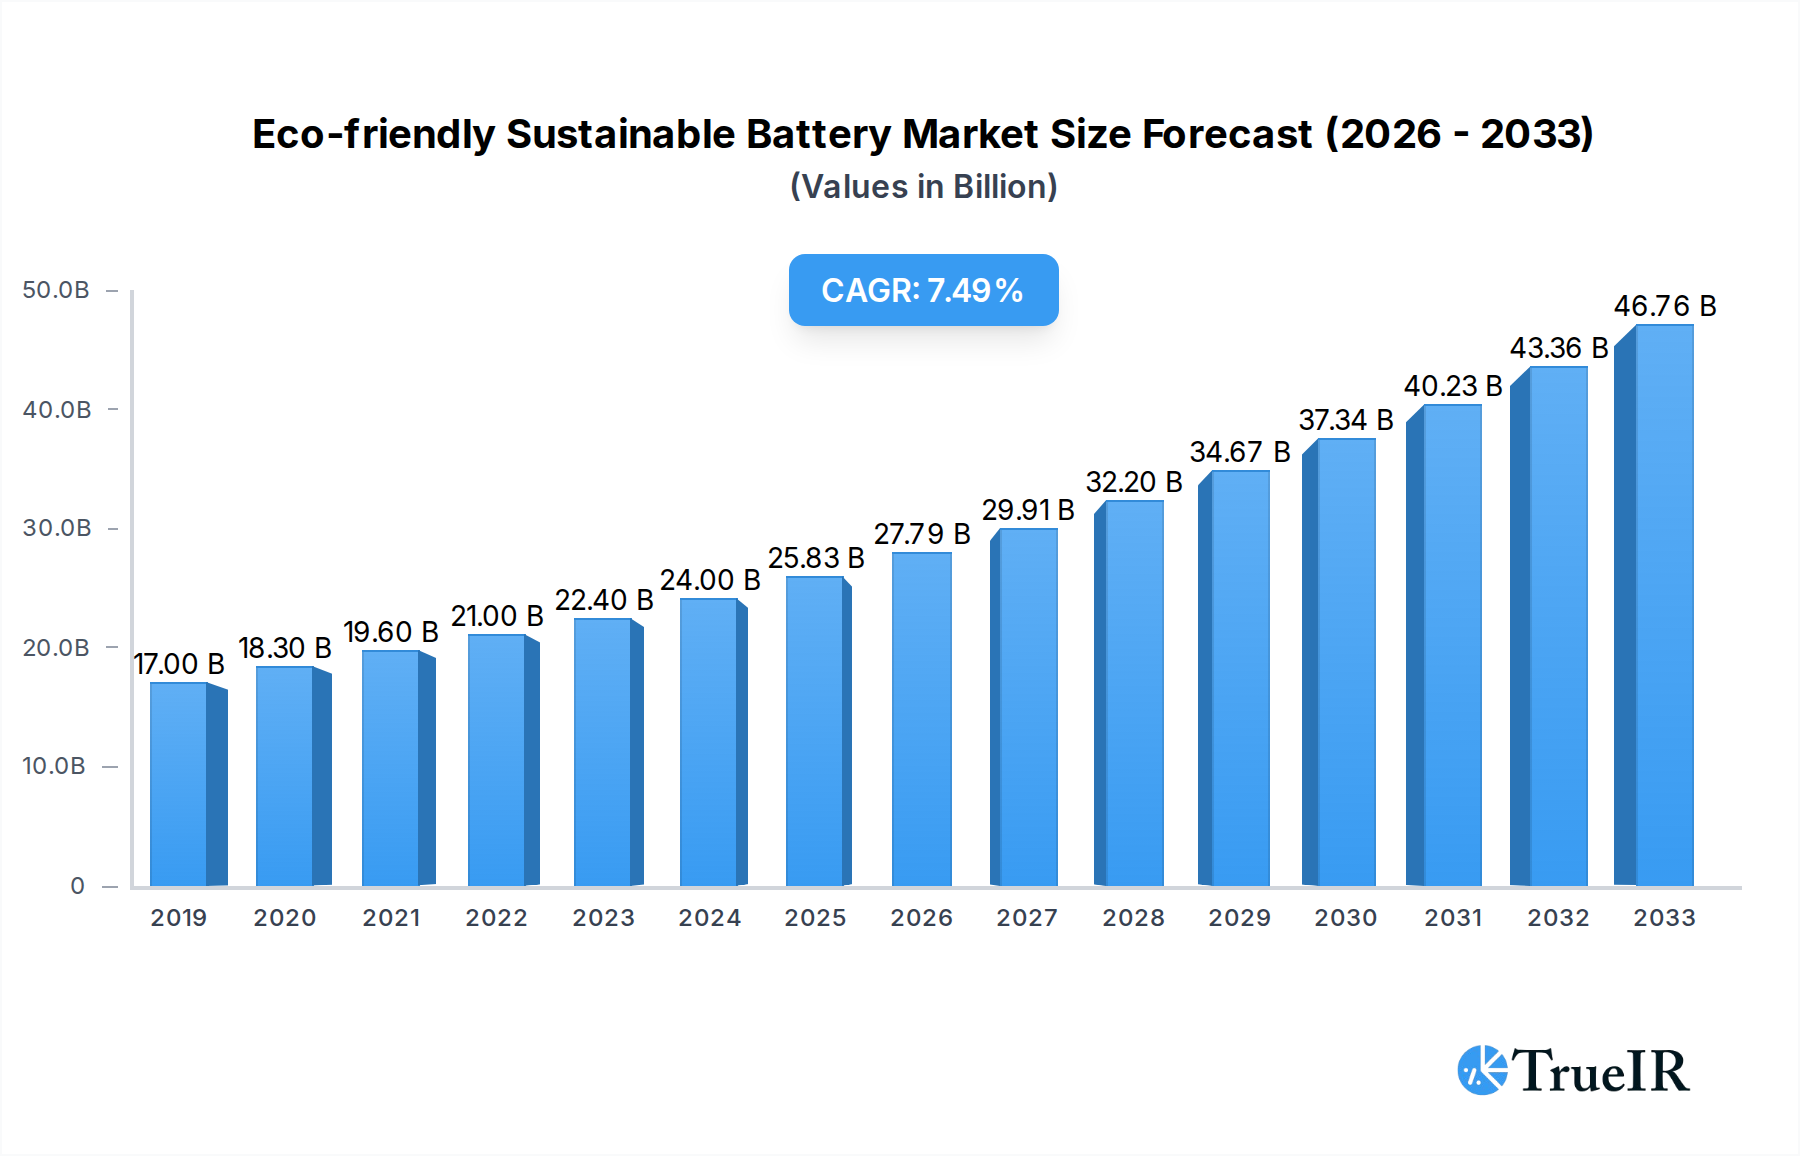
The Eco-friendly Sustainable Battery market is experiencing robust growth, projected to reach $25,830 million by 2025, with a Compound Annual Growth Rate (CAGR) of 7.6% from 2019 to 2033. This substantial expansion is primarily driven by the increasing global demand for cleaner energy solutions, stringent environmental regulations, and the rapid adoption of electric vehicles (EVs). Key applications driving this growth include the utility sector, where grid-scale energy storage is crucial for integrating renewable sources, and the consumer electronics market, which is witnessing a surge in demand for longer-lasting and more sustainable power solutions. The widespread adoption of lithium-ion batteries, alongside the development of next-generation technologies like nickel-metal hydride batteries and solar cells, are further propelling market expansion. Geographically, the Asia Pacific region, particularly China and India, is expected to lead the market due to significant investments in renewable energy infrastructure and manufacturing capabilities. North America and Europe are also major contributors, driven by supportive government policies and growing consumer awareness regarding sustainability.

Eco-friendly Sustainable Battery Market Size (In Billion)
Despite the overwhelmingly positive outlook, the market faces certain restraints. These include the high initial cost of advanced sustainable battery technologies, challenges in battery recycling and disposal infrastructure, and the fluctuating prices of raw materials essential for battery production, such as lithium and cobalt. However, ongoing research and development efforts aimed at improving battery efficiency, reducing costs through innovative manufacturing processes, and establishing comprehensive recycling programs are expected to mitigate these challenges. Trends such as the development of solid-state batteries, advancements in battery management systems for enhanced performance and safety, and the growing focus on circular economy principles within the battery value chain are shaping the future landscape. The competitive landscape is marked by the presence of major players like A123 Systems, TESLA, BYD Company, Contemporary Amperex Technology, LG CHEM, and Panasonic, all actively investing in innovation and strategic collaborations to capture market share.
Eco-friendly Sustainable Battery Company Market Share
Eco-friendly Sustainable Battery Market: A Comprehensive Industry Analysis (2019-2033)
This in-depth report provides a strategic analysis of the global eco-friendly sustainable battery market, offering unparalleled insights for stakeholders looking to navigate this rapidly evolving landscape. Leveraging high-volume keywords and detailed data, this report is your definitive guide to understanding market dynamics, competitive strategies, and future growth trajectories. The study period spans from 2019 to 2033, with a base and estimated year of 2025, followed by a forecast period of 2025–2033 and a historical period from 2019–2024.
Eco-friendly Sustainable Battery Market Structure & Competitive Landscape
The eco-friendly sustainable battery market exhibits a dynamic and evolving structure, characterized by a moderate level of concentration. Key players are investing heavily in research and development, driving innovation in battery chemistries, charging technologies, and recycling processes. Regulatory frameworks are increasingly influencing market entry and operational strategies, with a growing emphasis on lifecycle management and reduced environmental impact. Product substitutes, while present, are largely being outpaced by advancements in sustainable battery technologies, particularly lithium-ion and emerging solid-state solutions. End-user segmentation reveals significant growth across Utility, Electric Vehicles (EVs), and Consumer Electronics, each presenting unique demand drivers and application requirements. Mergers and acquisitions (M&A) activity is anticipated to rise as larger entities seek to consolidate market share, acquire proprietary technologies, and secure critical raw material supply chains. For instance, an estimated volume of over 50 significant M&A deals are projected within the study period, indicating robust consolidation efforts. Furthermore, the concentration ratio among the top five players is estimated to be around 55%, suggesting a competitive yet manageable market landscape.
Eco-friendly Sustainable Battery Market Trends & Opportunities
The global eco-friendly sustainable battery market is poised for exceptional growth, projected to reach over $500 million in market size by 2033. This expansion is fueled by a confluence of technological advancements, escalating environmental consciousness, and supportive government policies worldwide. The dominant trend is the accelerated adoption of electric vehicles (EVs), which are fundamentally reshaping the automotive industry and, consequently, the demand for high-performance, sustainable battery solutions. The continuous innovation in lithium-ion battery technology, including improvements in energy density, faster charging capabilities, and enhanced safety features, is a significant growth catalyst. Furthermore, the development of next-generation battery chemistries, such as solid-state batteries, sodium-ion batteries, and flow batteries, promises to unlock new performance benchmarks and address current limitations, offering substantial opportunities for early adopters and technology developers.
Consumer preferences are increasingly tilting towards environmentally friendly products, driving demand for sustainable energy storage solutions across various applications. This heightened awareness is creating a fertile ground for the proliferation of renewable energy storage systems, grid-scale battery installations, and portable electronics with eco-conscious power sources. The increasing integration of renewable energy sources like solar and wind power into the grid necessitates robust and efficient battery storage solutions to ensure grid stability and reliability, thereby presenting a substantial market opportunity for utility-scale battery deployments.
The competitive dynamics are intensifying, with both established players and emerging startups vying for market leadership. Strategic partnerships and collaborations are becoming paramount for companies to leverage complementary strengths, access new markets, and accelerate product development. The circular economy is also emerging as a critical trend, with a growing focus on battery recycling and second-life applications. This shift towards sustainable lifecycle management not only reduces environmental impact but also creates new business models and revenue streams within the battery ecosystem. The market penetration rate for EVs, currently at approximately 15% globally, is projected to surpass 50% by 2033, underscoring the immense growth potential within this segment. The Compound Annual Growth Rate (CAGR) for the overall market is estimated at a robust 22.5% over the forecast period, highlighting the significant upward trajectory.
Dominant Markets & Segments in Eco-friendly Sustainable Battery
The eco-friendly sustainable battery market demonstrates significant dominance in specific regions and segments, driven by a complex interplay of economic, policy, and technological factors.
Dominant Region: Asia-Pacific currently leads the global market for eco-friendly sustainable batteries, driven by the massive manufacturing capabilities, substantial government incentives for electric vehicle adoption, and a burgeoning demand for consumer electronics and renewable energy integration. China, in particular, plays a pivotal role as a major producer and consumer of battery technologies.
Dominant Application: Electric Vehicles (EVs) represent the most dominant application segment for eco-friendly sustainable batteries. The rapid global transition towards electric mobility, spurred by environmental regulations and consumer demand for sustainable transportation, has created an insatiable appetite for high-capacity, reliable, and cost-effective EV batteries. Over $300 million in annual investment is channeled into EV battery research and development alone.
Dominant Type: Lithium-ion batteries are the undisputed leaders in the eco-friendly sustainable battery market. Their superior energy density, long cycle life, and declining costs have made them the preferred choice for a wide array of applications, from portable electronics to electric vehicles and grid storage. The market share for lithium-ion batteries is estimated to be over 80% of the total market.
Key Growth Drivers in EVs:
- Government Subsidies and Tax Credits: Incentives play a crucial role in making EVs more affordable for consumers.
- Stringent Emission Regulations: Mandates to reduce carbon footprints are pushing automakers towards electrification.
- Expanding Charging Infrastructure: The growing availability of charging stations is alleviating range anxiety.
- Falling Battery Costs: Economies of scale and technological advancements are making batteries more cost-competitive.
Key Growth Drivers in Utility Applications:
- Grid Modernization and Renewable Energy Integration: Batteries are essential for storing intermittent renewable energy.
- Peak Shaving and Load Balancing: Utilities are using batteries to manage demand fluctuations and reduce strain on the grid.
- Energy Security and Resilience: Battery storage enhances grid reliability during outages.
Key Growth Drivers in Consumer Electronics:
- Demand for Longer Battery Life: Consumers expect devices to last longer on a single charge.
- Miniaturization and Portability: Advanced battery technologies enable smaller and lighter electronic devices.
- Growth of Wearable Technology: Smartwatches and other wearables rely heavily on compact, high-performance batteries.
Eco-friendly Sustainable Battery Product Analysis
The eco-friendly sustainable battery market is characterized by continuous product innovation, focusing on enhanced performance, safety, and environmental sustainability. Lithium-ion battery technology remains at the forefront, with ongoing advancements in cathode and anode materials, as well as electrolyte formulations, leading to higher energy densities and faster charging capabilities. Emerging technologies like solid-state batteries promise breakthrough improvements in safety and energy storage, offering a significant competitive advantage for early developers. The competitive advantage lies in achieving a balance between cost-effectiveness, performance metrics, and a reduced environmental footprint throughout the battery's lifecycle, including responsible sourcing of raw materials and efficient recycling processes.
Key Drivers, Barriers & Challenges in Eco-friendly Sustainable Battery
Key Drivers: The eco-friendly sustainable battery market is propelled by several key drivers. Technological advancements, particularly in lithium-ion and emerging battery chemistries, are improving performance and reducing costs. Economic factors, such as government incentives and subsidies for EVs and renewable energy, are stimulating demand. Policy-driven initiatives, including stringent emission standards and renewable energy mandates, are creating a favorable regulatory environment. For example, the global average EV subsidy reached over $5,000 in 2023, significantly boosting adoption rates.
Barriers & Challenges: Despite the positive outlook, the market faces significant challenges. Supply chain vulnerabilities, particularly concerning critical raw materials like lithium, cobalt, and nickel, pose a risk to production volumes and price stability. Over 60% of the global lithium supply is concentrated in a few countries, creating potential geopolitical risks. Regulatory hurdles in terms of battery recycling standards and end-of-life management can slow down market adoption. Furthermore, intense competitive pressures from established players and new entrants can lead to pricing wars and impact profit margins. The initial high capital expenditure for utility-scale battery installations remains a barrier for some markets.
Growth Drivers in the Eco-friendly Sustainable Battery Market
The eco-friendly sustainable battery market is experiencing robust growth driven by several interconnected factors. Technologically, continuous innovation in energy density, charging speed, and lifespan of lithium-ion batteries, alongside the promise of solid-state and other next-generation chemistries, is fueling adoption. Economically, declining battery production costs, coupled with government incentives like tax credits for electric vehicles and renewable energy projects, make sustainable battery solutions increasingly attractive. Regulatory drivers, such as stricter emission standards and government commitments to decarbonization targets, are mandating the transition towards cleaner energy storage. For instance, the projected over $200 million in annual global government funding for battery research and development signifies a strong commitment to fostering this growth.
Challenges Impacting Eco-friendly Sustainable Battery Growth
The growth of the eco-friendly sustainable battery market is not without its hurdles. Significant challenges include the volatility of raw material prices and supply chain constraints for critical elements like lithium, cobalt, and nickel, which are essential for battery production. Over 70% of global cobalt production, for example, is concentrated in the Democratic Republic of Congo, creating supply chain risks. Regulatory complexities surrounding battery disposal, recycling, and safety standards can also create barriers to entry and market expansion. Competitive pressures from both established manufacturers and emerging players can lead to price wars and impact profitability. Furthermore, the substantial upfront capital investment required for utility-scale battery projects can be a deterrent in some developing economies.
Key Players Shaping the Eco-friendly Sustainable Battery Market
- A123 Systems
- American Manganese
- BenAn Energy Technology
- Blue Solutions Canada
- TESLA
- BYD Company
- Cell-Con
- Contemporary Amperex Technology
- Cymbet Corporation
- Automotive Energy Supply Corporation
- Faradion
- Fluence Energy
- Itochu
- LG CHEM
- Mitsubishi Corporation
- NantEnergy
- NEC Energy Solutions
- NGK Insulators
- Panasonic
- Primus Power
- Samsung SDI
- Toshiba International
- VRB Energy
Significant Eco-friendly Sustainable Battery Industry Milestones
- 2019: Introduction of advanced lithium-ion battery chemistries with increased energy density by several leading manufacturers.
- 2020: Major automotive companies announce aggressive electrification targets, significantly boosting demand for EV batteries.
- 2021: Breakthroughs in solid-state battery research promise enhanced safety and performance, garnering significant investment.
- 2022: Global increase in battery recycling initiatives and the development of more efficient recycling technologies.
- 2023: Launch of new battery gigafactories by major players, aimed at scaling up production to meet growing demand.
- 2024: Increased focus on ethical sourcing of raw materials and sustainable supply chains within the battery industry.
Future Outlook for Eco-friendly Sustainable Battery Market
The future outlook for the eco-friendly sustainable battery market is exceptionally bright, driven by sustained innovation, expanding applications, and a global commitment to sustainability. Growth catalysts include the continued exponential rise in electric vehicle adoption, the increasing integration of renewable energy sources necessitating robust grid-scale storage solutions, and the proliferation of advanced consumer electronics. Strategic opportunities lie in the development and commercialization of next-generation battery technologies like solid-state and sodium-ion batteries, which promise enhanced performance and reduced environmental impact. The burgeoning market for battery recycling and second-life applications also presents significant potential for circular economy business models. With an estimated market size projected to surpass $750 million by 2033, the industry is poised for sustained growth and transformative impact.
Eco-friendly Sustainable Battery Segmentation
-
1. Application
- 1.1. Utility
- 1.2. Consumer Electronics
- 1.3. Electric Vehicles (EVs)
- 1.4. Others
-
2. Types
- 2.1. Nickel Metal Hydride Battery
- 2.2. Lithium-ion Battery
- 2.3. Solar Cell
- 2.4. Others
Eco-friendly Sustainable Battery Segmentation By Geography
-
1. North America
- 1.1. United States
- 1.2. Canada
- 1.3. Mexico
-
2. South America
- 2.1. Brazil
- 2.2. Argentina
- 2.3. Rest of South America
-
3. Europe
- 3.1. United Kingdom
- 3.2. Germany
- 3.3. France
- 3.4. Italy
- 3.5. Spain
- 3.6. Russia
- 3.7. Benelux
- 3.8. Nordics
- 3.9. Rest of Europe
-
4. Middle East & Africa
- 4.1. Turkey
- 4.2. Israel
- 4.3. GCC
- 4.4. North Africa
- 4.5. South Africa
- 4.6. Rest of Middle East & Africa
-
5. Asia Pacific
- 5.1. China
- 5.2. India
- 5.3. Japan
- 5.4. South Korea
- 5.5. ASEAN
- 5.6. Oceania
- 5.7. Rest of Asia Pacific
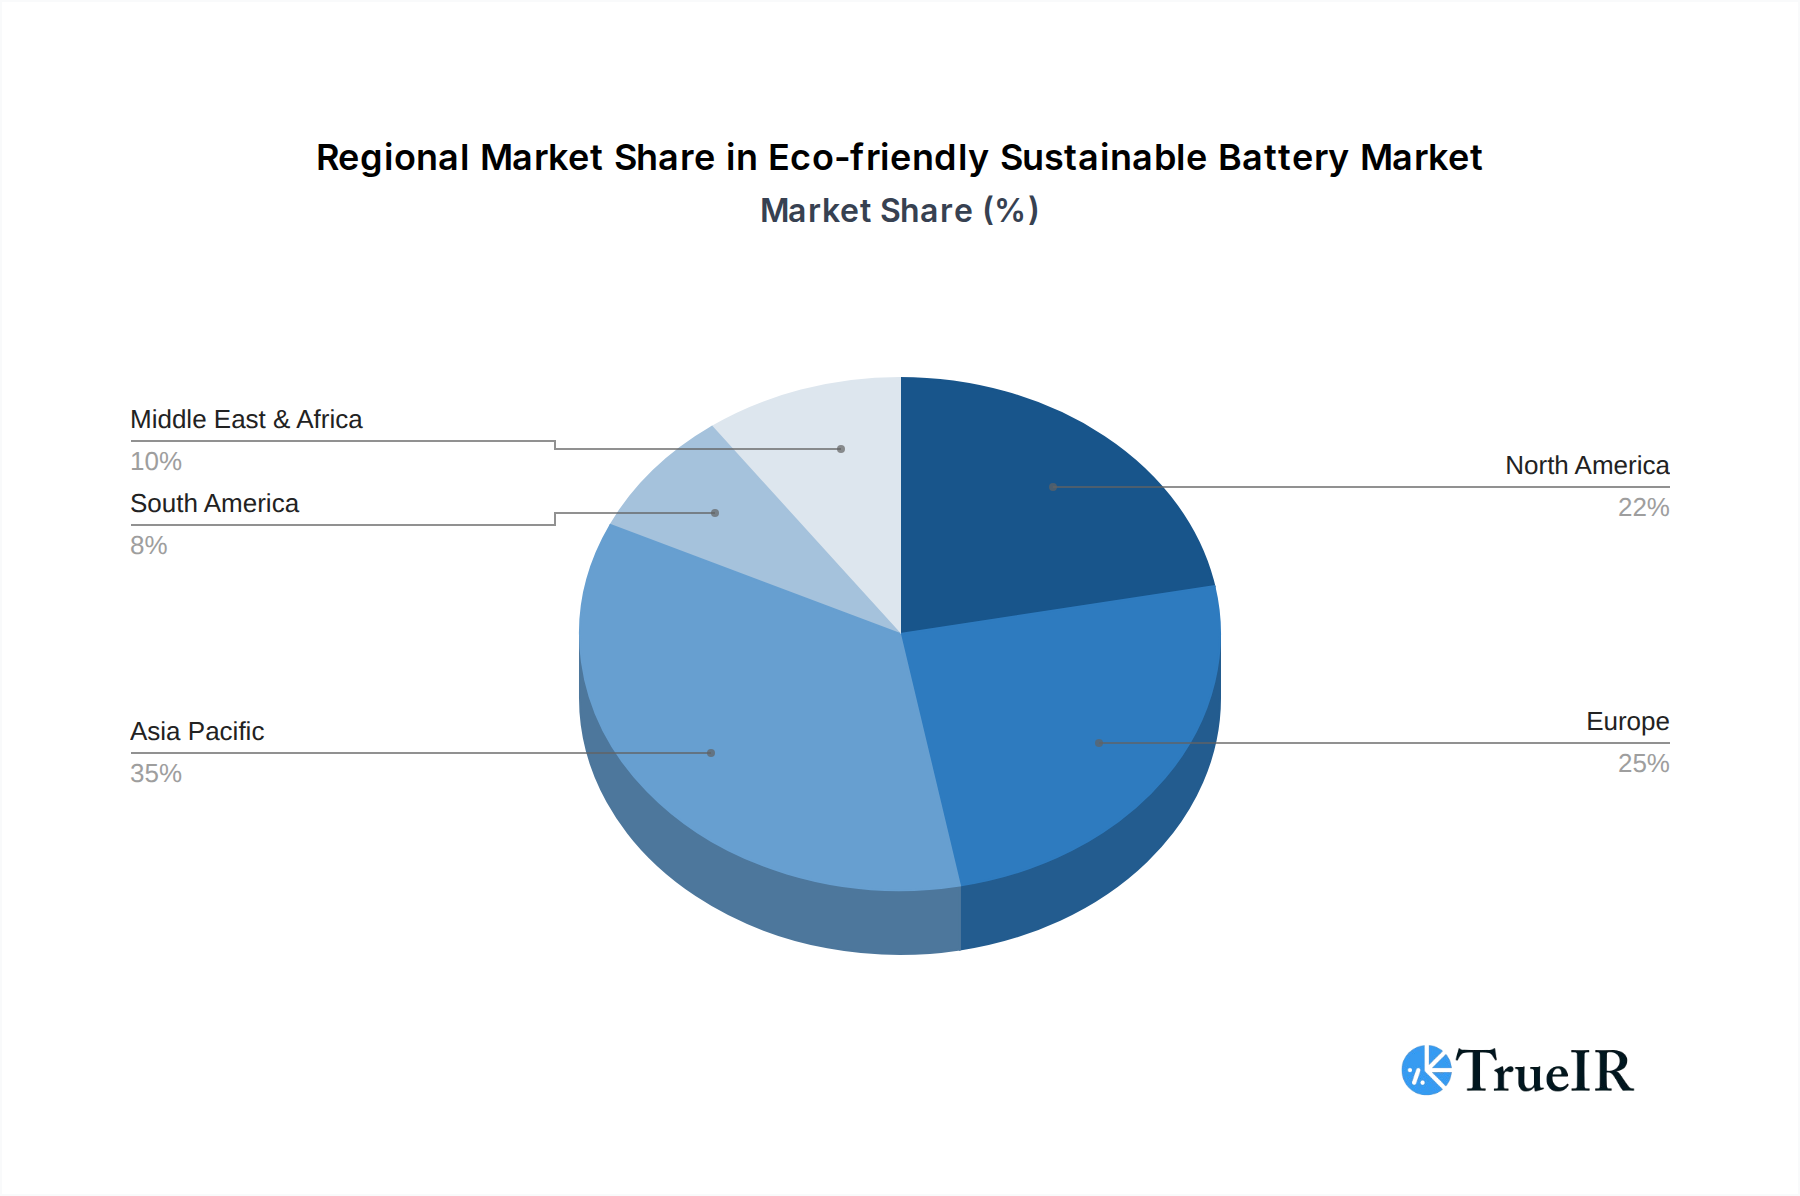
Eco-friendly Sustainable Battery Regional Market Share
Geographic Coverage of Eco-friendly Sustainable Battery
Eco-friendly Sustainable Battery REPORT HIGHLIGHTS
| Aspects | Details |
|---|---|
| Study Period | 2020-2034 |
| Base Year | 2025 |
| Estimated Year | 2026 |
| Forecast Period | 2026-2034 |
| Historical Period | 2020-2025 |
| Growth Rate | CAGR of 7.6% from 2020-2034 |
| Segmentation |
|
Table of Contents
- 1. Introduction
- 1.1. Research Scope
- 1.2. Market Segmentation
- 1.3. Research Methodology
- 1.4. Definitions and Assumptions
- 2. Executive Summary
- 2.1. Introduction
- 3. Market Dynamics
- 3.1. Introduction
- 3.2. Market Drivers
- 3.3. Market Restrains
- 3.4. Market Trends
- 4. Market Factor Analysis
- 4.1. Porters Five Forces
- 4.2. Supply/Value Chain
- 4.3. PESTEL analysis
- 4.4. Market Entropy
- 4.5. Patent/Trademark Analysis
- 5. Global Eco-friendly Sustainable Battery Analysis, Insights and Forecast, 2020-2032
- 5.1. Market Analysis, Insights and Forecast - by Application
- 5.1.1. Utility
- 5.1.2. Consumer Electronics
- 5.1.3. Electric Vehicles (EVs)
- 5.1.4. Others
- 5.2. Market Analysis, Insights and Forecast - by Types
- 5.2.1. Nickel Metal Hydride Battery
- 5.2.2. Lithium-ion Battery
- 5.2.3. Solar Cell
- 5.2.4. Others
- 5.3. Market Analysis, Insights and Forecast - by Region
- 5.3.1. North America
- 5.3.2. South America
- 5.3.3. Europe
- 5.3.4. Middle East & Africa
- 5.3.5. Asia Pacific
- 5.1. Market Analysis, Insights and Forecast - by Application
- 6. North America Eco-friendly Sustainable Battery Analysis, Insights and Forecast, 2020-2032
- 6.1. Market Analysis, Insights and Forecast - by Application
- 6.1.1. Utility
- 6.1.2. Consumer Electronics
- 6.1.3. Electric Vehicles (EVs)
- 6.1.4. Others
- 6.2. Market Analysis, Insights and Forecast - by Types
- 6.2.1. Nickel Metal Hydride Battery
- 6.2.2. Lithium-ion Battery
- 6.2.3. Solar Cell
- 6.2.4. Others
- 6.1. Market Analysis, Insights and Forecast - by Application
- 7. South America Eco-friendly Sustainable Battery Analysis, Insights and Forecast, 2020-2032
- 7.1. Market Analysis, Insights and Forecast - by Application
- 7.1.1. Utility
- 7.1.2. Consumer Electronics
- 7.1.3. Electric Vehicles (EVs)
- 7.1.4. Others
- 7.2. Market Analysis, Insights and Forecast - by Types
- 7.2.1. Nickel Metal Hydride Battery
- 7.2.2. Lithium-ion Battery
- 7.2.3. Solar Cell
- 7.2.4. Others
- 7.1. Market Analysis, Insights and Forecast - by Application
- 8. Europe Eco-friendly Sustainable Battery Analysis, Insights and Forecast, 2020-2032
- 8.1. Market Analysis, Insights and Forecast - by Application
- 8.1.1. Utility
- 8.1.2. Consumer Electronics
- 8.1.3. Electric Vehicles (EVs)
- 8.1.4. Others
- 8.2. Market Analysis, Insights and Forecast - by Types
- 8.2.1. Nickel Metal Hydride Battery
- 8.2.2. Lithium-ion Battery
- 8.2.3. Solar Cell
- 8.2.4. Others
- 8.1. Market Analysis, Insights and Forecast - by Application
- 9. Middle East & Africa Eco-friendly Sustainable Battery Analysis, Insights and Forecast, 2020-2032
- 9.1. Market Analysis, Insights and Forecast - by Application
- 9.1.1. Utility
- 9.1.2. Consumer Electronics
- 9.1.3. Electric Vehicles (EVs)
- 9.1.4. Others
- 9.2. Market Analysis, Insights and Forecast - by Types
- 9.2.1. Nickel Metal Hydride Battery
- 9.2.2. Lithium-ion Battery
- 9.2.3. Solar Cell
- 9.2.4. Others
- 9.1. Market Analysis, Insights and Forecast - by Application
- 10. Asia Pacific Eco-friendly Sustainable Battery Analysis, Insights and Forecast, 2020-2032
- 10.1. Market Analysis, Insights and Forecast - by Application
- 10.1.1. Utility
- 10.1.2. Consumer Electronics
- 10.1.3. Electric Vehicles (EVs)
- 10.1.4. Others
- 10.2. Market Analysis, Insights and Forecast - by Types
- 10.2.1. Nickel Metal Hydride Battery
- 10.2.2. Lithium-ion Battery
- 10.2.3. Solar Cell
- 10.2.4. Others
- 10.1. Market Analysis, Insights and Forecast - by Application
- 11. Competitive Analysis
- 11.1. Global Market Share Analysis 2025
- 11.2. Company Profiles
- 11.2.1 A123 Systems
- 11.2.1.1. Overview
- 11.2.1.2. Products
- 11.2.1.3. SWOT Analysis
- 11.2.1.4. Recent Developments
- 11.2.1.5. Financials (Based on Availability)
- 11.2.2 American Manganese
- 11.2.2.1. Overview
- 11.2.2.2. Products
- 11.2.2.3. SWOT Analysis
- 11.2.2.4. Recent Developments
- 11.2.2.5. Financials (Based on Availability)
- 11.2.3 BenAn Energy Technology
- 11.2.3.1. Overview
- 11.2.3.2. Products
- 11.2.3.3. SWOT Analysis
- 11.2.3.4. Recent Developments
- 11.2.3.5. Financials (Based on Availability)
- 11.2.4 Blue Solutions Canada
- 11.2.4.1. Overview
- 11.2.4.2. Products
- 11.2.4.3. SWOT Analysis
- 11.2.4.4. Recent Developments
- 11.2.4.5. Financials (Based on Availability)
- 11.2.5 TESLA
- 11.2.5.1. Overview
- 11.2.5.2. Products
- 11.2.5.3. SWOT Analysis
- 11.2.5.4. Recent Developments
- 11.2.5.5. Financials (Based on Availability)
- 11.2.6 BYD Company
- 11.2.6.1. Overview
- 11.2.6.2. Products
- 11.2.6.3. SWOT Analysis
- 11.2.6.4. Recent Developments
- 11.2.6.5. Financials (Based on Availability)
- 11.2.7 Cell-Con
- 11.2.7.1. Overview
- 11.2.7.2. Products
- 11.2.7.3. SWOT Analysis
- 11.2.7.4. Recent Developments
- 11.2.7.5. Financials (Based on Availability)
- 11.2.8 Contemporary Amperex Technology
- 11.2.8.1. Overview
- 11.2.8.2. Products
- 11.2.8.3. SWOT Analysis
- 11.2.8.4. Recent Developments
- 11.2.8.5. Financials (Based on Availability)
- 11.2.9 Cymbet Corporation
- 11.2.9.1. Overview
- 11.2.9.2. Products
- 11.2.9.3. SWOT Analysis
- 11.2.9.4. Recent Developments
- 11.2.9.5. Financials (Based on Availability)
- 11.2.10 Automotive Energy Supply Corporation
- 11.2.10.1. Overview
- 11.2.10.2. Products
- 11.2.10.3. SWOT Analysis
- 11.2.10.4. Recent Developments
- 11.2.10.5. Financials (Based on Availability)
- 11.2.11 Faradion
- 11.2.11.1. Overview
- 11.2.11.2. Products
- 11.2.11.3. SWOT Analysis
- 11.2.11.4. Recent Developments
- 11.2.11.5. Financials (Based on Availability)
- 11.2.12 Fluence Energy
- 11.2.12.1. Overview
- 11.2.12.2. Products
- 11.2.12.3. SWOT Analysis
- 11.2.12.4. Recent Developments
- 11.2.12.5. Financials (Based on Availability)
- 11.2.13 Itochu
- 11.2.13.1. Overview
- 11.2.13.2. Products
- 11.2.13.3. SWOT Analysis
- 11.2.13.4. Recent Developments
- 11.2.13.5. Financials (Based on Availability)
- 11.2.14 LG CHEM
- 11.2.14.1. Overview
- 11.2.14.2. Products
- 11.2.14.3. SWOT Analysis
- 11.2.14.4. Recent Developments
- 11.2.14.5. Financials (Based on Availability)
- 11.2.15 Mitsubishi Corporation
- 11.2.15.1. Overview
- 11.2.15.2. Products
- 11.2.15.3. SWOT Analysis
- 11.2.15.4. Recent Developments
- 11.2.15.5. Financials (Based on Availability)
- 11.2.16 NantEnergy
- 11.2.16.1. Overview
- 11.2.16.2. Products
- 11.2.16.3. SWOT Analysis
- 11.2.16.4. Recent Developments
- 11.2.16.5. Financials (Based on Availability)
- 11.2.17 NEC Energy Solutions
- 11.2.17.1. Overview
- 11.2.17.2. Products
- 11.2.17.3. SWOT Analysis
- 11.2.17.4. Recent Developments
- 11.2.17.5. Financials (Based on Availability)
- 11.2.18 NGK Insulators
- 11.2.18.1. Overview
- 11.2.18.2. Products
- 11.2.18.3. SWOT Analysis
- 11.2.18.4. Recent Developments
- 11.2.18.5. Financials (Based on Availability)
- 11.2.19 Panasonic
- 11.2.19.1. Overview
- 11.2.19.2. Products
- 11.2.19.3. SWOT Analysis
- 11.2.19.4. Recent Developments
- 11.2.19.5. Financials (Based on Availability)
- 11.2.20 Primus Power
- 11.2.20.1. Overview
- 11.2.20.2. Products
- 11.2.20.3. SWOT Analysis
- 11.2.20.4. Recent Developments
- 11.2.20.5. Financials (Based on Availability)
- 11.2.21 Samsung SDI
- 11.2.21.1. Overview
- 11.2.21.2. Products
- 11.2.21.3. SWOT Analysis
- 11.2.21.4. Recent Developments
- 11.2.21.5. Financials (Based on Availability)
- 11.2.22 Toshiba International
- 11.2.22.1. Overview
- 11.2.22.2. Products
- 11.2.22.3. SWOT Analysis
- 11.2.22.4. Recent Developments
- 11.2.22.5. Financials (Based on Availability)
- 11.2.23 VRB Energy
- 11.2.23.1. Overview
- 11.2.23.2. Products
- 11.2.23.3. SWOT Analysis
- 11.2.23.4. Recent Developments
- 11.2.23.5. Financials (Based on Availability)
- 11.2.1 A123 Systems
List of Figures
- Figure 1: Global Eco-friendly Sustainable Battery Revenue Breakdown (million, %) by Region 2025 & 2033
- Figure 2: North America Eco-friendly Sustainable Battery Revenue (million), by Application 2025 & 2033
- Figure 3: North America Eco-friendly Sustainable Battery Revenue Share (%), by Application 2025 & 2033
- Figure 4: North America Eco-friendly Sustainable Battery Revenue (million), by Types 2025 & 2033
- Figure 5: North America Eco-friendly Sustainable Battery Revenue Share (%), by Types 2025 & 2033
- Figure 6: North America Eco-friendly Sustainable Battery Revenue (million), by Country 2025 & 2033
- Figure 7: North America Eco-friendly Sustainable Battery Revenue Share (%), by Country 2025 & 2033
- Figure 8: South America Eco-friendly Sustainable Battery Revenue (million), by Application 2025 & 2033
- Figure 9: South America Eco-friendly Sustainable Battery Revenue Share (%), by Application 2025 & 2033
- Figure 10: South America Eco-friendly Sustainable Battery Revenue (million), by Types 2025 & 2033
- Figure 11: South America Eco-friendly Sustainable Battery Revenue Share (%), by Types 2025 & 2033
- Figure 12: South America Eco-friendly Sustainable Battery Revenue (million), by Country 2025 & 2033
- Figure 13: South America Eco-friendly Sustainable Battery Revenue Share (%), by Country 2025 & 2033
- Figure 14: Europe Eco-friendly Sustainable Battery Revenue (million), by Application 2025 & 2033
- Figure 15: Europe Eco-friendly Sustainable Battery Revenue Share (%), by Application 2025 & 2033
- Figure 16: Europe Eco-friendly Sustainable Battery Revenue (million), by Types 2025 & 2033
- Figure 17: Europe Eco-friendly Sustainable Battery Revenue Share (%), by Types 2025 & 2033
- Figure 18: Europe Eco-friendly Sustainable Battery Revenue (million), by Country 2025 & 2033
- Figure 19: Europe Eco-friendly Sustainable Battery Revenue Share (%), by Country 2025 & 2033
- Figure 20: Middle East & Africa Eco-friendly Sustainable Battery Revenue (million), by Application 2025 & 2033
- Figure 21: Middle East & Africa Eco-friendly Sustainable Battery Revenue Share (%), by Application 2025 & 2033
- Figure 22: Middle East & Africa Eco-friendly Sustainable Battery Revenue (million), by Types 2025 & 2033
- Figure 23: Middle East & Africa Eco-friendly Sustainable Battery Revenue Share (%), by Types 2025 & 2033
- Figure 24: Middle East & Africa Eco-friendly Sustainable Battery Revenue (million), by Country 2025 & 2033
- Figure 25: Middle East & Africa Eco-friendly Sustainable Battery Revenue Share (%), by Country 2025 & 2033
- Figure 26: Asia Pacific Eco-friendly Sustainable Battery Revenue (million), by Application 2025 & 2033
- Figure 27: Asia Pacific Eco-friendly Sustainable Battery Revenue Share (%), by Application 2025 & 2033
- Figure 28: Asia Pacific Eco-friendly Sustainable Battery Revenue (million), by Types 2025 & 2033
- Figure 29: Asia Pacific Eco-friendly Sustainable Battery Revenue Share (%), by Types 2025 & 2033
- Figure 30: Asia Pacific Eco-friendly Sustainable Battery Revenue (million), by Country 2025 & 2033
- Figure 31: Asia Pacific Eco-friendly Sustainable Battery Revenue Share (%), by Country 2025 & 2033
List of Tables
- Table 1: Global Eco-friendly Sustainable Battery Revenue million Forecast, by Application 2020 & 2033
- Table 2: Global Eco-friendly Sustainable Battery Revenue million Forecast, by Types 2020 & 2033
- Table 3: Global Eco-friendly Sustainable Battery Revenue million Forecast, by Region 2020 & 2033
- Table 4: Global Eco-friendly Sustainable Battery Revenue million Forecast, by Application 2020 & 2033
- Table 5: Global Eco-friendly Sustainable Battery Revenue million Forecast, by Types 2020 & 2033
- Table 6: Global Eco-friendly Sustainable Battery Revenue million Forecast, by Country 2020 & 2033
- Table 7: United States Eco-friendly Sustainable Battery Revenue (million) Forecast, by Application 2020 & 2033
- Table 8: Canada Eco-friendly Sustainable Battery Revenue (million) Forecast, by Application 2020 & 2033
- Table 9: Mexico Eco-friendly Sustainable Battery Revenue (million) Forecast, by Application 2020 & 2033
- Table 10: Global Eco-friendly Sustainable Battery Revenue million Forecast, by Application 2020 & 2033
- Table 11: Global Eco-friendly Sustainable Battery Revenue million Forecast, by Types 2020 & 2033
- Table 12: Global Eco-friendly Sustainable Battery Revenue million Forecast, by Country 2020 & 2033
- Table 13: Brazil Eco-friendly Sustainable Battery Revenue (million) Forecast, by Application 2020 & 2033
- Table 14: Argentina Eco-friendly Sustainable Battery Revenue (million) Forecast, by Application 2020 & 2033
- Table 15: Rest of South America Eco-friendly Sustainable Battery Revenue (million) Forecast, by Application 2020 & 2033
- Table 16: Global Eco-friendly Sustainable Battery Revenue million Forecast, by Application 2020 & 2033
- Table 17: Global Eco-friendly Sustainable Battery Revenue million Forecast, by Types 2020 & 2033
- Table 18: Global Eco-friendly Sustainable Battery Revenue million Forecast, by Country 2020 & 2033
- Table 19: United Kingdom Eco-friendly Sustainable Battery Revenue (million) Forecast, by Application 2020 & 2033
- Table 20: Germany Eco-friendly Sustainable Battery Revenue (million) Forecast, by Application 2020 & 2033
- Table 21: France Eco-friendly Sustainable Battery Revenue (million) Forecast, by Application 2020 & 2033
- Table 22: Italy Eco-friendly Sustainable Battery Revenue (million) Forecast, by Application 2020 & 2033
- Table 23: Spain Eco-friendly Sustainable Battery Revenue (million) Forecast, by Application 2020 & 2033
- Table 24: Russia Eco-friendly Sustainable Battery Revenue (million) Forecast, by Application 2020 & 2033
- Table 25: Benelux Eco-friendly Sustainable Battery Revenue (million) Forecast, by Application 2020 & 2033
- Table 26: Nordics Eco-friendly Sustainable Battery Revenue (million) Forecast, by Application 2020 & 2033
- Table 27: Rest of Europe Eco-friendly Sustainable Battery Revenue (million) Forecast, by Application 2020 & 2033
- Table 28: Global Eco-friendly Sustainable Battery Revenue million Forecast, by Application 2020 & 2033
- Table 29: Global Eco-friendly Sustainable Battery Revenue million Forecast, by Types 2020 & 2033
- Table 30: Global Eco-friendly Sustainable Battery Revenue million Forecast, by Country 2020 & 2033
- Table 31: Turkey Eco-friendly Sustainable Battery Revenue (million) Forecast, by Application 2020 & 2033
- Table 32: Israel Eco-friendly Sustainable Battery Revenue (million) Forecast, by Application 2020 & 2033
- Table 33: GCC Eco-friendly Sustainable Battery Revenue (million) Forecast, by Application 2020 & 2033
- Table 34: North Africa Eco-friendly Sustainable Battery Revenue (million) Forecast, by Application 2020 & 2033
- Table 35: South Africa Eco-friendly Sustainable Battery Revenue (million) Forecast, by Application 2020 & 2033
- Table 36: Rest of Middle East & Africa Eco-friendly Sustainable Battery Revenue (million) Forecast, by Application 2020 & 2033
- Table 37: Global Eco-friendly Sustainable Battery Revenue million Forecast, by Application 2020 & 2033
- Table 38: Global Eco-friendly Sustainable Battery Revenue million Forecast, by Types 2020 & 2033
- Table 39: Global Eco-friendly Sustainable Battery Revenue million Forecast, by Country 2020 & 2033
- Table 40: China Eco-friendly Sustainable Battery Revenue (million) Forecast, by Application 2020 & 2033
- Table 41: India Eco-friendly Sustainable Battery Revenue (million) Forecast, by Application 2020 & 2033
- Table 42: Japan Eco-friendly Sustainable Battery Revenue (million) Forecast, by Application 2020 & 2033
- Table 43: South Korea Eco-friendly Sustainable Battery Revenue (million) Forecast, by Application 2020 & 2033
- Table 44: ASEAN Eco-friendly Sustainable Battery Revenue (million) Forecast, by Application 2020 & 2033
- Table 45: Oceania Eco-friendly Sustainable Battery Revenue (million) Forecast, by Application 2020 & 2033
- Table 46: Rest of Asia Pacific Eco-friendly Sustainable Battery Revenue (million) Forecast, by Application 2020 & 2033
Frequently Asked Questions
1. What is the projected Compound Annual Growth Rate (CAGR) of the Eco-friendly Sustainable Battery?
The projected CAGR is approximately 7.6%.
2. Which companies are prominent players in the Eco-friendly Sustainable Battery?
Key companies in the market include A123 Systems, American Manganese, BenAn Energy Technology, Blue Solutions Canada, TESLA, BYD Company, Cell-Con, Contemporary Amperex Technology, Cymbet Corporation, Automotive Energy Supply Corporation, Faradion, Fluence Energy, Itochu, LG CHEM, Mitsubishi Corporation, NantEnergy, NEC Energy Solutions, NGK Insulators, Panasonic, Primus Power, Samsung SDI, Toshiba International, VRB Energy.
3. What are the main segments of the Eco-friendly Sustainable Battery?
The market segments include Application, Types.
4. Can you provide details about the market size?
The market size is estimated to be USD 25830 million as of 2022.
5. What are some drivers contributing to market growth?
N/A
6. What are the notable trends driving market growth?
N/A
7. Are there any restraints impacting market growth?
N/A
8. Can you provide examples of recent developments in the market?
N/A
9. What pricing options are available for accessing the report?
Pricing options include single-user, multi-user, and enterprise licenses priced at USD 4900.00, USD 7350.00, and USD 9800.00 respectively.
10. Is the market size provided in terms of value or volume?
The market size is provided in terms of value, measured in million.
11. Are there any specific market keywords associated with the report?
Yes, the market keyword associated with the report is "Eco-friendly Sustainable Battery," which aids in identifying and referencing the specific market segment covered.
12. How do I determine which pricing option suits my needs best?
The pricing options vary based on user requirements and access needs. Individual users may opt for single-user licenses, while businesses requiring broader access may choose multi-user or enterprise licenses for cost-effective access to the report.
13. Are there any additional resources or data provided in the Eco-friendly Sustainable Battery report?
While the report offers comprehensive insights, it's advisable to review the specific contents or supplementary materials provided to ascertain if additional resources or data are available.
14. How can I stay updated on further developments or reports in the Eco-friendly Sustainable Battery?
To stay informed about further developments, trends, and reports in the Eco-friendly Sustainable Battery, consider subscribing to industry newsletters, following relevant companies and organizations, or regularly checking reputable industry news sources and publications.
Methodology
Step 1 - Identification of Relevant Samples Size from Population Database


Step 2 - Approaches for Defining Global Market Size (Value, Volume* & Price*)

Note*: In applicable scenarios
Step 3 - Data Sources
Primary Research
- Web Analytics
- Survey Reports
- Research Institute
- Latest Research Reports
- Opinion Leaders
Secondary Research
- Annual Reports
- White Paper
- Latest Press Release
- Industry Association
- Paid Database
- Investor Presentations

Step 4 - Data Triangulation
Involves using different sources of information in order to increase the validity of a study
These sources are likely to be stakeholders in a program - participants, other researchers, program staff, other community members, and so on.
Then we put all data in single framework & apply various statistical tools to find out the dynamic on the market.
During the analysis stage, feedback from the stakeholder groups would be compared to determine areas of agreement as well as areas of divergence