

Key Insights
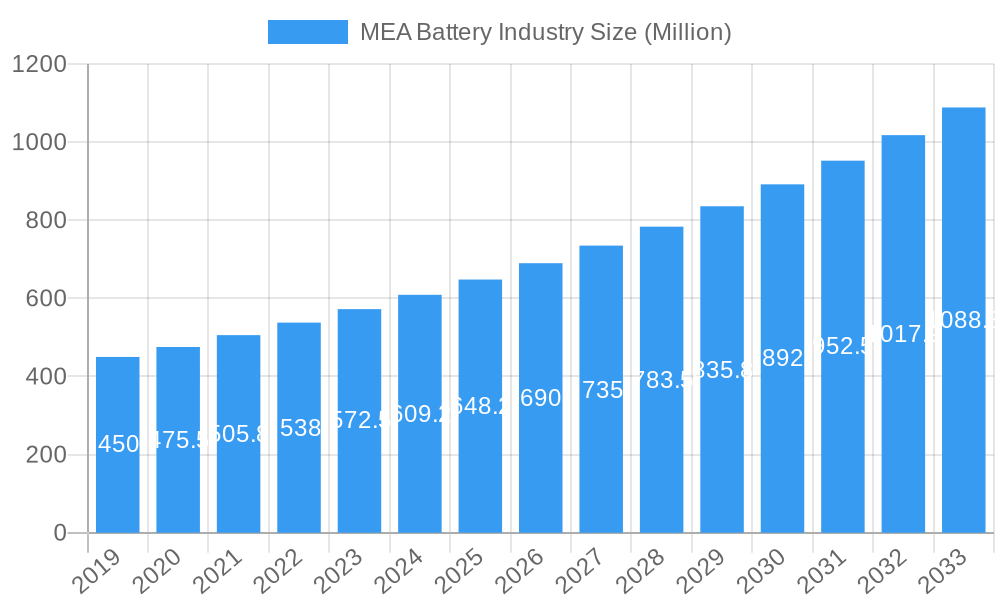
The Middle East and Africa (MEA) battery market is poised for robust expansion, projecting a market size of $7.06 million with a significant Compound Annual Growth Rate (CAGR) exceeding 7.00%. This growth is primarily fueled by increasing demand across various sectors. In the automotive sector, the transition towards electric vehicles (EVs), coupled with a growing vehicle parc, is a major driver. Furthermore, the burgeoning industrial landscape across MEA, encompassing manufacturing, oil and gas, and renewable energy projects, necessitates reliable and high-performance battery solutions for power backup and grid stabilization. The consumer electronics segment also contributes to this upward trajectory, driven by the widespread adoption of portable devices and the continuous innovation in this space. Government initiatives promoting industrial development and renewable energy integration further bolster market confidence and investment.
MEA Battery Industry Market Size (In Million)
The MEA battery market is characterized by a diverse range of technologies and applications. Lithium-ion batteries are expected to witness substantial growth due to their superior energy density and longer lifespan, making them ideal for EVs and advanced portable electronics. However, lead-acid batteries will continue to hold a significant market share, particularly in automotive starter batteries and stationary applications where cost-effectiveness remains a key consideration. Secondary batteries, offering rechargeability, will dominate the market, catering to the sustainable energy and recurring usage needs across all application segments. Geographically, Saudi Arabia and the United Arab Emirates are anticipated to lead market expansion, driven by substantial investments in infrastructure, automotive sector growth, and renewable energy projects. South Africa also presents a considerable market opportunity, supported by its established industrial base and growing adoption of energy storage solutions. The "Rest of Middle-East and Africa" region, though fragmented, offers untapped potential as economies develop and electricity access expands.
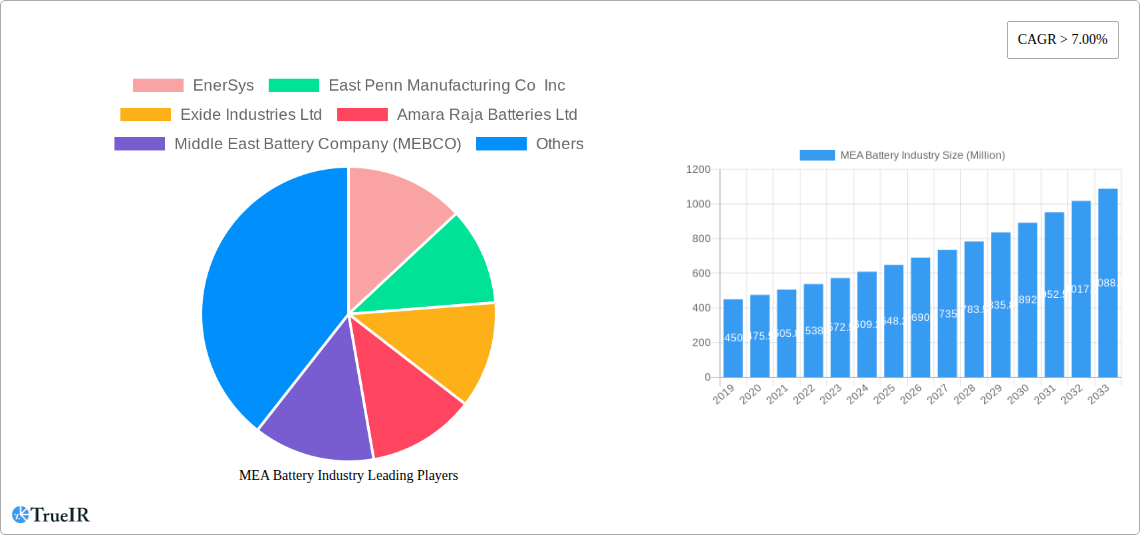
MEA Battery Industry Company Market Share
MEA Battery Industry Market: Comprehensive Analysis and Future Outlook (2019-2033)
This in-depth report provides an unparalleled view into the dynamic Middle East and Africa (MEA) Battery Industry, offering a comprehensive market analysis, strategic insights, and future projections. Leveraging high-volume keywords such as "MEA battery market," "Middle East battery," "Africa battery industry," "lithium-ion batteries MEA," "automotive batteries MEA," and "energy storage solutions MEA," this report is meticulously crafted for industry professionals, investors, and policymakers seeking to capitalize on the burgeoning opportunities within this critical sector. Covering the period from 2019 to 2033, with a base year of 2025, this report delves into market structure, key trends, dominant segments, product innovations, growth drivers, challenges, competitive landscape, and significant industry milestones.
MEA Battery Industry Market Structure & Competitive Landscape
The MEA Battery Industry exhibits a moderately concentrated market structure, with key players like EnerSys, East Penn Manufacturing Co Inc, Exide Industries Ltd, Amara Raja Batteries Ltd, Middle East Battery Company (MEBCO), C&D Technologies Inc, First National Battery Pty Ltd, SAFT GROUPE SA, and Panasonic Corporation vying for market share. Innovation remains a crucial differentiator, driven by advancements in lithium-ion battery technology and the increasing demand for higher energy density and faster charging capabilities. Regulatory frameworks are evolving across the region, with governments increasingly supporting renewable energy integration and electric vehicle adoption, thereby influencing market dynamics. Product substitutes, particularly in the lead-acid battery segment for traditional automotive applications, continue to pose a challenge, but are steadily being eroded by the superior performance of newer technologies. End-user segmentation reveals robust growth in the automotive and industrial sectors, fueled by infrastructure development and a growing preference for electric mobility. Merger and acquisition (M&A) activities, though not at an extremely high volume, are anticipated to increase as established players seek to expand their geographical reach and technological portfolios. An estimated xx Million USD in M&A deals is projected within the forecast period, reflecting strategic consolidation.
MEA Battery Industry Market Trends & Opportunities
The MEA Battery Industry is poised for remarkable expansion, driven by a confluence of technological advancements, supportive government policies, and evolving consumer preferences. The market is projected to witness a Compound Annual Growth Rate (CAGR) of xx% from 2025 to 2033, reaching an estimated market size of xx Million USD by the end of the forecast period. Technological shifts are predominantly characterized by the rapid adoption of lithium-ion batteries, supplanting traditional lead-acid technologies in various applications due to their higher energy density, longer lifespan, and improved safety features. This transition is particularly evident in the burgeoning electric vehicle (EV) segment and the growing demand for portable electronics. Consumer preferences are increasingly leaning towards sustainable and efficient energy solutions, driving the adoption of batteries for renewable energy storage and off-grid power solutions. The competitive dynamics are intensifying, with both established global players and emerging regional manufacturers investing heavily in research and development to gain a competitive edge. Opportunities abound in the development of battery recycling infrastructure, the creation of advanced battery management systems, and the integration of battery storage with smart grid technologies. The penetration rate of advanced battery technologies in the MEA region is estimated to grow from xx% in 2025 to xx% by 2033. The demand for energy storage solutions, driven by grid modernization efforts and the integration of intermittent renewable energy sources like solar and wind power, represents a significant growth avenue. Furthermore, the increasing urbanization and industrialization across MEA countries will continue to propel the demand for reliable and efficient battery systems for a wide array of applications, from telecommunications to industrial automation. The shift towards electric mobility, supported by government incentives and the development of charging infrastructure, is also a pivotal trend shaping the future of the MEA battery market.
Dominant Markets & Segments in MEA Battery Industry
The MEA Battery Industry is characterized by dominant segments and regions that are set to drive substantial growth. Saudi Arabia and the United Arab Emirates are emerging as frontrunners in terms of market size and investment, largely due to significant government initiatives promoting renewable energy and electric vehicle adoption. The Automotive Batteries segment, encompassing both traditional internal combustion engine (ICE) vehicles and the rapidly expanding EV market, is a primary growth engine. Key growth drivers for automotive batteries include:
- Government Subsidies and Incentives: Policies encouraging EV adoption and local manufacturing are pivotal.
- Infrastructure Development: Expansion of charging networks is crucial for EV growth.
- Increasing Consumer Awareness: Growing environmental consciousness is shifting preferences towards EVs.
The Secondary Battery segment, particularly lithium-ion technology, is witnessing the most significant expansion, driven by its versatility and superior performance. Within technologies, Lithium-ion Battery dominates due to its application in EVs, consumer electronics, and grid-scale energy storage. Key growth drivers for lithium-ion batteries include:
- Technological Advancements: Continuous improvements in energy density, charging speed, and safety.
- Cost Reduction: Economies of scale and manufacturing efficiencies are making Li-ion batteries more affordable.
- Wide Range of Applications: Suitability for diverse needs from portable devices to large-scale storage.
The Industrial application segment, encompassing UPS systems, telecommunications, and backup power solutions, also presents substantial growth opportunities. This is driven by the need for reliable power in critical infrastructure and the increasing digitalization of businesses across the region. The Rest of Middle-East and Africa region, while currently at an earlier stage of development, holds immense untapped potential, particularly in countries like South Africa, which is also actively pursuing renewable energy targets and EV initiatives. The Primary Battery segment, while mature, continues to cater to specific niche applications where disposable power is preferred, but its market share is gradually being eroded by the rise of rechargeable solutions.
MEA Battery Industry Product Analysis
Product innovation in the MEA Battery Industry is primarily focused on enhancing energy density, improving charging speeds, and extending the lifespan of batteries, particularly within the lithium-ion technology domain. Manufacturers are actively developing next-generation battery chemistries, such as solid-state batteries, to address safety concerns and boost performance further. Applications span across automotive, where advancements are critical for EV range and charging times, to portable electronics, demanding lighter and more powerful solutions, and industrial energy storage, requiring robust and long-lasting systems for grid stability and backup power. Competitive advantages are being carved out through superior battery management systems, efficient thermal management, and cost-effective manufacturing processes, making these products more appealing to a wider market base.
Key Drivers, Barriers & Challenges in MEA Battery Industry
The MEA Battery Industry is propelled by significant drivers including the global push for decarbonization, government mandates for renewable energy integration, and the rapidly expanding electric vehicle market. Technological advancements in battery chemistry and manufacturing, coupled with declining battery costs, further fuel market growth. Economic factors like increasing disposable incomes and industrial development also contribute to higher demand for energy storage solutions.
However, the industry faces considerable challenges. Supply chain disruptions, particularly for raw materials like lithium and cobalt, can lead to price volatility and production delays. Regulatory complexities and varying standards across different MEA countries can hinder market entry and expansion. Intense competition from established global players and the nascent stage of local manufacturing capabilities also pose significant restraints. High initial investment costs for battery manufacturing facilities and the need for skilled labor further add to the hurdles.
Growth Drivers in the MEA Battery Industry Market
Key growth drivers for the MEA Battery Industry are multifaceted, encompassing technological innovation, supportive economic policies, and increasing environmental consciousness. The global transition towards cleaner energy sources, such as solar and wind power, directly fuels the demand for advanced battery storage solutions to ensure grid stability. Government initiatives in countries like Saudi Arabia and the UAE, focused on diversifying economies and promoting electric mobility through subsidies and infrastructure development, are creating substantial market opportunities. Furthermore, the increasing adoption of electric vehicles (EVs) across the region, supported by the unveiling of new EV models and the expansion of charging networks, is a paramount growth catalyst. The continuous improvement in battery technology, leading to higher energy density and lower costs, is making battery-powered solutions more accessible and attractive to a broader consumer base and industrial applications.
Challenges Impacting MEA Battery Industry Growth
Several challenges significantly impact the growth trajectory of the MEA Battery Industry. The reliance on imported raw materials, such as lithium, cobalt, and nickel, exposes the market to global supply chain volatilities and price fluctuations, directly affecting manufacturing costs and product affordability. Navigating the diverse and sometimes inconsistent regulatory landscapes across different MEA countries presents a barrier to market entry and expansion for manufacturers. The high initial capital expenditure required for establishing advanced battery manufacturing facilities, coupled with the scarcity of skilled labor for specialized roles, also acts as a restraint. Furthermore, the competitive pressure from established international players with mature technologies and extensive market reach poses a challenge for emerging regional companies. The development of a robust battery recycling infrastructure is also a nascent area, requiring significant investment and policy support to ensure the sustainability of the industry.
Key Players Shaping the MEA Battery Industry Market
- EnerSys
- East Penn Manufacturing Co Inc
- Exide Industries Ltd
- Amara Raja Batteries Ltd
- Middle East Battery Company (MEBCO)
- C&D Technologies Inc
- First National Battery Pty Ltd
- SAFT GROUPE SA
- Panasonic Corporation
Significant MEA Battery Industry Industry Milestones
- Aug 2023: Mahindra & Mahindra, India's fourth largest car manufacturer, unveiled the electric version of the Thar SUV at an event in South Africa. Apart from the Thar.e, Mahindra also unveiled seven new tractor models at the event in Cape Town, South Africa. This signifies a growing interest in EV adoption and agricultural mechanization in the region.
- Jun 2023: Saudi Arabia's Ministry of Investment signed a USD 5.6 billion deal with Chinese electric car maker Human Horizons to collaborate on the development, manufacture, and sale of vehicles. This landmark agreement highlights the region's commitment to becoming a hub for EV production and innovation.
Future Outlook for MEA Battery Industry Market
The future outlook for the MEA Battery Industry is exceptionally promising, characterized by sustained growth fueled by strategic investments in renewable energy and electric mobility. The increasing focus on localized manufacturing, driven by government incentives and the pursuit of energy independence, will foster innovation and create new market opportunities. The anticipated advancements in battery technology, including the potential commercialization of solid-state batteries, will further enhance performance and safety, accelerating adoption across various sectors. The development of comprehensive battery recycling initiatives and the integration of smart grid technologies will contribute to a more sustainable and efficient energy ecosystem. The MEA region is poised to become a significant player in the global battery market, driven by a combination of robust demand, technological progress, and supportive policy frameworks.
MEA Battery Industry Segmentation
-
1. Type
- 1.1. Primary Battery
- 1.2. Secondary Battery
-
2. Technology
- 2.1. Lead-acid Battery
- 2.2. Lithium-ion Battery
- 2.3. Nickel-metal Hydride (NiMH) Battery
- 2.4. Other Te
-
3. Application
- 3.1. Automotive Batteries
- 3.2. Industri
- 3.3. Portable Batteries (Consumer Electronics, etc.)
- 3.4. Other Applications
-
4. Geography
- 4.1. Saudi Arabia
- 4.2. United Arab Emirates
- 4.3. South Africa
- 4.4. Rest of Middle-East and Africa
MEA Battery Industry Segmentation By Geography
- 1. Saudi Arabia
- 2. United Arab Emirates
- 3. South Africa
- 4. Rest of Middle East and Africa
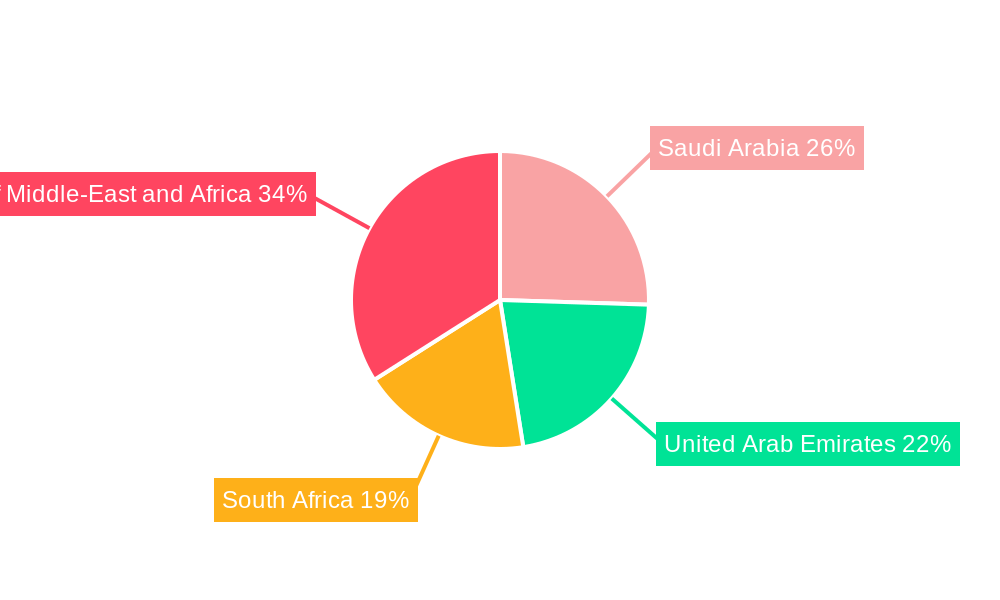
MEA Battery Industry Regional Market Share
Geographic Coverage of MEA Battery Industry
MEA Battery Industry REPORT HIGHLIGHTS
| Aspects | Details |
|---|---|
| Study Period | 2020-2034 |
| Base Year | 2025 |
| Estimated Year | 2026 |
| Forecast Period | 2026-2034 |
| Historical Period | 2020-2025 |
| Growth Rate | CAGR of > 7.00% from 2020-2034 |
| Segmentation |
|
Table of Contents
- 1. Introduction
- 1.1. Research Scope
- 1.2. Market Segmentation
- 1.3. Research Objective
- 1.4. Definitions and Assumptions
- 2. Executive Summary
- 2.1. Market Snapshot
- 3. Market Dynamics
- 3.1. Market Drivers
- 3.2. Market Restrains
- 3.3. Market Trends
- 3.4. Market Opportunities
- 4. Market Factor Analysis
- 4.1. Porters Five Forces
- 4.1.1. Bargaining Power of Suppliers
- 4.1.2. Bargaining Power of Buyers
- 4.1.3. Threat of New Entrants
- 4.1.4. Threat of Substitutes
- 4.1.5. Competitive Rivalry
- 4.2. PESTEL analysis
- 4.3. BCG Analysis
- 4.3.1. Stars (High Growth, High Market Share)
- 4.3.2. Cash Cows (Low Growth, High Market Share)
- 4.3.3. Question Mark (High Growth, Low Market Share)
- 4.3.4. Dogs (Low Growth, Low Market Share)
- 4.4. Ansoff Matrix Analysis
- 4.5. Supply Chain Analysis
- 4.6. Regulatory Landscape
- 4.7. Current Market Potential and Opportunity Assessment (TAM–SAM–SOM Framework)
- 4.8. TIR Analyst Note
- 4.1. Porters Five Forces
- 5. Market Analysis, Insights and Forecast 2021-2033
- 5.1. Market Analysis, Insights and Forecast - by Type
- 5.1.1. Primary Battery
- 5.1.2. Secondary Battery
- 5.2. Market Analysis, Insights and Forecast - by Technology
- 5.2.1. Lead-acid Battery
- 5.2.2. Lithium-ion Battery
- 5.2.3. Nickel-metal Hydride (NiMH) Battery
- 5.2.4. Other Te
- 5.3. Market Analysis, Insights and Forecast - by Application
- 5.3.1. Automotive Batteries
- 5.3.2. Industri
- 5.3.3. Portable Batteries (Consumer Electronics, etc.)
- 5.3.4. Other Applications
- 5.4. Market Analysis, Insights and Forecast - by Geography
- 5.4.1. Saudi Arabia
- 5.4.2. United Arab Emirates
- 5.4.3. South Africa
- 5.4.4. Rest of Middle-East and Africa
- 5.5. Market Analysis, Insights and Forecast - by Region
- 5.5.1. Saudi Arabia
- 5.5.2. United Arab Emirates
- 5.5.3. South Africa
- 5.5.4. Rest of Middle East and Africa
- 5.1. Market Analysis, Insights and Forecast - by Type
- 6. Global MEA Battery Industry Analysis, Insights and Forecast, 2021-2033
- 6.1. Market Analysis, Insights and Forecast - by Type
- 6.1.1. Primary Battery
- 6.1.2. Secondary Battery
- 6.2. Market Analysis, Insights and Forecast - by Technology
- 6.2.1. Lead-acid Battery
- 6.2.2. Lithium-ion Battery
- 6.2.3. Nickel-metal Hydride (NiMH) Battery
- 6.2.4. Other Te
- 6.3. Market Analysis, Insights and Forecast - by Application
- 6.3.1. Automotive Batteries
- 6.3.2. Industri
- 6.3.3. Portable Batteries (Consumer Electronics, etc.)
- 6.3.4. Other Applications
- 6.4. Market Analysis, Insights and Forecast - by Geography
- 6.4.1. Saudi Arabia
- 6.4.2. United Arab Emirates
- 6.4.3. South Africa
- 6.4.4. Rest of Middle-East and Africa
- 6.1. Market Analysis, Insights and Forecast - by Type
- 7. Saudi Arabia MEA Battery Industry Analysis, Insights and Forecast, 2020-2032
- 7.1. Market Analysis, Insights and Forecast - by Type
- 7.1.1. Primary Battery
- 7.1.2. Secondary Battery
- 7.2. Market Analysis, Insights and Forecast - by Technology
- 7.2.1. Lead-acid Battery
- 7.2.2. Lithium-ion Battery
- 7.2.3. Nickel-metal Hydride (NiMH) Battery
- 7.2.4. Other Te
- 7.3. Market Analysis, Insights and Forecast - by Application
- 7.3.1. Automotive Batteries
- 7.3.2. Industri
- 7.3.3. Portable Batteries (Consumer Electronics, etc.)
- 7.3.4. Other Applications
- 7.4. Market Analysis, Insights and Forecast - by Geography
- 7.4.1. Saudi Arabia
- 7.4.2. United Arab Emirates
- 7.4.3. South Africa
- 7.4.4. Rest of Middle-East and Africa
- 7.1. Market Analysis, Insights and Forecast - by Type
- 8. United Arab Emirates MEA Battery Industry Analysis, Insights and Forecast, 2020-2032
- 8.1. Market Analysis, Insights and Forecast - by Type
- 8.1.1. Primary Battery
- 8.1.2. Secondary Battery
- 8.2. Market Analysis, Insights and Forecast - by Technology
- 8.2.1. Lead-acid Battery
- 8.2.2. Lithium-ion Battery
- 8.2.3. Nickel-metal Hydride (NiMH) Battery
- 8.2.4. Other Te
- 8.3. Market Analysis, Insights and Forecast - by Application
- 8.3.1. Automotive Batteries
- 8.3.2. Industri
- 8.3.3. Portable Batteries (Consumer Electronics, etc.)
- 8.3.4. Other Applications
- 8.4. Market Analysis, Insights and Forecast - by Geography
- 8.4.1. Saudi Arabia
- 8.4.2. United Arab Emirates
- 8.4.3. South Africa
- 8.4.4. Rest of Middle-East and Africa
- 8.1. Market Analysis, Insights and Forecast - by Type
- 9. South Africa MEA Battery Industry Analysis, Insights and Forecast, 2020-2032
- 9.1. Market Analysis, Insights and Forecast - by Type
- 9.1.1. Primary Battery
- 9.1.2. Secondary Battery
- 9.2. Market Analysis, Insights and Forecast - by Technology
- 9.2.1. Lead-acid Battery
- 9.2.2. Lithium-ion Battery
- 9.2.3. Nickel-metal Hydride (NiMH) Battery
- 9.2.4. Other Te
- 9.3. Market Analysis, Insights and Forecast - by Application
- 9.3.1. Automotive Batteries
- 9.3.2. Industri
- 9.3.3. Portable Batteries (Consumer Electronics, etc.)
- 9.3.4. Other Applications
- 9.4. Market Analysis, Insights and Forecast - by Geography
- 9.4.1. Saudi Arabia
- 9.4.2. United Arab Emirates
- 9.4.3. South Africa
- 9.4.4. Rest of Middle-East and Africa
- 9.1. Market Analysis, Insights and Forecast - by Type
- 10. Rest of Middle East and Africa MEA Battery Industry Analysis, Insights and Forecast, 2020-2032
- 10.1. Market Analysis, Insights and Forecast - by Type
- 10.1.1. Primary Battery
- 10.1.2. Secondary Battery
- 10.2. Market Analysis, Insights and Forecast - by Technology
- 10.2.1. Lead-acid Battery
- 10.2.2. Lithium-ion Battery
- 10.2.3. Nickel-metal Hydride (NiMH) Battery
- 10.2.4. Other Te
- 10.3. Market Analysis, Insights and Forecast - by Application
- 10.3.1. Automotive Batteries
- 10.3.2. Industri
- 10.3.3. Portable Batteries (Consumer Electronics, etc.)
- 10.3.4. Other Applications
- 10.4. Market Analysis, Insights and Forecast - by Geography
- 10.4.1. Saudi Arabia
- 10.4.2. United Arab Emirates
- 10.4.3. South Africa
- 10.4.4. Rest of Middle-East and Africa
- 10.1. Market Analysis, Insights and Forecast - by Type
- 11. Competitive Analysis
- 11.1. Company Profiles
- 11.1.1 EnerSys
- 11.1.1.1. Company Overview
- 11.1.1.2. Products
- 11.1.1.3. Company Financials
- 11.1.1.4. SWOT Analysis
- 11.1.2 East Penn Manufacturing Co Inc
- 11.1.2.1. Company Overview
- 11.1.2.2. Products
- 11.1.2.3. Company Financials
- 11.1.2.4. SWOT Analysis
- 11.1.3 Exide Industries Ltd
- 11.1.3.1. Company Overview
- 11.1.3.2. Products
- 11.1.3.3. Company Financials
- 11.1.3.4. SWOT Analysis
- 11.1.4 Amara Raja Batteries Ltd
- 11.1.4.1. Company Overview
- 11.1.4.2. Products
- 11.1.4.3. Company Financials
- 11.1.4.4. SWOT Analysis
- 11.1.5 Middle East Battery Company (MEBCO)
- 11.1.5.1. Company Overview
- 11.1.5.2. Products
- 11.1.5.3. Company Financials
- 11.1.5.4. SWOT Analysis
- 11.1.6 C&D Technologies Inc
- 11.1.6.1. Company Overview
- 11.1.6.2. Products
- 11.1.6.3. Company Financials
- 11.1.6.4. SWOT Analysis
- 11.1.7 First National Battery Pty Ltd
- 11.1.7.1. Company Overview
- 11.1.7.2. Products
- 11.1.7.3. Company Financials
- 11.1.7.4. SWOT Analysis
- 11.1.8 SAFT GROUPE SA
- 11.1.8.1. Company Overview
- 11.1.8.2. Products
- 11.1.8.3. Company Financials
- 11.1.8.4. SWOT Analysis
- 11.1.9 Panasonic Corporation
- 11.1.9.1. Company Overview
- 11.1.9.2. Products
- 11.1.9.3. Company Financials
- 11.1.9.4. SWOT Analysis
- 11.1.1 EnerSys
- 11.2. Market Entropy
- 11.2.1 Company's Key Areas Served
- 11.2.2 Recent Developments
- 11.3. Company Market Share Analysis 2025
- 11.3.1 Top 5 Companies Market Share Analysis
- 11.3.2 Top 3 Companies Market Share Analysis
- 11.4. List of Potential Customers
- 12. Research Methodology
List of Figures
- Figure 1: Global MEA Battery Industry Revenue Breakdown (Million, %) by Region 2025 & 2033
- Figure 2: Global MEA Battery Industry Volume Breakdown (K Unit, %) by Region 2025 & 2033
- Figure 3: Saudi Arabia MEA Battery Industry Revenue (Million), by Type 2025 & 2033
- Figure 4: Saudi Arabia MEA Battery Industry Volume (K Unit), by Type 2025 & 2033
- Figure 5: Saudi Arabia MEA Battery Industry Revenue Share (%), by Type 2025 & 2033
- Figure 6: Saudi Arabia MEA Battery Industry Volume Share (%), by Type 2025 & 2033
- Figure 7: Saudi Arabia MEA Battery Industry Revenue (Million), by Technology 2025 & 2033
- Figure 8: Saudi Arabia MEA Battery Industry Volume (K Unit), by Technology 2025 & 2033
- Figure 9: Saudi Arabia MEA Battery Industry Revenue Share (%), by Technology 2025 & 2033
- Figure 10: Saudi Arabia MEA Battery Industry Volume Share (%), by Technology 2025 & 2033
- Figure 11: Saudi Arabia MEA Battery Industry Revenue (Million), by Application 2025 & 2033
- Figure 12: Saudi Arabia MEA Battery Industry Volume (K Unit), by Application 2025 & 2033
- Figure 13: Saudi Arabia MEA Battery Industry Revenue Share (%), by Application 2025 & 2033
- Figure 14: Saudi Arabia MEA Battery Industry Volume Share (%), by Application 2025 & 2033
- Figure 15: Saudi Arabia MEA Battery Industry Revenue (Million), by Geography 2025 & 2033
- Figure 16: Saudi Arabia MEA Battery Industry Volume (K Unit), by Geography 2025 & 2033
- Figure 17: Saudi Arabia MEA Battery Industry Revenue Share (%), by Geography 2025 & 2033
- Figure 18: Saudi Arabia MEA Battery Industry Volume Share (%), by Geography 2025 & 2033
- Figure 19: Saudi Arabia MEA Battery Industry Revenue (Million), by Country 2025 & 2033
- Figure 20: Saudi Arabia MEA Battery Industry Volume (K Unit), by Country 2025 & 2033
- Figure 21: Saudi Arabia MEA Battery Industry Revenue Share (%), by Country 2025 & 2033
- Figure 22: Saudi Arabia MEA Battery Industry Volume Share (%), by Country 2025 & 2033
- Figure 23: United Arab Emirates MEA Battery Industry Revenue (Million), by Type 2025 & 2033
- Figure 24: United Arab Emirates MEA Battery Industry Volume (K Unit), by Type 2025 & 2033
- Figure 25: United Arab Emirates MEA Battery Industry Revenue Share (%), by Type 2025 & 2033
- Figure 26: United Arab Emirates MEA Battery Industry Volume Share (%), by Type 2025 & 2033
- Figure 27: United Arab Emirates MEA Battery Industry Revenue (Million), by Technology 2025 & 2033
- Figure 28: United Arab Emirates MEA Battery Industry Volume (K Unit), by Technology 2025 & 2033
- Figure 29: United Arab Emirates MEA Battery Industry Revenue Share (%), by Technology 2025 & 2033
- Figure 30: United Arab Emirates MEA Battery Industry Volume Share (%), by Technology 2025 & 2033
- Figure 31: United Arab Emirates MEA Battery Industry Revenue (Million), by Application 2025 & 2033
- Figure 32: United Arab Emirates MEA Battery Industry Volume (K Unit), by Application 2025 & 2033
- Figure 33: United Arab Emirates MEA Battery Industry Revenue Share (%), by Application 2025 & 2033
- Figure 34: United Arab Emirates MEA Battery Industry Volume Share (%), by Application 2025 & 2033
- Figure 35: United Arab Emirates MEA Battery Industry Revenue (Million), by Geography 2025 & 2033
- Figure 36: United Arab Emirates MEA Battery Industry Volume (K Unit), by Geography 2025 & 2033
- Figure 37: United Arab Emirates MEA Battery Industry Revenue Share (%), by Geography 2025 & 2033
- Figure 38: United Arab Emirates MEA Battery Industry Volume Share (%), by Geography 2025 & 2033
- Figure 39: United Arab Emirates MEA Battery Industry Revenue (Million), by Country 2025 & 2033
- Figure 40: United Arab Emirates MEA Battery Industry Volume (K Unit), by Country 2025 & 2033
- Figure 41: United Arab Emirates MEA Battery Industry Revenue Share (%), by Country 2025 & 2033
- Figure 42: United Arab Emirates MEA Battery Industry Volume Share (%), by Country 2025 & 2033
- Figure 43: South Africa MEA Battery Industry Revenue (Million), by Type 2025 & 2033
- Figure 44: South Africa MEA Battery Industry Volume (K Unit), by Type 2025 & 2033
- Figure 45: South Africa MEA Battery Industry Revenue Share (%), by Type 2025 & 2033
- Figure 46: South Africa MEA Battery Industry Volume Share (%), by Type 2025 & 2033
- Figure 47: South Africa MEA Battery Industry Revenue (Million), by Technology 2025 & 2033
- Figure 48: South Africa MEA Battery Industry Volume (K Unit), by Technology 2025 & 2033
- Figure 49: South Africa MEA Battery Industry Revenue Share (%), by Technology 2025 & 2033
- Figure 50: South Africa MEA Battery Industry Volume Share (%), by Technology 2025 & 2033
- Figure 51: South Africa MEA Battery Industry Revenue (Million), by Application 2025 & 2033
- Figure 52: South Africa MEA Battery Industry Volume (K Unit), by Application 2025 & 2033
- Figure 53: South Africa MEA Battery Industry Revenue Share (%), by Application 2025 & 2033
- Figure 54: South Africa MEA Battery Industry Volume Share (%), by Application 2025 & 2033
- Figure 55: South Africa MEA Battery Industry Revenue (Million), by Geography 2025 & 2033
- Figure 56: South Africa MEA Battery Industry Volume (K Unit), by Geography 2025 & 2033
- Figure 57: South Africa MEA Battery Industry Revenue Share (%), by Geography 2025 & 2033
- Figure 58: South Africa MEA Battery Industry Volume Share (%), by Geography 2025 & 2033
- Figure 59: South Africa MEA Battery Industry Revenue (Million), by Country 2025 & 2033
- Figure 60: South Africa MEA Battery Industry Volume (K Unit), by Country 2025 & 2033
- Figure 61: South Africa MEA Battery Industry Revenue Share (%), by Country 2025 & 2033
- Figure 62: South Africa MEA Battery Industry Volume Share (%), by Country 2025 & 2033
- Figure 63: Rest of Middle East and Africa MEA Battery Industry Revenue (Million), by Type 2025 & 2033
- Figure 64: Rest of Middle East and Africa MEA Battery Industry Volume (K Unit), by Type 2025 & 2033
- Figure 65: Rest of Middle East and Africa MEA Battery Industry Revenue Share (%), by Type 2025 & 2033
- Figure 66: Rest of Middle East and Africa MEA Battery Industry Volume Share (%), by Type 2025 & 2033
- Figure 67: Rest of Middle East and Africa MEA Battery Industry Revenue (Million), by Technology 2025 & 2033
- Figure 68: Rest of Middle East and Africa MEA Battery Industry Volume (K Unit), by Technology 2025 & 2033
- Figure 69: Rest of Middle East and Africa MEA Battery Industry Revenue Share (%), by Technology 2025 & 2033
- Figure 70: Rest of Middle East and Africa MEA Battery Industry Volume Share (%), by Technology 2025 & 2033
- Figure 71: Rest of Middle East and Africa MEA Battery Industry Revenue (Million), by Application 2025 & 2033
- Figure 72: Rest of Middle East and Africa MEA Battery Industry Volume (K Unit), by Application 2025 & 2033
- Figure 73: Rest of Middle East and Africa MEA Battery Industry Revenue Share (%), by Application 2025 & 2033
- Figure 74: Rest of Middle East and Africa MEA Battery Industry Volume Share (%), by Application 2025 & 2033
- Figure 75: Rest of Middle East and Africa MEA Battery Industry Revenue (Million), by Geography 2025 & 2033
- Figure 76: Rest of Middle East and Africa MEA Battery Industry Volume (K Unit), by Geography 2025 & 2033
- Figure 77: Rest of Middle East and Africa MEA Battery Industry Revenue Share (%), by Geography 2025 & 2033
- Figure 78: Rest of Middle East and Africa MEA Battery Industry Volume Share (%), by Geography 2025 & 2033
- Figure 79: Rest of Middle East and Africa MEA Battery Industry Revenue (Million), by Country 2025 & 2033
- Figure 80: Rest of Middle East and Africa MEA Battery Industry Volume (K Unit), by Country 2025 & 2033
- Figure 81: Rest of Middle East and Africa MEA Battery Industry Revenue Share (%), by Country 2025 & 2033
- Figure 82: Rest of Middle East and Africa MEA Battery Industry Volume Share (%), by Country 2025 & 2033
List of Tables
- Table 1: Global MEA Battery Industry Revenue Million Forecast, by Type 2020 & 2033
- Table 2: Global MEA Battery Industry Volume K Unit Forecast, by Type 2020 & 2033
- Table 3: Global MEA Battery Industry Revenue Million Forecast, by Technology 2020 & 2033
- Table 4: Global MEA Battery Industry Volume K Unit Forecast, by Technology 2020 & 2033
- Table 5: Global MEA Battery Industry Revenue Million Forecast, by Application 2020 & 2033
- Table 6: Global MEA Battery Industry Volume K Unit Forecast, by Application 2020 & 2033
- Table 7: Global MEA Battery Industry Revenue Million Forecast, by Geography 2020 & 2033
- Table 8: Global MEA Battery Industry Volume K Unit Forecast, by Geography 2020 & 2033
- Table 9: Global MEA Battery Industry Revenue Million Forecast, by Region 2020 & 2033
- Table 10: Global MEA Battery Industry Volume K Unit Forecast, by Region 2020 & 2033
- Table 11: Global MEA Battery Industry Revenue Million Forecast, by Type 2020 & 2033
- Table 12: Global MEA Battery Industry Volume K Unit Forecast, by Type 2020 & 2033
- Table 13: Global MEA Battery Industry Revenue Million Forecast, by Technology 2020 & 2033
- Table 14: Global MEA Battery Industry Volume K Unit Forecast, by Technology 2020 & 2033
- Table 15: Global MEA Battery Industry Revenue Million Forecast, by Application 2020 & 2033
- Table 16: Global MEA Battery Industry Volume K Unit Forecast, by Application 2020 & 2033
- Table 17: Global MEA Battery Industry Revenue Million Forecast, by Geography 2020 & 2033
- Table 18: Global MEA Battery Industry Volume K Unit Forecast, by Geography 2020 & 2033
- Table 19: Global MEA Battery Industry Revenue Million Forecast, by Country 2020 & 2033
- Table 20: Global MEA Battery Industry Volume K Unit Forecast, by Country 2020 & 2033
- Table 21: Global MEA Battery Industry Revenue Million Forecast, by Type 2020 & 2033
- Table 22: Global MEA Battery Industry Volume K Unit Forecast, by Type 2020 & 2033
- Table 23: Global MEA Battery Industry Revenue Million Forecast, by Technology 2020 & 2033
- Table 24: Global MEA Battery Industry Volume K Unit Forecast, by Technology 2020 & 2033
- Table 25: Global MEA Battery Industry Revenue Million Forecast, by Application 2020 & 2033
- Table 26: Global MEA Battery Industry Volume K Unit Forecast, by Application 2020 & 2033
- Table 27: Global MEA Battery Industry Revenue Million Forecast, by Geography 2020 & 2033
- Table 28: Global MEA Battery Industry Volume K Unit Forecast, by Geography 2020 & 2033
- Table 29: Global MEA Battery Industry Revenue Million Forecast, by Country 2020 & 2033
- Table 30: Global MEA Battery Industry Volume K Unit Forecast, by Country 2020 & 2033
- Table 31: Global MEA Battery Industry Revenue Million Forecast, by Type 2020 & 2033
- Table 32: Global MEA Battery Industry Volume K Unit Forecast, by Type 2020 & 2033
- Table 33: Global MEA Battery Industry Revenue Million Forecast, by Technology 2020 & 2033
- Table 34: Global MEA Battery Industry Volume K Unit Forecast, by Technology 2020 & 2033
- Table 35: Global MEA Battery Industry Revenue Million Forecast, by Application 2020 & 2033
- Table 36: Global MEA Battery Industry Volume K Unit Forecast, by Application 2020 & 2033
- Table 37: Global MEA Battery Industry Revenue Million Forecast, by Geography 2020 & 2033
- Table 38: Global MEA Battery Industry Volume K Unit Forecast, by Geography 2020 & 2033
- Table 39: Global MEA Battery Industry Revenue Million Forecast, by Country 2020 & 2033
- Table 40: Global MEA Battery Industry Volume K Unit Forecast, by Country 2020 & 2033
- Table 41: Global MEA Battery Industry Revenue Million Forecast, by Type 2020 & 2033
- Table 42: Global MEA Battery Industry Volume K Unit Forecast, by Type 2020 & 2033
- Table 43: Global MEA Battery Industry Revenue Million Forecast, by Technology 2020 & 2033
- Table 44: Global MEA Battery Industry Volume K Unit Forecast, by Technology 2020 & 2033
- Table 45: Global MEA Battery Industry Revenue Million Forecast, by Application 2020 & 2033
- Table 46: Global MEA Battery Industry Volume K Unit Forecast, by Application 2020 & 2033
- Table 47: Global MEA Battery Industry Revenue Million Forecast, by Geography 2020 & 2033
- Table 48: Global MEA Battery Industry Volume K Unit Forecast, by Geography 2020 & 2033
- Table 49: Global MEA Battery Industry Revenue Million Forecast, by Country 2020 & 2033
- Table 50: Global MEA Battery Industry Volume K Unit Forecast, by Country 2020 & 2033
Frequently Asked Questions
1. What is the projected Compound Annual Growth Rate (CAGR) of the MEA Battery Industry?
The projected CAGR is approximately > 7.00%.
2. Which companies are prominent players in the MEA Battery Industry?
Key companies in the market include EnerSys, East Penn Manufacturing Co Inc, Exide Industries Ltd, Amara Raja Batteries Ltd, Middle East Battery Company (MEBCO), C&D Technologies Inc, First National Battery Pty Ltd, SAFT GROUPE SA, Panasonic Corporation.
3. What are the main segments of the MEA Battery Industry?
The market segments include Type, Technology, Application, Geography.
4. Can you provide details about the market size?
The market size is estimated to be USD 7.06 Million as of 2022.
5. What are some drivers contributing to market growth?
4.; Declining lithium-ion battery prices4.; Increasing adoption of electric vehicles.
6. What are the notable trends driving market growth?
Automotive Batteries Segment to Witness Significant Growth.
7. Are there any restraints impacting market growth?
4.; Demand-supply mismatch of raw materials.
8. Can you provide examples of recent developments in the market?
Aug 2023: Mahindra & Mahindra, India's fourth largest car manufacturer, unveiled the electric version of the Thar SUV at an event in South Africa. Apart from the Thar.e, Mahindra also unveiled seven new tractor models at the event in Cape Town, South Africa.
9. What pricing options are available for accessing the report?
Pricing options include single-user, multi-user, and enterprise licenses priced at USD 4750, USD 5250, and USD 8750 respectively.
10. Is the market size provided in terms of value or volume?
The market size is provided in terms of value, measured in Million and volume, measured in K Unit.
11. Are there any specific market keywords associated with the report?
Yes, the market keyword associated with the report is "MEA Battery Industry," which aids in identifying and referencing the specific market segment covered.
12. How do I determine which pricing option suits my needs best?
The pricing options vary based on user requirements and access needs. Individual users may opt for single-user licenses, while businesses requiring broader access may choose multi-user or enterprise licenses for cost-effective access to the report.
13. Are there any additional resources or data provided in the MEA Battery Industry report?
While the report offers comprehensive insights, it's advisable to review the specific contents or supplementary materials provided to ascertain if additional resources or data are available.
14. How can I stay updated on further developments or reports in the MEA Battery Industry?
To stay informed about further developments, trends, and reports in the MEA Battery Industry, consider subscribing to industry newsletters, following relevant companies and organizations, or regularly checking reputable industry news sources and publications.
Methodology
Step 1 - Identification of Relevant Samples Size from Population Database


Step 2 - Approaches for Defining Global Market Size (Value, Volume* & Price*)

Note*: In applicable scenarios
Step 3 - Data Sources
Primary Research
- Web Analytics
- Survey Reports
- Research Institute
- Latest Research Reports
- Opinion Leaders
Secondary Research
- Annual Reports
- White Paper
- Latest Press Release
- Industry Association
- Paid Database
- Investor Presentations

Step 4 - Data Triangulation
Involves using different sources of information in order to increase the validity of a study
These sources are likely to be stakeholders in a program - participants, other researchers, program staff, other community members, and so on.
Then we put all data in single framework & apply various statistical tools to find out the dynamic on the market.
During the analysis stage, feedback from the stakeholder groups would be compared to determine areas of agreement as well as areas of divergence