

Key Insights
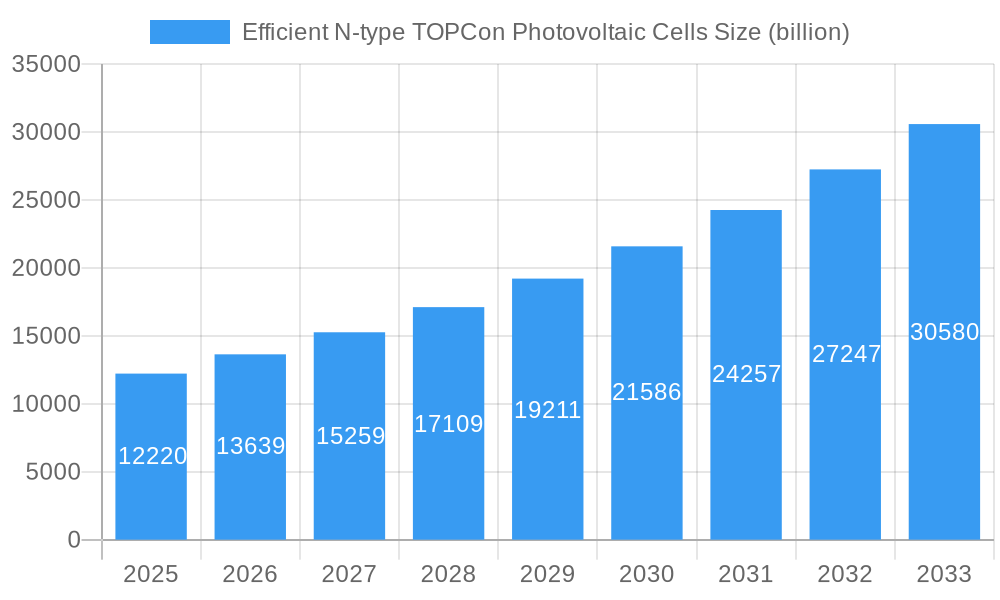
The Efficient N-type TOPCon Photovoltaic Cells market is poised for substantial growth, projected to reach an estimated $12.22 billion in 2025. This surge is underpinned by a robust Compound Annual Growth Rate (CAGR) of 11.6% during the forecast period of 2025-2033. This impressive expansion is driven by a confluence of factors, including the escalating global demand for renewable energy solutions, increasing government incentives and supportive policies aimed at promoting solar adoption, and the continuous technological advancements in photovoltaic cell efficiency. The superior performance characteristics of N-type TOPCon cells, such as higher power output, improved low-light performance, and enhanced durability compared to conventional technologies, are making them the preferred choice across diverse applications. The energy and power sector, consumer electronics, construction, automotive, and industrial segments are all significant contributors to this market's growth trajectory, reflecting the versatility and broad applicability of these advanced solar cells.
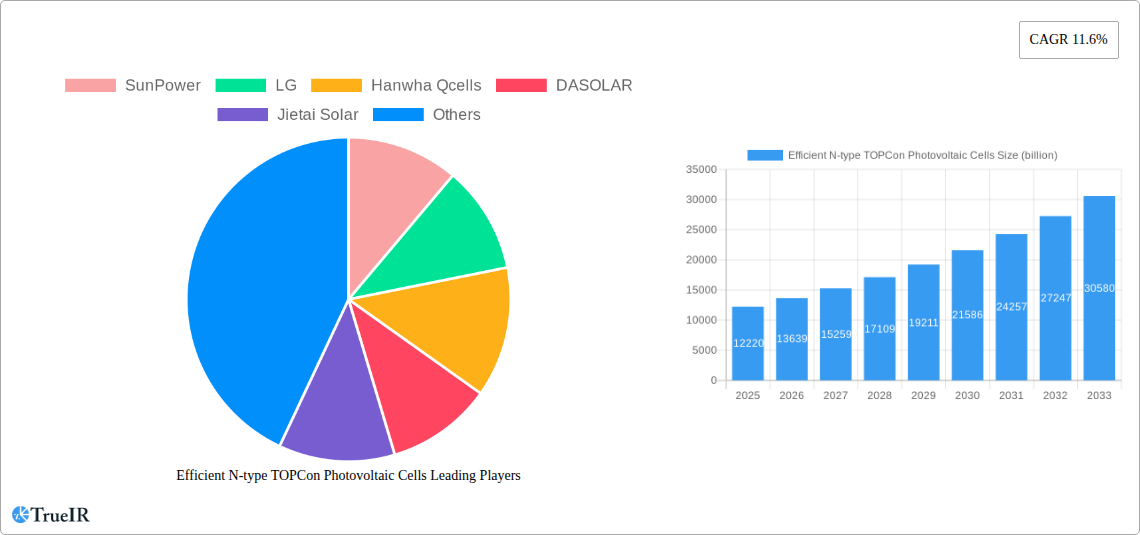
Efficient N-type TOPCon Photovoltaic Cells Market Size (In Billion)
While the market is experiencing strong upward momentum, certain restraints need to be navigated. These include the initial higher manufacturing costs associated with N-type TOPCon technology and the ongoing need for skilled labor and specialized infrastructure for their production and installation. Nevertheless, ongoing research and development efforts are focused on optimizing production processes, driving down costs, and further enhancing efficiency, which are expected to mitigate these challenges over the long term. Key trends shaping the market include the increasing integration of TOPCon cells into bifacial solar modules, advancements in materials science for further efficiency gains, and the growing adoption of these cells in distributed generation and utility-scale solar projects alike. Companies like SunPower, LG, Hanwha Qcells, and Jinko Solar are at the forefront of innovation, investing heavily in R&D and expanding their production capacities to meet the surging global demand for these high-performance photovoltaic solutions.
Efficient N-type TOPCon Photovoltaic Cells Company Market Share
Efficient N-type TOPCon Photovoltaic Cells Market Structure & Competitive Landscape
The global Efficient N-type TOPCon Photovoltaic Cells market is characterized by a moderately concentrated structure, with leading players like Jinko Solar, LONGi Solar (not listed but a major player), Trina Solar, JA Solar Technology Co., Ltd., and RISEN ENERGY CO., LTD. controlling a significant market share exceeding thirty billion USD in revenue. Innovation is the primary driver, fueled by continuous research and development in cell efficiency, degradation rates, and manufacturing processes, projected to reach over one billion USD in R&D investment by 2025. Regulatory impacts are also substantial, with government incentives and solar energy mandates, particularly in regions like China and Europe, significantly influencing market growth. Product substitutes, primarily PERC technology, are gradually being displaced by the superior performance of TOPCon, leading to a diminishing market share for older technologies. End-user segmentation is diverse, spanning utility-scale power generation, residential rooftops, and commercial installations, each with distinct demands and adoption rates. Mergers and acquisitions (M&A) activity, while not at peak levels, remains a strategic tool for market consolidation and technology acquisition, with an estimated twenty billion USD in M&A deals observed during the historical period.
Efficient N-type TOPCon Photovoltaic Cells Market Trends & Opportunities
The Efficient N-type TOPCon Photovoltaic Cells market is experiencing robust growth, with an estimated market size projected to surpass five hundred billion USD by 2033. This expansion is driven by a compound annual growth rate (CAGR) of approximately fifteen percent during the forecast period (2025-2033). Technological advancements are at the forefront, with continuous improvements in cell architecture, material science, and manufacturing techniques leading to higher power conversion efficiencies, consistently breaking the twenty-five percent efficiency barrier. The shift towards N-type TOPCon technology is a significant trend, driven by its inherent advantages over traditional P-type PERC cells, including lower light-induced degradation and improved temperature coefficients, translating to higher energy yields over the lifetime of the solar installation. Consumer preferences are increasingly leaning towards high-efficiency, long-lasting solar solutions, especially for rooftop and distributed generation applications where space is limited. Manufacturers are responding by investing heavily in R&D to reduce production costs and further enhance performance. Competitive dynamics are intense, with established players and emerging manufacturers vying for market share. Companies are focusing on vertical integration, supply chain optimization, and strategic partnerships to gain a competitive edge. The increasing demand for clean energy solutions globally, coupled with supportive government policies and falling installation costs, are creating substantial opportunities for market penetration and expansion. The integration of TOPCon cells into building-integrated photovoltaics (BIPV) and other novel applications presents further avenues for growth. The development of advanced encapsulation materials and bifacial TOPCon modules is also contributing to increased energy generation capabilities. The global push towards decarbonization and achieving net-zero emissions targets is a fundamental catalyst, driving significant investment in solar energy infrastructure worldwide. The market penetration rate for N-type TOPCon is expected to rise dramatically, potentially exceeding sixty percent of the total solar PV market by 2033.
Dominant Markets & Segments in Efficient N-type TOPCon Photovoltaic Cells
The Energy & Power application segment stands as the dominant force in the Efficient N-type TOPCon Photovoltaic Cells market, accounting for an estimated seventy percent of the global market share. Within this segment, utility-scale solar farms are the primary consumers, driven by large-scale renewable energy targets and the need for cost-effective, high-yield power generation.
- Key Growth Drivers in Energy & Power:
- Government Policies and Incentives: Favorable feed-in tariffs, tax credits, and renewable portfolio standards in major economies like China, the United States, and those within the European Union are critical. For instance, China's ambitious renewable energy targets are projected to drive over one hundred billion USD in solar installations annually.
- Declining Levelized Cost of Electricity (LCOE): The continuous improvement in TOPCon cell efficiency and manufacturing scale is making solar power increasingly competitive with traditional fossil fuels, making it the cheapest source of new electricity generation in many regions.
- Grid Modernization and Energy Security: Investments in grid infrastructure and the desire for energy independence are spurring the adoption of solar power.
- Corporate Power Purchase Agreements (PPAs): A growing number of corporations are committing to sourcing renewable energy through PPAs, further boosting demand for utility-scale solar projects.
Geographically, Asia Pacific, particularly China, is the leading market, contributing over fifty-five percent of global demand. China's massive manufacturing capacity and strong domestic market create a virtuous cycle of innovation and cost reduction. Other significant markets include Europe, driven by ambitious climate goals, and North America, supported by federal and state-level incentives.
In terms of Types, Monocrystalline TOPCon cells dominate the market, commanding an estimated ninety-five percent of the segment's revenue. Their higher efficiency and superior aesthetics make them the preferred choice for most applications.
- Key Growth Drivers in Monocrystalline TOPCon:
- Superior Efficiency: Monocrystalline silicon offers higher purity and fewer defects, leading to greater light absorption and higher power output per unit area compared to polycrystalline silicon.
- Aesthetics and Space Optimization: The uniform dark color and compact cell structure of monocrystalline panels are preferred for residential and commercial rooftop installations where aesthetic appeal and efficient use of space are important.
- Technological Advancements: Ongoing research in monocrystalline silicon ingot growth and wafer manufacturing further enhances their performance and cost-effectiveness.
While Polycrystalline TOPCon cells exist, their market share is rapidly declining, representing a niche segment within the broader TOPCon market. The superior performance and cost-competitiveness of monocrystalline TOPCon have largely superseded polycrystalline alternatives. The Consumer Electronics, Construction, Automobile, Industrial, and Agricultural segments are considered secondary markets, contributing a combined estimated twenty percent of the total market value, with significant growth potential in the construction and automobile sectors for integrated solar solutions.
Efficient N-type TOPCon Photovoltaic Cells Product Analysis
The Efficient N-type TOPCon Photovoltaic Cells represent a significant leap in solar technology, offering superior performance characteristics compared to their predecessors. Key product innovations include enhanced passivation layers that minimize electron recombination, leading to significantly higher power conversion efficiencies that consistently exceed twenty-five percent. These cells exhibit lower degradation rates under sunlight (light-induced degradation) and perform better in high-temperature environments, resulting in a higher annual energy yield. Their bifacial capabilities, allowing for energy capture from both sides, further boost output by an additional ten to twenty percent. This technological advancement makes them highly competitive for a wide range of applications, from utility-scale power plants demanding maximum output to residential installations where space efficiency is paramount.
Key Drivers, Barriers & Challenges in Efficient N-type TOPCon Photovoltaic Cells
Key Drivers:
- Technological Advancements: The inherent efficiency advantage of N-type TOPCon over PERC technology, offering higher power output and better performance in varying conditions, is a primary driver.
- Supportive Government Policies: Global mandates for renewable energy, tax incentives, and subsidies are accelerating adoption. For instance, the US Inflation Reduction Act is expected to inject billions into the solar industry.
- Decreasing LCOE: Continuous manufacturing scale-up and process optimization are driving down the cost of solar electricity, making it increasingly competitive with fossil fuels.
- Environmental Concerns & Climate Change Mitigation: The urgent need to reduce carbon emissions and combat climate change is a powerful catalyst for solar deployment.
Barriers & Challenges:
- Supply Chain Dependencies: Reliance on specific raw materials and manufacturing equipment, particularly from a limited number of suppliers, can create vulnerabilities. Geopolitical factors can significantly impact supply chain stability.
- Capital Investment: The initial cost of setting up advanced N-type TOPCon manufacturing facilities requires substantial capital outlay.
- Intermittency of Solar Power: The inherent nature of solar energy requires reliable energy storage solutions and grid integration strategies, which are still evolving.
- Competition from Emerging Technologies: While TOPCon is dominant, ongoing research into other advanced solar cell technologies could present future competition.
Growth Drivers in the Efficient N-type TOPCon Photovoltaic Cells Market
The Efficient N-type TOPCon Photovoltaic Cells market is propelled by a confluence of powerful growth drivers. Technological innovation, particularly the inherent efficiency gains and improved performance characteristics of N-type TOPCon over existing technologies, is paramount. This is amplified by robust government support mechanisms, including renewable energy targets, tax credits, and favorable feed-in tariffs, which are creating a highly conducive investment climate. The steadily declining Levelized Cost of Electricity (LCOE) for solar power makes it an increasingly attractive and cost-competitive energy source globally. Furthermore, the intensifying global imperative to address climate change and reduce carbon emissions is a significant underlying driver, pushing for rapid decarbonization of energy systems.
Challenges Impacting Efficient N-type TOPCon Photovoltaic Cells Growth
Despite the strong growth trajectory, the Efficient N-type TOPCon Photovoltaic Cells market faces several critical challenges. Significant capital investment is required to establish and scale advanced manufacturing facilities for N-type TOPCon production, posing a barrier to entry for smaller players. Supply chain vulnerabilities, including potential shortages of critical raw materials and reliance on specific geographic regions for components, present ongoing risks. Regulatory complexities and the need for streamlined permitting processes in various regions can also slow down project development. Moreover, the intermittency of solar power necessitates the development and widespread adoption of effective energy storage solutions and sophisticated grid integration technologies to ensure reliable electricity supply.
Key Players Shaping the Efficient N-type TOPCon Photovoltaic Cells Market
SunPower LG Hanwha Qcells DASOLAR Jietai Solar Jinko Solar LUXOR Solar Boviet Solar NorSun Trina Solar DAH Solar ShunFeng Photovoltaic EGing Photovoltaic JA Solar Technology Co.,Ltd. Shenzhen S.C New Energy Technology Corporation AIKO RISEN ENERGY CO.,LTD.
Significant Efficient N-type TOPCon Photovoltaic Cells Industry Milestones
- 2019: Initial commercialization and scaling of N-type TOPCon cell technology by leading manufacturers, marking a significant shift from PERC dominance.
- 2020: Breakthroughs in passivation techniques leading to module efficiencies consistently above twenty-four percent.
- 2021: Increased investment in N-type TOPCon manufacturing capacity globally, particularly in China, to meet growing demand.
- 2022: Emergence of bifacial N-type TOPCon modules gaining significant market traction due to enhanced energy yield.
- 2023: Further cost reductions in N-type TOPCon wafer production, making the technology more competitive.
- 2024 (Estimated): Expected announcement of new manufacturing facilities with capacities exceeding one billion watts by multiple key players.
- 2025 (Projected): N-type TOPCon cells are forecast to capture over thirty percent of the global solar PV market share.
Future Outlook for Efficient N-type TOPCon Photovoltaic Cells Market
The future outlook for the Efficient N-type TOPCon Photovoltaic Cells market is exceptionally bright, poised for sustained high growth through 2033. Key growth catalysts include ongoing technological innovations that will further push efficiency limits beyond twenty-six percent and reduce degradation to negligible levels. Supportive global policies aimed at achieving net-zero emissions will continue to drive massive investments in solar infrastructure, creating substantial market potential. Strategic opportunities lie in the further integration of TOPCon technology into emerging applications like floating solar farms and advanced building-integrated photovoltaics (BIPV). The continued reduction in manufacturing costs, driven by economies of scale and process optimization, will solidify TOPCon's position as the dominant photovoltaic technology for the foreseeable future.
Efficient N-type TOPCon Photovoltaic Cells Segmentation
-
1. Application
- 1.1. Energy & Power
- 1.2. Consumer Electronics
- 1.3. Construction
- 1.4. Automobile
- 1.5. Industrial
- 1.6. Agricultural
- 1.7. Others
-
2. Types
- 2.1. Monocrystalline
- 2.2. Polycrystalline
Efficient N-type TOPCon Photovoltaic Cells Segmentation By Geography
-
1. North America
- 1.1. United States
- 1.2. Canada
- 1.3. Mexico
-
2. South America
- 2.1. Brazil
- 2.2. Argentina
- 2.3. Rest of South America
-
3. Europe
- 3.1. United Kingdom
- 3.2. Germany
- 3.3. France
- 3.4. Italy
- 3.5. Spain
- 3.6. Russia
- 3.7. Benelux
- 3.8. Nordics
- 3.9. Rest of Europe
-
4. Middle East & Africa
- 4.1. Turkey
- 4.2. Israel
- 4.3. GCC
- 4.4. North Africa
- 4.5. South Africa
- 4.6. Rest of Middle East & Africa
-
5. Asia Pacific
- 5.1. China
- 5.2. India
- 5.3. Japan
- 5.4. South Korea
- 5.5. ASEAN
- 5.6. Oceania
- 5.7. Rest of Asia Pacific
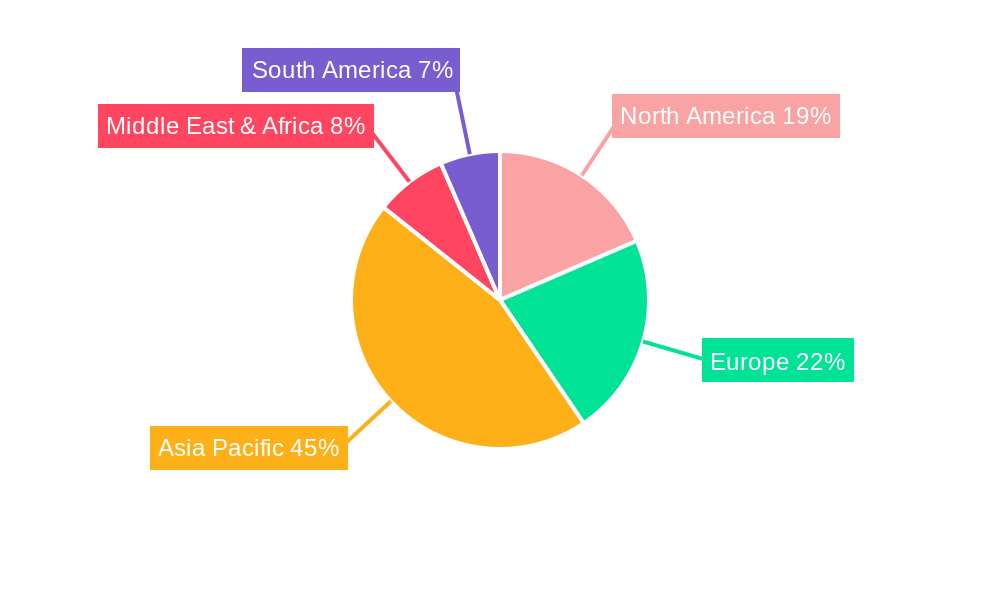
Efficient N-type TOPCon Photovoltaic Cells Regional Market Share
Geographic Coverage of Efficient N-type TOPCon Photovoltaic Cells
Efficient N-type TOPCon Photovoltaic Cells REPORT HIGHLIGHTS
| Aspects | Details |
|---|---|
| Study Period | 2020-2034 |
| Base Year | 2025 |
| Estimated Year | 2026 |
| Forecast Period | 2026-2034 |
| Historical Period | 2020-2025 |
| Growth Rate | CAGR of 11.6% from 2020-2034 |
| Segmentation |
|
Table of Contents
- 1. Introduction
- 1.1. Research Scope
- 1.2. Market Segmentation
- 1.3. Research Objective
- 1.4. Definitions and Assumptions
- 2. Executive Summary
- 2.1. Market Snapshot
- 3. Market Dynamics
- 3.1. Market Drivers
- 3.2. Market Restrains
- 3.3. Market Trends
- 3.4. Market Opportunities
- 4. Market Factor Analysis
- 4.1. Porters Five Forces
- 4.1.1. Bargaining Power of Suppliers
- 4.1.2. Bargaining Power of Buyers
- 4.1.3. Threat of New Entrants
- 4.1.4. Threat of Substitutes
- 4.1.5. Competitive Rivalry
- 4.2. PESTEL analysis
- 4.3. BCG Analysis
- 4.3.1. Stars (High Growth, High Market Share)
- 4.3.2. Cash Cows (Low Growth, High Market Share)
- 4.3.3. Question Mark (High Growth, Low Market Share)
- 4.3.4. Dogs (Low Growth, Low Market Share)
- 4.4. Ansoff Matrix Analysis
- 4.5. Supply Chain Analysis
- 4.6. Regulatory Landscape
- 4.7. Current Market Potential and Opportunity Assessment (TAM–SAM–SOM Framework)
- 4.8. TIR Analyst Note
- 4.1. Porters Five Forces
- 5. Market Analysis, Insights and Forecast 2021-2033
- 5.1. Market Analysis, Insights and Forecast - by Application
- 5.1.1. Energy & Power
- 5.1.2. Consumer Electronics
- 5.1.3. Construction
- 5.1.4. Automobile
- 5.1.5. Industrial
- 5.1.6. Agricultural
- 5.1.7. Others
- 5.2. Market Analysis, Insights and Forecast - by Types
- 5.2.1. Monocrystalline
- 5.2.2. Polycrystalline
- 5.3. Market Analysis, Insights and Forecast - by Region
- 5.3.1. North America
- 5.3.2. South America
- 5.3.3. Europe
- 5.3.4. Middle East & Africa
- 5.3.5. Asia Pacific
- 5.1. Market Analysis, Insights and Forecast - by Application
- 6. Global Efficient N-type TOPCon Photovoltaic Cells Analysis, Insights and Forecast, 2021-2033
- 6.1. Market Analysis, Insights and Forecast - by Application
- 6.1.1. Energy & Power
- 6.1.2. Consumer Electronics
- 6.1.3. Construction
- 6.1.4. Automobile
- 6.1.5. Industrial
- 6.1.6. Agricultural
- 6.1.7. Others
- 6.2. Market Analysis, Insights and Forecast - by Types
- 6.2.1. Monocrystalline
- 6.2.2. Polycrystalline
- 6.1. Market Analysis, Insights and Forecast - by Application
- 7. North America Efficient N-type TOPCon Photovoltaic Cells Analysis, Insights and Forecast, 2020-2032
- 7.1. Market Analysis, Insights and Forecast - by Application
- 7.1.1. Energy & Power
- 7.1.2. Consumer Electronics
- 7.1.3. Construction
- 7.1.4. Automobile
- 7.1.5. Industrial
- 7.1.6. Agricultural
- 7.1.7. Others
- 7.2. Market Analysis, Insights and Forecast - by Types
- 7.2.1. Monocrystalline
- 7.2.2. Polycrystalline
- 7.1. Market Analysis, Insights and Forecast - by Application
- 8. South America Efficient N-type TOPCon Photovoltaic Cells Analysis, Insights and Forecast, 2020-2032
- 8.1. Market Analysis, Insights and Forecast - by Application
- 8.1.1. Energy & Power
- 8.1.2. Consumer Electronics
- 8.1.3. Construction
- 8.1.4. Automobile
- 8.1.5. Industrial
- 8.1.6. Agricultural
- 8.1.7. Others
- 8.2. Market Analysis, Insights and Forecast - by Types
- 8.2.1. Monocrystalline
- 8.2.2. Polycrystalline
- 8.1. Market Analysis, Insights and Forecast - by Application
- 9. Europe Efficient N-type TOPCon Photovoltaic Cells Analysis, Insights and Forecast, 2020-2032
- 9.1. Market Analysis, Insights and Forecast - by Application
- 9.1.1. Energy & Power
- 9.1.2. Consumer Electronics
- 9.1.3. Construction
- 9.1.4. Automobile
- 9.1.5. Industrial
- 9.1.6. Agricultural
- 9.1.7. Others
- 9.2. Market Analysis, Insights and Forecast - by Types
- 9.2.1. Monocrystalline
- 9.2.2. Polycrystalline
- 9.1. Market Analysis, Insights and Forecast - by Application
- 10. Middle East & Africa Efficient N-type TOPCon Photovoltaic Cells Analysis, Insights and Forecast, 2020-2032
- 10.1. Market Analysis, Insights and Forecast - by Application
- 10.1.1. Energy & Power
- 10.1.2. Consumer Electronics
- 10.1.3. Construction
- 10.1.4. Automobile
- 10.1.5. Industrial
- 10.1.6. Agricultural
- 10.1.7. Others
- 10.2. Market Analysis, Insights and Forecast - by Types
- 10.2.1. Monocrystalline
- 10.2.2. Polycrystalline
- 10.1. Market Analysis, Insights and Forecast - by Application
- 11. Asia Pacific Efficient N-type TOPCon Photovoltaic Cells Analysis, Insights and Forecast, 2020-2032
- 11.1. Market Analysis, Insights and Forecast - by Application
- 11.1.1. Energy & Power
- 11.1.2. Consumer Electronics
- 11.1.3. Construction
- 11.1.4. Automobile
- 11.1.5. Industrial
- 11.1.6. Agricultural
- 11.1.7. Others
- 11.2. Market Analysis, Insights and Forecast - by Types
- 11.2.1. Monocrystalline
- 11.2.2. Polycrystalline
- 11.1. Market Analysis, Insights and Forecast - by Application
- 12. Competitive Analysis
- 12.1. Company Profiles
- 12.1.1 SunPower
- 12.1.1.1. Company Overview
- 12.1.1.2. Products
- 12.1.1.3. Company Financials
- 12.1.1.4. SWOT Analysis
- 12.1.2 LG
- 12.1.2.1. Company Overview
- 12.1.2.2. Products
- 12.1.2.3. Company Financials
- 12.1.2.4. SWOT Analysis
- 12.1.3 Hanwha Qcells
- 12.1.3.1. Company Overview
- 12.1.3.2. Products
- 12.1.3.3. Company Financials
- 12.1.3.4. SWOT Analysis
- 12.1.4 DASOLAR
- 12.1.4.1. Company Overview
- 12.1.4.2. Products
- 12.1.4.3. Company Financials
- 12.1.4.4. SWOT Analysis
- 12.1.5 Jietai Solar
- 12.1.5.1. Company Overview
- 12.1.5.2. Products
- 12.1.5.3. Company Financials
- 12.1.5.4. SWOT Analysis
- 12.1.6 Jinko Solar
- 12.1.6.1. Company Overview
- 12.1.6.2. Products
- 12.1.6.3. Company Financials
- 12.1.6.4. SWOT Analysis
- 12.1.7 LUXOR Solar
- 12.1.7.1. Company Overview
- 12.1.7.2. Products
- 12.1.7.3. Company Financials
- 12.1.7.4. SWOT Analysis
- 12.1.8 Boviet Solar
- 12.1.8.1. Company Overview
- 12.1.8.2. Products
- 12.1.8.3. Company Financials
- 12.1.8.4. SWOT Analysis
- 12.1.9 NorSun
- 12.1.9.1. Company Overview
- 12.1.9.2. Products
- 12.1.9.3. Company Financials
- 12.1.9.4. SWOT Analysis
- 12.1.10 Trina Solar
- 12.1.10.1. Company Overview
- 12.1.10.2. Products
- 12.1.10.3. Company Financials
- 12.1.10.4. SWOT Analysis
- 12.1.11 DAH Solar
- 12.1.11.1. Company Overview
- 12.1.11.2. Products
- 12.1.11.3. Company Financials
- 12.1.11.4. SWOT Analysis
- 12.1.12 ShunFeng Photovoltaic
- 12.1.12.1. Company Overview
- 12.1.12.2. Products
- 12.1.12.3. Company Financials
- 12.1.12.4. SWOT Analysis
- 12.1.13 EGing Photovoltaic
- 12.1.13.1. Company Overview
- 12.1.13.2. Products
- 12.1.13.3. Company Financials
- 12.1.13.4. SWOT Analysis
- 12.1.14 JA Solar Technology Co.
- 12.1.14.1. Company Overview
- 12.1.14.2. Products
- 12.1.14.3. Company Financials
- 12.1.14.4. SWOT Analysis
- 12.1.15 Ltd.
- 12.1.15.1. Company Overview
- 12.1.15.2. Products
- 12.1.15.3. Company Financials
- 12.1.15.4. SWOT Analysis
- 12.1.16 Shenzhen S.C New Energy Technology Corporation
- 12.1.16.1. Company Overview
- 12.1.16.2. Products
- 12.1.16.3. Company Financials
- 12.1.16.4. SWOT Analysis
- 12.1.17 AIKO
- 12.1.17.1. Company Overview
- 12.1.17.2. Products
- 12.1.17.3. Company Financials
- 12.1.17.4. SWOT Analysis
- 12.1.18 RISEN ENERGY CO.
- 12.1.18.1. Company Overview
- 12.1.18.2. Products
- 12.1.18.3. Company Financials
- 12.1.18.4. SWOT Analysis
- 12.1.19 LTD.
- 12.1.19.1. Company Overview
- 12.1.19.2. Products
- 12.1.19.3. Company Financials
- 12.1.19.4. SWOT Analysis
- 12.1.1 SunPower
- 12.2. Market Entropy
- 12.2.1 Company's Key Areas Served
- 12.2.2 Recent Developments
- 12.3. Company Market Share Analysis 2025
- 12.3.1 Top 5 Companies Market Share Analysis
- 12.3.2 Top 3 Companies Market Share Analysis
- 12.4. List of Potential Customers
- 13. Research Methodology
List of Figures
- Figure 1: Global Efficient N-type TOPCon Photovoltaic Cells Revenue Breakdown (billion, %) by Region 2025 & 2033
- Figure 2: North America Efficient N-type TOPCon Photovoltaic Cells Revenue (billion), by Application 2025 & 2033
- Figure 3: North America Efficient N-type TOPCon Photovoltaic Cells Revenue Share (%), by Application 2025 & 2033
- Figure 4: North America Efficient N-type TOPCon Photovoltaic Cells Revenue (billion), by Types 2025 & 2033
- Figure 5: North America Efficient N-type TOPCon Photovoltaic Cells Revenue Share (%), by Types 2025 & 2033
- Figure 6: North America Efficient N-type TOPCon Photovoltaic Cells Revenue (billion), by Country 2025 & 2033
- Figure 7: North America Efficient N-type TOPCon Photovoltaic Cells Revenue Share (%), by Country 2025 & 2033
- Figure 8: South America Efficient N-type TOPCon Photovoltaic Cells Revenue (billion), by Application 2025 & 2033
- Figure 9: South America Efficient N-type TOPCon Photovoltaic Cells Revenue Share (%), by Application 2025 & 2033
- Figure 10: South America Efficient N-type TOPCon Photovoltaic Cells Revenue (billion), by Types 2025 & 2033
- Figure 11: South America Efficient N-type TOPCon Photovoltaic Cells Revenue Share (%), by Types 2025 & 2033
- Figure 12: South America Efficient N-type TOPCon Photovoltaic Cells Revenue (billion), by Country 2025 & 2033
- Figure 13: South America Efficient N-type TOPCon Photovoltaic Cells Revenue Share (%), by Country 2025 & 2033
- Figure 14: Europe Efficient N-type TOPCon Photovoltaic Cells Revenue (billion), by Application 2025 & 2033
- Figure 15: Europe Efficient N-type TOPCon Photovoltaic Cells Revenue Share (%), by Application 2025 & 2033
- Figure 16: Europe Efficient N-type TOPCon Photovoltaic Cells Revenue (billion), by Types 2025 & 2033
- Figure 17: Europe Efficient N-type TOPCon Photovoltaic Cells Revenue Share (%), by Types 2025 & 2033
- Figure 18: Europe Efficient N-type TOPCon Photovoltaic Cells Revenue (billion), by Country 2025 & 2033
- Figure 19: Europe Efficient N-type TOPCon Photovoltaic Cells Revenue Share (%), by Country 2025 & 2033
- Figure 20: Middle East & Africa Efficient N-type TOPCon Photovoltaic Cells Revenue (billion), by Application 2025 & 2033
- Figure 21: Middle East & Africa Efficient N-type TOPCon Photovoltaic Cells Revenue Share (%), by Application 2025 & 2033
- Figure 22: Middle East & Africa Efficient N-type TOPCon Photovoltaic Cells Revenue (billion), by Types 2025 & 2033
- Figure 23: Middle East & Africa Efficient N-type TOPCon Photovoltaic Cells Revenue Share (%), by Types 2025 & 2033
- Figure 24: Middle East & Africa Efficient N-type TOPCon Photovoltaic Cells Revenue (billion), by Country 2025 & 2033
- Figure 25: Middle East & Africa Efficient N-type TOPCon Photovoltaic Cells Revenue Share (%), by Country 2025 & 2033
- Figure 26: Asia Pacific Efficient N-type TOPCon Photovoltaic Cells Revenue (billion), by Application 2025 & 2033
- Figure 27: Asia Pacific Efficient N-type TOPCon Photovoltaic Cells Revenue Share (%), by Application 2025 & 2033
- Figure 28: Asia Pacific Efficient N-type TOPCon Photovoltaic Cells Revenue (billion), by Types 2025 & 2033
- Figure 29: Asia Pacific Efficient N-type TOPCon Photovoltaic Cells Revenue Share (%), by Types 2025 & 2033
- Figure 30: Asia Pacific Efficient N-type TOPCon Photovoltaic Cells Revenue (billion), by Country 2025 & 2033
- Figure 31: Asia Pacific Efficient N-type TOPCon Photovoltaic Cells Revenue Share (%), by Country 2025 & 2033
List of Tables
- Table 1: Global Efficient N-type TOPCon Photovoltaic Cells Revenue billion Forecast, by Application 2020 & 2033
- Table 2: Global Efficient N-type TOPCon Photovoltaic Cells Revenue billion Forecast, by Types 2020 & 2033
- Table 3: Global Efficient N-type TOPCon Photovoltaic Cells Revenue billion Forecast, by Region 2020 & 2033
- Table 4: Global Efficient N-type TOPCon Photovoltaic Cells Revenue billion Forecast, by Application 2020 & 2033
- Table 5: Global Efficient N-type TOPCon Photovoltaic Cells Revenue billion Forecast, by Types 2020 & 2033
- Table 6: Global Efficient N-type TOPCon Photovoltaic Cells Revenue billion Forecast, by Country 2020 & 2033
- Table 7: United States Efficient N-type TOPCon Photovoltaic Cells Revenue (billion) Forecast, by Application 2020 & 2033
- Table 8: Canada Efficient N-type TOPCon Photovoltaic Cells Revenue (billion) Forecast, by Application 2020 & 2033
- Table 9: Mexico Efficient N-type TOPCon Photovoltaic Cells Revenue (billion) Forecast, by Application 2020 & 2033
- Table 10: Global Efficient N-type TOPCon Photovoltaic Cells Revenue billion Forecast, by Application 2020 & 2033
- Table 11: Global Efficient N-type TOPCon Photovoltaic Cells Revenue billion Forecast, by Types 2020 & 2033
- Table 12: Global Efficient N-type TOPCon Photovoltaic Cells Revenue billion Forecast, by Country 2020 & 2033
- Table 13: Brazil Efficient N-type TOPCon Photovoltaic Cells Revenue (billion) Forecast, by Application 2020 & 2033
- Table 14: Argentina Efficient N-type TOPCon Photovoltaic Cells Revenue (billion) Forecast, by Application 2020 & 2033
- Table 15: Rest of South America Efficient N-type TOPCon Photovoltaic Cells Revenue (billion) Forecast, by Application 2020 & 2033
- Table 16: Global Efficient N-type TOPCon Photovoltaic Cells Revenue billion Forecast, by Application 2020 & 2033
- Table 17: Global Efficient N-type TOPCon Photovoltaic Cells Revenue billion Forecast, by Types 2020 & 2033
- Table 18: Global Efficient N-type TOPCon Photovoltaic Cells Revenue billion Forecast, by Country 2020 & 2033
- Table 19: United Kingdom Efficient N-type TOPCon Photovoltaic Cells Revenue (billion) Forecast, by Application 2020 & 2033
- Table 20: Germany Efficient N-type TOPCon Photovoltaic Cells Revenue (billion) Forecast, by Application 2020 & 2033
- Table 21: France Efficient N-type TOPCon Photovoltaic Cells Revenue (billion) Forecast, by Application 2020 & 2033
- Table 22: Italy Efficient N-type TOPCon Photovoltaic Cells Revenue (billion) Forecast, by Application 2020 & 2033
- Table 23: Spain Efficient N-type TOPCon Photovoltaic Cells Revenue (billion) Forecast, by Application 2020 & 2033
- Table 24: Russia Efficient N-type TOPCon Photovoltaic Cells Revenue (billion) Forecast, by Application 2020 & 2033
- Table 25: Benelux Efficient N-type TOPCon Photovoltaic Cells Revenue (billion) Forecast, by Application 2020 & 2033
- Table 26: Nordics Efficient N-type TOPCon Photovoltaic Cells Revenue (billion) Forecast, by Application 2020 & 2033
- Table 27: Rest of Europe Efficient N-type TOPCon Photovoltaic Cells Revenue (billion) Forecast, by Application 2020 & 2033
- Table 28: Global Efficient N-type TOPCon Photovoltaic Cells Revenue billion Forecast, by Application 2020 & 2033
- Table 29: Global Efficient N-type TOPCon Photovoltaic Cells Revenue billion Forecast, by Types 2020 & 2033
- Table 30: Global Efficient N-type TOPCon Photovoltaic Cells Revenue billion Forecast, by Country 2020 & 2033
- Table 31: Turkey Efficient N-type TOPCon Photovoltaic Cells Revenue (billion) Forecast, by Application 2020 & 2033
- Table 32: Israel Efficient N-type TOPCon Photovoltaic Cells Revenue (billion) Forecast, by Application 2020 & 2033
- Table 33: GCC Efficient N-type TOPCon Photovoltaic Cells Revenue (billion) Forecast, by Application 2020 & 2033
- Table 34: North Africa Efficient N-type TOPCon Photovoltaic Cells Revenue (billion) Forecast, by Application 2020 & 2033
- Table 35: South Africa Efficient N-type TOPCon Photovoltaic Cells Revenue (billion) Forecast, by Application 2020 & 2033
- Table 36: Rest of Middle East & Africa Efficient N-type TOPCon Photovoltaic Cells Revenue (billion) Forecast, by Application 2020 & 2033
- Table 37: Global Efficient N-type TOPCon Photovoltaic Cells Revenue billion Forecast, by Application 2020 & 2033
- Table 38: Global Efficient N-type TOPCon Photovoltaic Cells Revenue billion Forecast, by Types 2020 & 2033
- Table 39: Global Efficient N-type TOPCon Photovoltaic Cells Revenue billion Forecast, by Country 2020 & 2033
- Table 40: China Efficient N-type TOPCon Photovoltaic Cells Revenue (billion) Forecast, by Application 2020 & 2033
- Table 41: India Efficient N-type TOPCon Photovoltaic Cells Revenue (billion) Forecast, by Application 2020 & 2033
- Table 42: Japan Efficient N-type TOPCon Photovoltaic Cells Revenue (billion) Forecast, by Application 2020 & 2033
- Table 43: South Korea Efficient N-type TOPCon Photovoltaic Cells Revenue (billion) Forecast, by Application 2020 & 2033
- Table 44: ASEAN Efficient N-type TOPCon Photovoltaic Cells Revenue (billion) Forecast, by Application 2020 & 2033
- Table 45: Oceania Efficient N-type TOPCon Photovoltaic Cells Revenue (billion) Forecast, by Application 2020 & 2033
- Table 46: Rest of Asia Pacific Efficient N-type TOPCon Photovoltaic Cells Revenue (billion) Forecast, by Application 2020 & 2033
Frequently Asked Questions
1. What is the projected Compound Annual Growth Rate (CAGR) of the Efficient N-type TOPCon Photovoltaic Cells?
The projected CAGR is approximately 11.6%.
2. Which companies are prominent players in the Efficient N-type TOPCon Photovoltaic Cells?
Key companies in the market include SunPower, LG, Hanwha Qcells, DASOLAR, Jietai Solar, Jinko Solar, LUXOR Solar, Boviet Solar, NorSun, Trina Solar, DAH Solar, ShunFeng Photovoltaic, EGing Photovoltaic, JA Solar Technology Co., Ltd., Shenzhen S.C New Energy Technology Corporation, AIKO, RISEN ENERGY CO., LTD..
3. What are the main segments of the Efficient N-type TOPCon Photovoltaic Cells?
The market segments include Application, Types.
4. Can you provide details about the market size?
The market size is estimated to be USD 12.22 billion as of 2022.
5. What are some drivers contributing to market growth?
N/A
6. What are the notable trends driving market growth?
N/A
7. Are there any restraints impacting market growth?
N/A
8. Can you provide examples of recent developments in the market?
N/A
9. What pricing options are available for accessing the report?
Pricing options include single-user, multi-user, and enterprise licenses priced at USD 4900.00, USD 7350.00, and USD 9800.00 respectively.
10. Is the market size provided in terms of value or volume?
The market size is provided in terms of value, measured in billion.
11. Are there any specific market keywords associated with the report?
Yes, the market keyword associated with the report is "Efficient N-type TOPCon Photovoltaic Cells," which aids in identifying and referencing the specific market segment covered.
12. How do I determine which pricing option suits my needs best?
The pricing options vary based on user requirements and access needs. Individual users may opt for single-user licenses, while businesses requiring broader access may choose multi-user or enterprise licenses for cost-effective access to the report.
13. Are there any additional resources or data provided in the Efficient N-type TOPCon Photovoltaic Cells report?
While the report offers comprehensive insights, it's advisable to review the specific contents or supplementary materials provided to ascertain if additional resources or data are available.
14. How can I stay updated on further developments or reports in the Efficient N-type TOPCon Photovoltaic Cells?
To stay informed about further developments, trends, and reports in the Efficient N-type TOPCon Photovoltaic Cells, consider subscribing to industry newsletters, following relevant companies and organizations, or regularly checking reputable industry news sources and publications.
Methodology
Step 1 - Identification of Relevant Samples Size from Population Database


Step 2 - Approaches for Defining Global Market Size (Value, Volume* & Price*)

Note*: In applicable scenarios
Step 3 - Data Sources
Primary Research
- Web Analytics
- Survey Reports
- Research Institute
- Latest Research Reports
- Opinion Leaders
Secondary Research
- Annual Reports
- White Paper
- Latest Press Release
- Industry Association
- Paid Database
- Investor Presentations

Step 4 - Data Triangulation
Involves using different sources of information in order to increase the validity of a study
These sources are likely to be stakeholders in a program - participants, other researchers, program staff, other community members, and so on.
Then we put all data in single framework & apply various statistical tools to find out the dynamic on the market.
During the analysis stage, feedback from the stakeholder groups would be compared to determine areas of agreement as well as areas of divergence