

Key Insights
The global Electronics Rental Platform market is experiencing robust expansion, poised to reach USD 82.18 billion by 2025. This significant growth is fueled by an accelerating CAGR of 11.1% projected through the forecast period. The increasing adoption of technology across both individual and corporate sectors, coupled with the rising demand for flexible and cost-effective access to electronic devices, are primary market drivers. Businesses are leveraging these platforms to manage their IT infrastructure, equip remote workforces, and pilot new technologies without substantial upfront investment. For individuals, the appeal lies in the ability to access the latest gadgets for short-term needs, experiment with different devices, or fulfill temporary project requirements, all while avoiding the depreciation and disposal challenges associated with outright ownership. The convenience and affordability offered by these rental solutions are paramount in driving this upward trajectory.
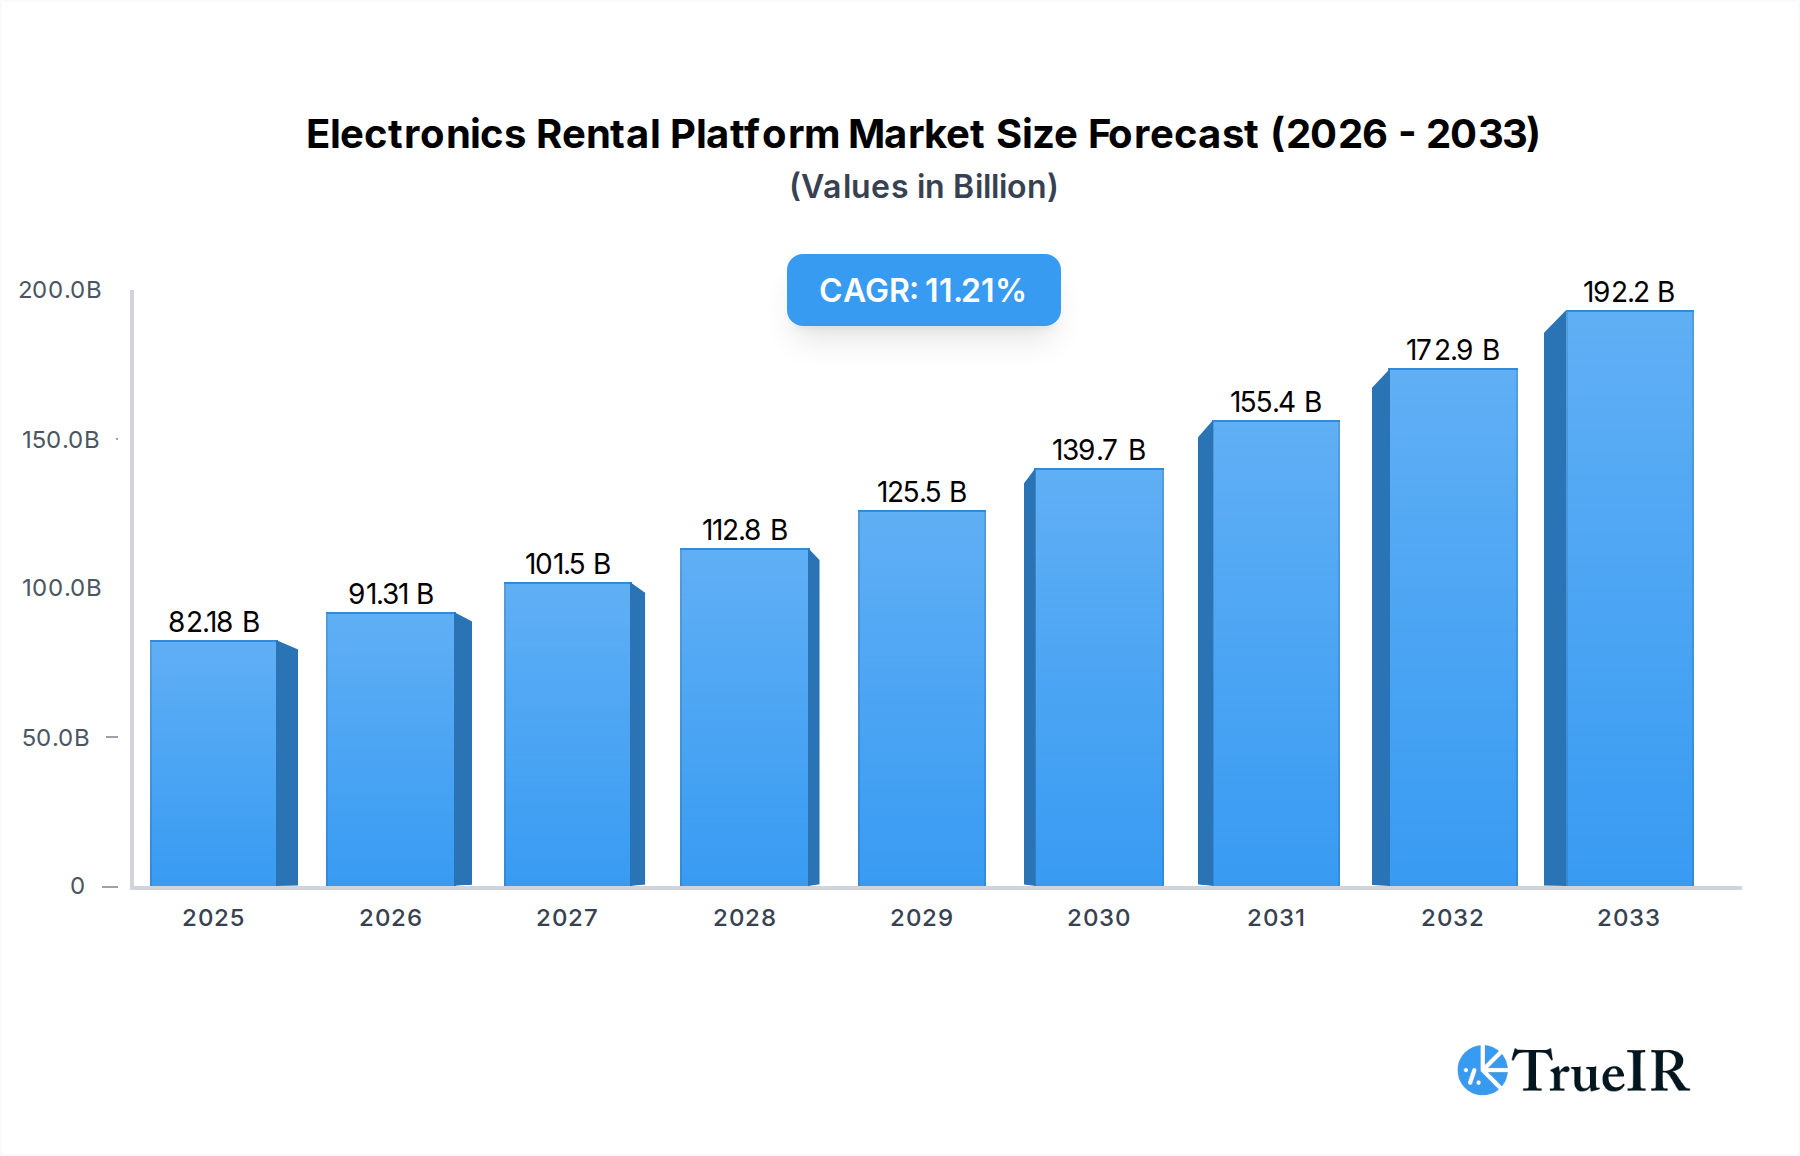
Electronics Rental Platform Market Size (In Billion)
Further propelling the market are evolving consumer behaviors and corporate strategies that prioritize adaptability and sustainability. The sheer variety of devices available through these platforms, ranging from computers and mobile phones to specialized tablets and other electronic equipment, caters to a broad spectrum of user needs. Leading companies like JD, Ant Group, and Grover are actively innovating their service offerings, expanding their geographical reach, and enhancing user experience to capture a larger market share. While the market demonstrates immense potential, certain factors could influence its pace. The need for robust logistical networks, efficient repair and refurbishment processes, and clear regulatory frameworks are essential for sustained growth. Nevertheless, the prevailing trend indicates a strong and sustained demand for electronics rental solutions, indicating a dynamic and promising future for the industry.

Electronics Rental Platform Company Market Share
Electronics Rental Platform Market Structure & Competitive Landscape
The global Electronics Rental Platform market exhibits a moderate to highly concentrated structure, with a significant share held by a few key players. Innovation drivers are primarily fueled by the increasing demand for flexible technology access, driven by rapid obsolescence cycles and the circular economy movement. Regulatory impacts are evolving, with a growing focus on data security and device refurbishment standards, influencing operational strategies. Product substitutes, such as outright purchase and financing options, present a continuous competitive challenge, necessitating differentiated service offerings and value propositions. End-user segmentation reveals a dual demand from Individual consumers seeking affordable access to personal devices and Corporate clients requiring scalable IT infrastructure solutions. Mergers and Acquisitions (M&A) trends are on the rise as established players seek to expand their geographical reach, service portfolios, and technological capabilities. The current market concentration ratio stands at approximately XX%, indicating a dynamic competitive environment. The volume of M&A deals in the historical period (2019-2024) reached an estimated 10 billion USD, signaling strategic consolidation.
Electronics Rental Platform Market Trends & Opportunities
The Electronics Rental Platform market is experiencing robust growth, projected to reach a valuation of over 300 billion USD by 2033. This expansion is propelled by a compound annual growth rate (CAGR) of approximately 15% from the base year of 2025. Technological shifts are paramount, with the increasing adoption of 5G-enabled devices, the proliferation of smart home technology, and the growing demand for high-performance computing power fueling the rental sector. Consumers are increasingly prioritizing access over ownership, driven by a desire for the latest gadgets and a reduced commitment to depreciating assets. This shift in consumer preferences is particularly evident in urban centers and among younger demographics, contributing to a rising market penetration rate of XX% in key regions.
Corporate adoption of electronics rental is also a significant trend, driven by the need for agility and cost-efficiency in managing IT assets. Companies are leveraging rental platforms to equip their remote workforces, manage seasonal project demands, and ensure access to the most up-to-date technology without substantial capital expenditure. This trend is further amplified by the growing emphasis on sustainability and the circular economy, as rental models inherently promote device reuse and reduce electronic waste.
The competitive landscape is characterized by intense innovation, with platform providers focusing on enhancing user experience, expanding device inventories, and offering comprehensive lifecycle management services, including maintenance, support, and end-of-lease options. Opportunities abound for companies that can offer specialized rental solutions for niche markets, such as augmented reality (AR) and virtual reality (VR) equipment, or catering to specific industry needs like medical devices or industrial automation. The integration of AI and machine learning for personalized recommendations and optimized inventory management presents another avenue for differentiation. Furthermore, the expansion into emerging economies, where disposable income may be a constraint for outright purchase, offers significant untapped potential for electronics rental services. The digital transformation initiatives across various sectors will continue to create a sustained demand for accessible and adaptable electronic devices, underscoring the long-term growth trajectory of this market.
Dominant Markets & Segments in Electronics Rental Platform
The Corporate segment is emerging as a dominant force within the Electronics Rental Platform market, projecting substantial growth throughout the forecast period (2025–2033). This dominance is fueled by the escalating need for scalable and cost-effective IT infrastructure among businesses navigating rapid digital transformation and evolving work models. The Computer type, encompassing laptops, desktops, and specialized workstations, represents the largest sub-segment within Corporate rentals, driven by the persistent demand for employee IT provisioning, both in office environments and for remote workforces. Estimated market share for Computer rentals within the Corporate segment is a commanding XX%.
Geographically, North America and Europe currently lead in market penetration and adoption rates, owing to well-established digital infrastructures, a high level of technological awareness, and supportive business environments. However, Asia Pacific is demonstrating the most aggressive growth trajectory, propelled by burgeoning economies, increasing digitalization across industries, and a rising entrepreneurial spirit. The region's expanding middle class and increasing focus on technological adoption for business efficiency are key growth drivers.
In terms of Applications, while Individual rentals cater to a broad consumer base seeking access to personal devices like Mobile Phones and Tablets, the Corporate sector's demand for bulk leasing of IT equipment for operational continuity and project-based needs significantly outpaces individual user volumes. The Other category, which includes specialized electronics for industries such as healthcare, manufacturing, and event management, also presents significant growth potential, albeit with a more niche market focus.
Key growth drivers for Corporate dominance include:
- Scalability and Flexibility: Companies can quickly scale their IT resources up or down based on project demands and employee fluctuations, avoiding long-term capital commitments.
- Cost Efficiency: Rental models offer predictable operating expenses, reducing upfront capital expenditure and allowing for budget optimization.
- Access to Latest Technology: Businesses can ensure their employees are equipped with the most current and efficient technology, maintaining a competitive edge.
- Simplified IT Management: Rental providers often offer comprehensive support, maintenance, and lifecycle management, reducing the burden on internal IT departments.
- Sustainability Initiatives: The growing corporate focus on environmental, social, and governance (ESG) goals aligns with the circular economy principles inherent in electronics rental.
The Corporate segment's significant contribution is projected to reach an estimated 250 billion USD by 2033, solidifying its position as the primary growth engine for the global Electronics Rental Platform market.
Electronics Rental Platform Product Analysis
The Electronics Rental Platform market is characterized by a diverse array of products, with Computers and Mobile Phones leading in demand. Innovations focus on providing businesses and individuals with access to the latest technological advancements, including high-performance computing for demanding applications and the newest smartphone models for communication and productivity. Competitive advantages are built upon offering a wide selection of brands and specifications, flexible rental terms, and bundled services such as insurance, maintenance, and timely upgrades. The integration of smart features and enhanced battery life in mobile devices, along with increased processing power and storage in computers, are key product differentiators that appeal to both individual and corporate users seeking cutting-edge solutions without the burden of ownership.
Key Drivers, Barriers & Challenges in Electronics Rental Platform
The Electronics Rental Platform market is propelled by several key drivers. Technologically, the rapid pace of innovation and short product lifecycles compel users to seek flexible access to the latest devices. Economically, the affordability of rental plans compared to outright purchase is a significant draw, especially for individuals and small to medium-sized enterprises. Policy-driven factors, such as government incentives promoting the circular economy and e-waste reduction, further encourage rental adoption.
Conversely, the market faces significant challenges. Supply chain disruptions, as witnessed in recent years, can impact device availability and rental timelines, creating operational bottlenecks. Regulatory hurdles related to data privacy and device sanitization, particularly for corporate clients, require robust compliance measures. Competitive pressures from a growing number of rental providers and alternative ownership models also necessitate continuous innovation and service differentiation to maintain market share. The initial capital investment required to build a diverse and up-to-date inventory remains a substantial barrier to entry for new players.
Growth Drivers in the Electronics Rental Platform Market
The growth of the Electronics Rental Platform market is primarily fueled by an increasing consumer preference for access over ownership, driven by the desire to utilize the latest technology without the commitment of outright purchase. Rapid technological advancements and the short lifecycles of electronic devices create a continuous demand for upgrades, making rental a more economically viable and practical solution. Furthermore, the growing corporate emphasis on flexible IT asset management, particularly in supporting remote workforces and managing project-based technology needs, is a significant growth catalyst. The expanding focus on sustainability and the circular economy also strongly supports rental models, aligning with corporate and consumer environmental consciousness.
Challenges Impacting Electronics Rental Platform Growth
Several challenges impact the growth of the Electronics Rental Platform market. Supply chain vulnerabilities, including component shortages and logistical complexities, can lead to inventory limitations and extended delivery times, frustrating customers. Regulatory landscapes, particularly concerning data security, device refurbishment standards, and international cross-border rentals, present ongoing compliance hurdles that require significant investment and operational adaptation. Intense competitive pressures from an increasing number of market players, alongside established financing and resale options, necessitate continuous differentiation through service quality, pricing strategies, and innovative offerings. The inherent risk of device damage, loss, or obsolescence also requires robust risk management and insurance protocols.
Key Players Shaping the Electronics Rental Platform Market
- JD
- Ant Group
- Grover
- Rent -A-Center
- Lendis
- RentoMojo
- RentSewazulin
- Tryatec
- RentNow
- RentKarro
Significant Electronics Rental Platform Industry Milestones
- 2019: Launch of Grover's all-you-can-eat tech subscription model, expanding consumer rental options.
- 2020: Lendis secures significant funding, accelerating its B2B IT leasing solutions for startups and SMEs.
- 2021: RentoMojo expands its services across multiple Indian cities, solidifying its presence in the Asian market.
- 2022: Ant Group explores innovative fintech solutions for device financing and rental accessibility.
- 2023: Rent-A-Center enhances its online platform and delivery services to cater to evolving consumer needs.
- 2023: Increased regulatory focus on e-waste and device longevity drives innovation in refurbishment and recycling programs by rental companies.
- 2024: Emergence of specialized rental platforms for niche electronics like AR/VR equipment and professional creative tools.
Future Outlook for Electronics Rental Platform Market
The future outlook for the Electronics Rental Platform market is exceptionally bright, driven by enduring trends of technological obsolescence and the increasing consumer and corporate preference for flexible, subscription-based access to electronics. Strategic opportunities lie in the expansion of service offerings to include smart home devices, IoT equipment, and advanced enterprise solutions. Further integration of AI for personalized recommendations and predictive maintenance will enhance customer experience and operational efficiency. The growing emphasis on sustainability will continue to position rental as the eco-conscious choice, opening avenues for partnerships with manufacturers focused on circular economy principles. Continued investment in user-friendly digital platforms and robust logistical networks will be crucial for capturing market share and meeting the evolving demands of a digitally-driven world.
Electronics Rental Platform Segmentation
-
1. Application
- 1.1. Individual
- 1.2. Corporate
-
2. Types
- 2.1. Computer
- 2.2. Mobile Phone
- 2.3. Tablets
- 2.4. Other
Electronics Rental Platform Segmentation By Geography
-
1. North America
- 1.1. United States
- 1.2. Canada
- 1.3. Mexico
-
2. South America
- 2.1. Brazil
- 2.2. Argentina
- 2.3. Rest of South America
-
3. Europe
- 3.1. United Kingdom
- 3.2. Germany
- 3.3. France
- 3.4. Italy
- 3.5. Spain
- 3.6. Russia
- 3.7. Benelux
- 3.8. Nordics
- 3.9. Rest of Europe
-
4. Middle East & Africa
- 4.1. Turkey
- 4.2. Israel
- 4.3. GCC
- 4.4. North Africa
- 4.5. South Africa
- 4.6. Rest of Middle East & Africa
-
5. Asia Pacific
- 5.1. China
- 5.2. India
- 5.3. Japan
- 5.4. South Korea
- 5.5. ASEAN
- 5.6. Oceania
- 5.7. Rest of Asia Pacific
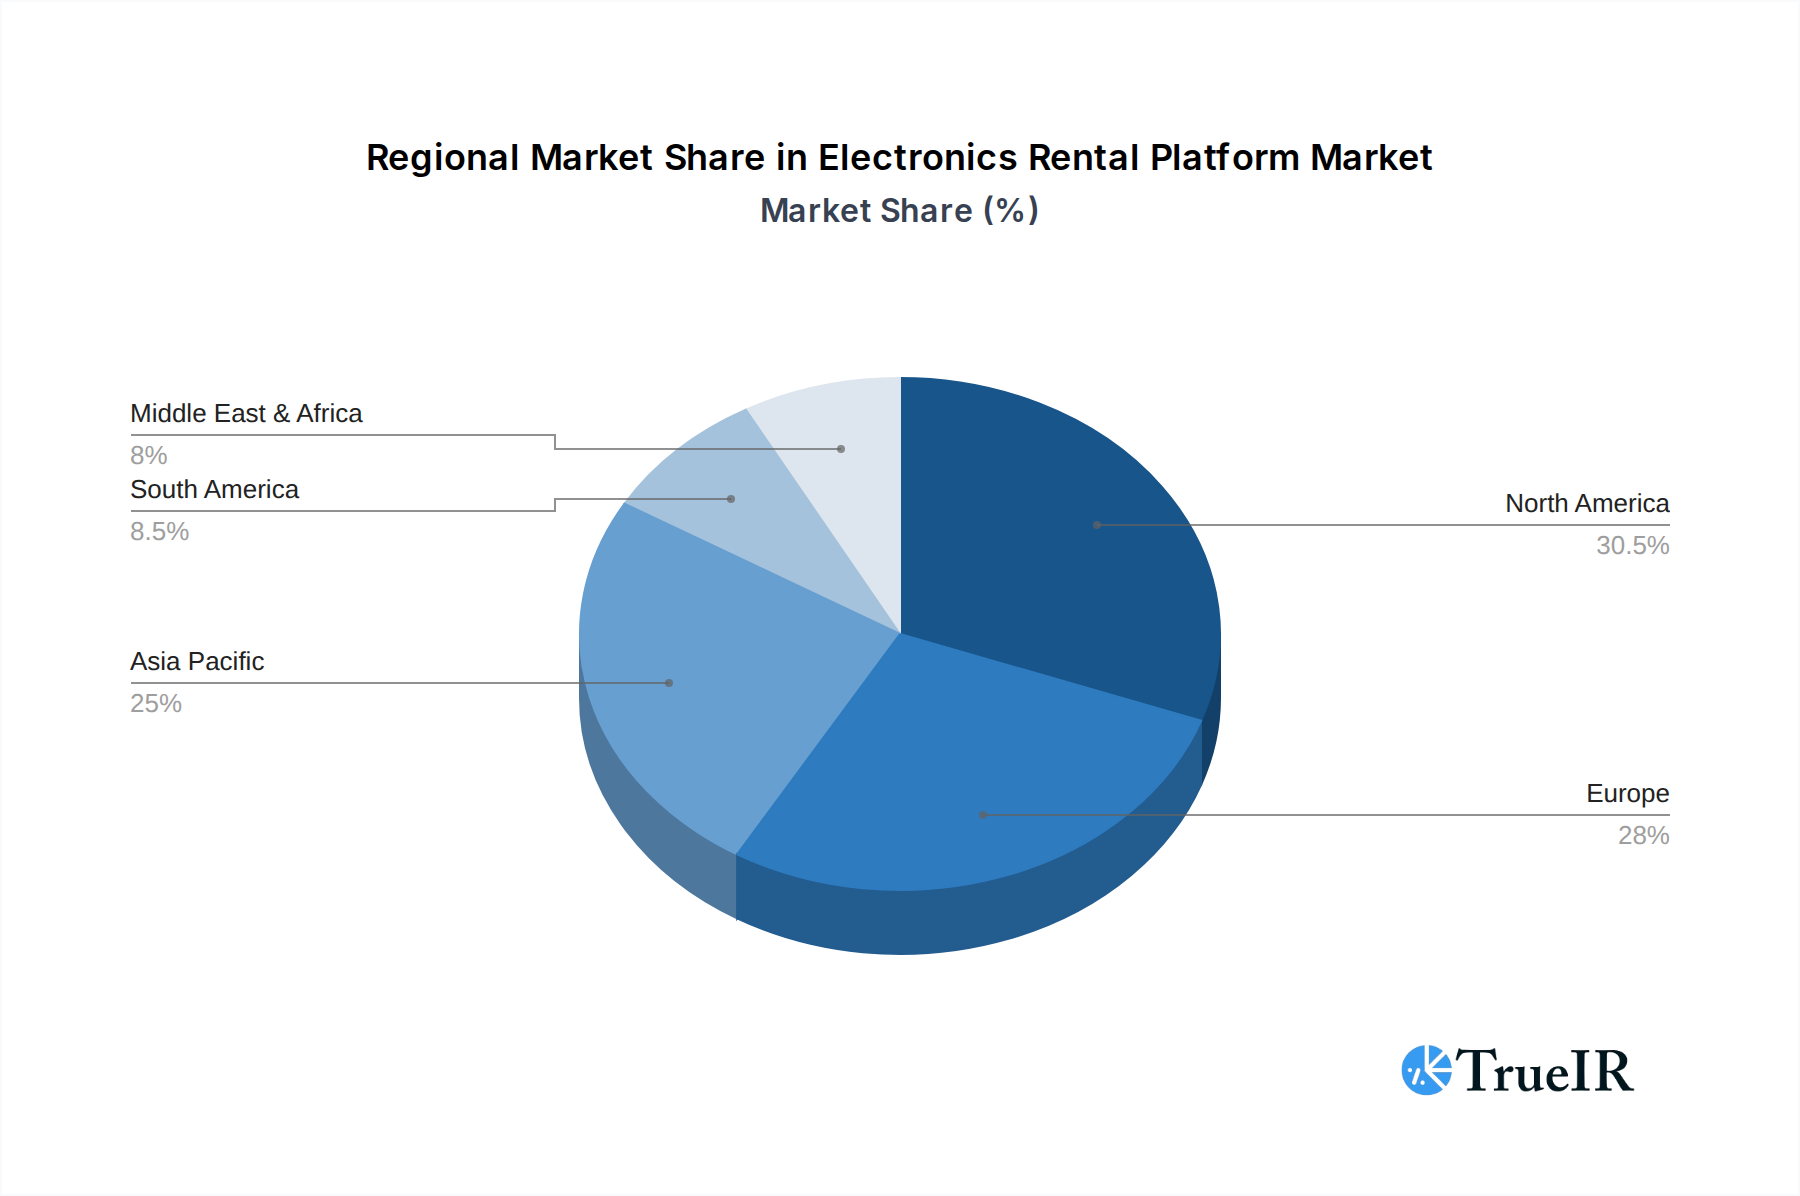
Electronics Rental Platform Regional Market Share
Geographic Coverage of Electronics Rental Platform
Electronics Rental Platform REPORT HIGHLIGHTS
| Aspects | Details |
|---|---|
| Study Period | 2020-2034 |
| Base Year | 2025 |
| Estimated Year | 2026 |
| Forecast Period | 2026-2034 |
| Historical Period | 2020-2025 |
| Growth Rate | CAGR of 11.1% from 2020-2034 |
| Segmentation |
|
Table of Contents
- 1. Introduction
- 1.1. Research Scope
- 1.2. Market Segmentation
- 1.3. Research Objective
- 1.4. Definitions and Assumptions
- 2. Executive Summary
- 2.1. Market Snapshot
- 3. Market Dynamics
- 3.1. Market Drivers
- 3.2. Market Restrains
- 3.3. Market Trends
- 3.4. Market Opportunities
- 4. Market Factor Analysis
- 4.1. Porters Five Forces
- 4.1.1. Bargaining Power of Suppliers
- 4.1.2. Bargaining Power of Buyers
- 4.1.3. Threat of New Entrants
- 4.1.4. Threat of Substitutes
- 4.1.5. Competitive Rivalry
- 4.2. PESTEL analysis
- 4.3. BCG Analysis
- 4.3.1. Stars (High Growth, High Market Share)
- 4.3.2. Cash Cows (Low Growth, High Market Share)
- 4.3.3. Question Mark (High Growth, Low Market Share)
- 4.3.4. Dogs (Low Growth, Low Market Share)
- 4.4. Ansoff Matrix Analysis
- 4.5. Supply Chain Analysis
- 4.6. Regulatory Landscape
- 4.7. Current Market Potential and Opportunity Assessment (TAM–SAM–SOM Framework)
- 4.8. TIR Analyst Note
- 4.1. Porters Five Forces
- 5. Market Analysis, Insights and Forecast 2021-2033
- 5.1. Market Analysis, Insights and Forecast - by Application
- 5.1.1. Individual
- 5.1.2. Corporate
- 5.2. Market Analysis, Insights and Forecast - by Types
- 5.2.1. Computer
- 5.2.2. Mobile Phone
- 5.2.3. Tablets
- 5.2.4. Other
- 5.3. Market Analysis, Insights and Forecast - by Region
- 5.3.1. North America
- 5.3.2. South America
- 5.3.3. Europe
- 5.3.4. Middle East & Africa
- 5.3.5. Asia Pacific
- 5.1. Market Analysis, Insights and Forecast - by Application
- 6. Global Electronics Rental Platform Analysis, Insights and Forecast, 2021-2033
- 6.1. Market Analysis, Insights and Forecast - by Application
- 6.1.1. Individual
- 6.1.2. Corporate
- 6.2. Market Analysis, Insights and Forecast - by Types
- 6.2.1. Computer
- 6.2.2. Mobile Phone
- 6.2.3. Tablets
- 6.2.4. Other
- 6.1. Market Analysis, Insights and Forecast - by Application
- 7. North America Electronics Rental Platform Analysis, Insights and Forecast, 2020-2032
- 7.1. Market Analysis, Insights and Forecast - by Application
- 7.1.1. Individual
- 7.1.2. Corporate
- 7.2. Market Analysis, Insights and Forecast - by Types
- 7.2.1. Computer
- 7.2.2. Mobile Phone
- 7.2.3. Tablets
- 7.2.4. Other
- 7.1. Market Analysis, Insights and Forecast - by Application
- 8. South America Electronics Rental Platform Analysis, Insights and Forecast, 2020-2032
- 8.1. Market Analysis, Insights and Forecast - by Application
- 8.1.1. Individual
- 8.1.2. Corporate
- 8.2. Market Analysis, Insights and Forecast - by Types
- 8.2.1. Computer
- 8.2.2. Mobile Phone
- 8.2.3. Tablets
- 8.2.4. Other
- 8.1. Market Analysis, Insights and Forecast - by Application
- 9. Europe Electronics Rental Platform Analysis, Insights and Forecast, 2020-2032
- 9.1. Market Analysis, Insights and Forecast - by Application
- 9.1.1. Individual
- 9.1.2. Corporate
- 9.2. Market Analysis, Insights and Forecast - by Types
- 9.2.1. Computer
- 9.2.2. Mobile Phone
- 9.2.3. Tablets
- 9.2.4. Other
- 9.1. Market Analysis, Insights and Forecast - by Application
- 10. Middle East & Africa Electronics Rental Platform Analysis, Insights and Forecast, 2020-2032
- 10.1. Market Analysis, Insights and Forecast - by Application
- 10.1.1. Individual
- 10.1.2. Corporate
- 10.2. Market Analysis, Insights and Forecast - by Types
- 10.2.1. Computer
- 10.2.2. Mobile Phone
- 10.2.3. Tablets
- 10.2.4. Other
- 10.1. Market Analysis, Insights and Forecast - by Application
- 11. Asia Pacific Electronics Rental Platform Analysis, Insights and Forecast, 2020-2032
- 11.1. Market Analysis, Insights and Forecast - by Application
- 11.1.1. Individual
- 11.1.2. Corporate
- 11.2. Market Analysis, Insights and Forecast - by Types
- 11.2.1. Computer
- 11.2.2. Mobile Phone
- 11.2.3. Tablets
- 11.2.4. Other
- 11.1. Market Analysis, Insights and Forecast - by Application
- 12. Competitive Analysis
- 12.1. Company Profiles
- 12.1.1 JD
- 12.1.1.1. Company Overview
- 12.1.1.2. Products
- 12.1.1.3. Company Financials
- 12.1.1.4. SWOT Analysis
- 12.1.2 Ant Group
- 12.1.2.1. Company Overview
- 12.1.2.2. Products
- 12.1.2.3. Company Financials
- 12.1.2.4. SWOT Analysis
- 12.1.3 Grover
- 12.1.3.1. Company Overview
- 12.1.3.2. Products
- 12.1.3.3. Company Financials
- 12.1.3.4. SWOT Analysis
- 12.1.4 Rent -A-Center
- 12.1.4.1. Company Overview
- 12.1.4.2. Products
- 12.1.4.3. Company Financials
- 12.1.4.4. SWOT Analysis
- 12.1.5 Lendis
- 12.1.5.1. Company Overview
- 12.1.5.2. Products
- 12.1.5.3. Company Financials
- 12.1.5.4. SWOT Analysis
- 12.1.6 RentoMojo
- 12.1.6.1. Company Overview
- 12.1.6.2. Products
- 12.1.6.3. Company Financials
- 12.1.6.4. SWOT Analysis
- 12.1.7 RentSewazulin
- 12.1.7.1. Company Overview
- 12.1.7.2. Products
- 12.1.7.3. Company Financials
- 12.1.7.4. SWOT Analysis
- 12.1.8 Tryatec
- 12.1.8.1. Company Overview
- 12.1.8.2. Products
- 12.1.8.3. Company Financials
- 12.1.8.4. SWOT Analysis
- 12.1.9 RentNow
- 12.1.9.1. Company Overview
- 12.1.9.2. Products
- 12.1.9.3. Company Financials
- 12.1.9.4. SWOT Analysis
- 12.1.10 RentKarro
- 12.1.10.1. Company Overview
- 12.1.10.2. Products
- 12.1.10.3. Company Financials
- 12.1.10.4. SWOT Analysis
- 12.1.1 JD
- 12.2. Market Entropy
- 12.2.1 Company's Key Areas Served
- 12.2.2 Recent Developments
- 12.3. Company Market Share Analysis 2025
- 12.3.1 Top 5 Companies Market Share Analysis
- 12.3.2 Top 3 Companies Market Share Analysis
- 12.4. List of Potential Customers
- 13. Research Methodology
List of Figures
- Figure 1: Global Electronics Rental Platform Revenue Breakdown (undefined, %) by Region 2025 & 2033
- Figure 2: North America Electronics Rental Platform Revenue (undefined), by Application 2025 & 2033
- Figure 3: North America Electronics Rental Platform Revenue Share (%), by Application 2025 & 2033
- Figure 4: North America Electronics Rental Platform Revenue (undefined), by Types 2025 & 2033
- Figure 5: North America Electronics Rental Platform Revenue Share (%), by Types 2025 & 2033
- Figure 6: North America Electronics Rental Platform Revenue (undefined), by Country 2025 & 2033
- Figure 7: North America Electronics Rental Platform Revenue Share (%), by Country 2025 & 2033
- Figure 8: South America Electronics Rental Platform Revenue (undefined), by Application 2025 & 2033
- Figure 9: South America Electronics Rental Platform Revenue Share (%), by Application 2025 & 2033
- Figure 10: South America Electronics Rental Platform Revenue (undefined), by Types 2025 & 2033
- Figure 11: South America Electronics Rental Platform Revenue Share (%), by Types 2025 & 2033
- Figure 12: South America Electronics Rental Platform Revenue (undefined), by Country 2025 & 2033
- Figure 13: South America Electronics Rental Platform Revenue Share (%), by Country 2025 & 2033
- Figure 14: Europe Electronics Rental Platform Revenue (undefined), by Application 2025 & 2033
- Figure 15: Europe Electronics Rental Platform Revenue Share (%), by Application 2025 & 2033
- Figure 16: Europe Electronics Rental Platform Revenue (undefined), by Types 2025 & 2033
- Figure 17: Europe Electronics Rental Platform Revenue Share (%), by Types 2025 & 2033
- Figure 18: Europe Electronics Rental Platform Revenue (undefined), by Country 2025 & 2033
- Figure 19: Europe Electronics Rental Platform Revenue Share (%), by Country 2025 & 2033
- Figure 20: Middle East & Africa Electronics Rental Platform Revenue (undefined), by Application 2025 & 2033
- Figure 21: Middle East & Africa Electronics Rental Platform Revenue Share (%), by Application 2025 & 2033
- Figure 22: Middle East & Africa Electronics Rental Platform Revenue (undefined), by Types 2025 & 2033
- Figure 23: Middle East & Africa Electronics Rental Platform Revenue Share (%), by Types 2025 & 2033
- Figure 24: Middle East & Africa Electronics Rental Platform Revenue (undefined), by Country 2025 & 2033
- Figure 25: Middle East & Africa Electronics Rental Platform Revenue Share (%), by Country 2025 & 2033
- Figure 26: Asia Pacific Electronics Rental Platform Revenue (undefined), by Application 2025 & 2033
- Figure 27: Asia Pacific Electronics Rental Platform Revenue Share (%), by Application 2025 & 2033
- Figure 28: Asia Pacific Electronics Rental Platform Revenue (undefined), by Types 2025 & 2033
- Figure 29: Asia Pacific Electronics Rental Platform Revenue Share (%), by Types 2025 & 2033
- Figure 30: Asia Pacific Electronics Rental Platform Revenue (undefined), by Country 2025 & 2033
- Figure 31: Asia Pacific Electronics Rental Platform Revenue Share (%), by Country 2025 & 2033
List of Tables
- Table 1: Global Electronics Rental Platform Revenue undefined Forecast, by Application 2020 & 2033
- Table 2: Global Electronics Rental Platform Revenue undefined Forecast, by Types 2020 & 2033
- Table 3: Global Electronics Rental Platform Revenue undefined Forecast, by Region 2020 & 2033
- Table 4: Global Electronics Rental Platform Revenue undefined Forecast, by Application 2020 & 2033
- Table 5: Global Electronics Rental Platform Revenue undefined Forecast, by Types 2020 & 2033
- Table 6: Global Electronics Rental Platform Revenue undefined Forecast, by Country 2020 & 2033
- Table 7: United States Electronics Rental Platform Revenue (undefined) Forecast, by Application 2020 & 2033
- Table 8: Canada Electronics Rental Platform Revenue (undefined) Forecast, by Application 2020 & 2033
- Table 9: Mexico Electronics Rental Platform Revenue (undefined) Forecast, by Application 2020 & 2033
- Table 10: Global Electronics Rental Platform Revenue undefined Forecast, by Application 2020 & 2033
- Table 11: Global Electronics Rental Platform Revenue undefined Forecast, by Types 2020 & 2033
- Table 12: Global Electronics Rental Platform Revenue undefined Forecast, by Country 2020 & 2033
- Table 13: Brazil Electronics Rental Platform Revenue (undefined) Forecast, by Application 2020 & 2033
- Table 14: Argentina Electronics Rental Platform Revenue (undefined) Forecast, by Application 2020 & 2033
- Table 15: Rest of South America Electronics Rental Platform Revenue (undefined) Forecast, by Application 2020 & 2033
- Table 16: Global Electronics Rental Platform Revenue undefined Forecast, by Application 2020 & 2033
- Table 17: Global Electronics Rental Platform Revenue undefined Forecast, by Types 2020 & 2033
- Table 18: Global Electronics Rental Platform Revenue undefined Forecast, by Country 2020 & 2033
- Table 19: United Kingdom Electronics Rental Platform Revenue (undefined) Forecast, by Application 2020 & 2033
- Table 20: Germany Electronics Rental Platform Revenue (undefined) Forecast, by Application 2020 & 2033
- Table 21: France Electronics Rental Platform Revenue (undefined) Forecast, by Application 2020 & 2033
- Table 22: Italy Electronics Rental Platform Revenue (undefined) Forecast, by Application 2020 & 2033
- Table 23: Spain Electronics Rental Platform Revenue (undefined) Forecast, by Application 2020 & 2033
- Table 24: Russia Electronics Rental Platform Revenue (undefined) Forecast, by Application 2020 & 2033
- Table 25: Benelux Electronics Rental Platform Revenue (undefined) Forecast, by Application 2020 & 2033
- Table 26: Nordics Electronics Rental Platform Revenue (undefined) Forecast, by Application 2020 & 2033
- Table 27: Rest of Europe Electronics Rental Platform Revenue (undefined) Forecast, by Application 2020 & 2033
- Table 28: Global Electronics Rental Platform Revenue undefined Forecast, by Application 2020 & 2033
- Table 29: Global Electronics Rental Platform Revenue undefined Forecast, by Types 2020 & 2033
- Table 30: Global Electronics Rental Platform Revenue undefined Forecast, by Country 2020 & 2033
- Table 31: Turkey Electronics Rental Platform Revenue (undefined) Forecast, by Application 2020 & 2033
- Table 32: Israel Electronics Rental Platform Revenue (undefined) Forecast, by Application 2020 & 2033
- Table 33: GCC Electronics Rental Platform Revenue (undefined) Forecast, by Application 2020 & 2033
- Table 34: North Africa Electronics Rental Platform Revenue (undefined) Forecast, by Application 2020 & 2033
- Table 35: South Africa Electronics Rental Platform Revenue (undefined) Forecast, by Application 2020 & 2033
- Table 36: Rest of Middle East & Africa Electronics Rental Platform Revenue (undefined) Forecast, by Application 2020 & 2033
- Table 37: Global Electronics Rental Platform Revenue undefined Forecast, by Application 2020 & 2033
- Table 38: Global Electronics Rental Platform Revenue undefined Forecast, by Types 2020 & 2033
- Table 39: Global Electronics Rental Platform Revenue undefined Forecast, by Country 2020 & 2033
- Table 40: China Electronics Rental Platform Revenue (undefined) Forecast, by Application 2020 & 2033
- Table 41: India Electronics Rental Platform Revenue (undefined) Forecast, by Application 2020 & 2033
- Table 42: Japan Electronics Rental Platform Revenue (undefined) Forecast, by Application 2020 & 2033
- Table 43: South Korea Electronics Rental Platform Revenue (undefined) Forecast, by Application 2020 & 2033
- Table 44: ASEAN Electronics Rental Platform Revenue (undefined) Forecast, by Application 2020 & 2033
- Table 45: Oceania Electronics Rental Platform Revenue (undefined) Forecast, by Application 2020 & 2033
- Table 46: Rest of Asia Pacific Electronics Rental Platform Revenue (undefined) Forecast, by Application 2020 & 2033
Frequently Asked Questions
1. What is the projected Compound Annual Growth Rate (CAGR) of the Electronics Rental Platform?
The projected CAGR is approximately 11.1%.
2. Which companies are prominent players in the Electronics Rental Platform?
Key companies in the market include JD, Ant Group, Grover, Rent -A-Center, Lendis, RentoMojo, RentSewazulin, Tryatec, RentNow, RentKarro.
3. What are the main segments of the Electronics Rental Platform?
The market segments include Application, Types.
4. Can you provide details about the market size?
The market size is estimated to be USD XXX N/A as of 2022.
5. What are some drivers contributing to market growth?
N/A
6. What are the notable trends driving market growth?
N/A
7. Are there any restraints impacting market growth?
N/A
8. Can you provide examples of recent developments in the market?
N/A
9. What pricing options are available for accessing the report?
Pricing options include single-user, multi-user, and enterprise licenses priced at USD 2900.00, USD 4350.00, and USD 5800.00 respectively.
10. Is the market size provided in terms of value or volume?
The market size is provided in terms of value, measured in N/A.
11. Are there any specific market keywords associated with the report?
Yes, the market keyword associated with the report is "Electronics Rental Platform," which aids in identifying and referencing the specific market segment covered.
12. How do I determine which pricing option suits my needs best?
The pricing options vary based on user requirements and access needs. Individual users may opt for single-user licenses, while businesses requiring broader access may choose multi-user or enterprise licenses for cost-effective access to the report.
13. Are there any additional resources or data provided in the Electronics Rental Platform report?
While the report offers comprehensive insights, it's advisable to review the specific contents or supplementary materials provided to ascertain if additional resources or data are available.
14. How can I stay updated on further developments or reports in the Electronics Rental Platform?
To stay informed about further developments, trends, and reports in the Electronics Rental Platform, consider subscribing to industry newsletters, following relevant companies and organizations, or regularly checking reputable industry news sources and publications.
Methodology
Step 1 - Identification of Relevant Samples Size from Population Database


Step 2 - Approaches for Defining Global Market Size (Value, Volume* & Price*)

Note*: In applicable scenarios
Step 3 - Data Sources
Primary Research
- Web Analytics
- Survey Reports
- Research Institute
- Latest Research Reports
- Opinion Leaders
Secondary Research
- Annual Reports
- White Paper
- Latest Press Release
- Industry Association
- Paid Database
- Investor Presentations

Step 4 - Data Triangulation
Involves using different sources of information in order to increase the validity of a study
These sources are likely to be stakeholders in a program - participants, other researchers, program staff, other community members, and so on.
Then we put all data in single framework & apply various statistical tools to find out the dynamic on the market.
During the analysis stage, feedback from the stakeholder groups would be compared to determine areas of agreement as well as areas of divergence