

Key Insights
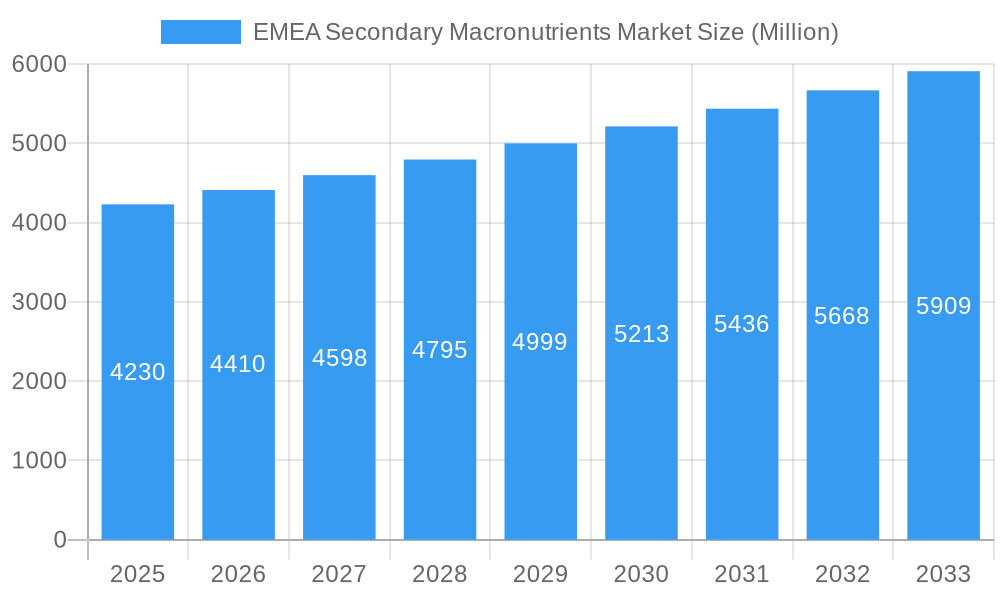
The EMEA Secondary Macronutrients Market, valued at approximately $4.23 billion in 2025, is projected to experience steady growth, driven by the increasing demand for high-yield agriculture and the rising adoption of advanced fertilization techniques. The market's Compound Annual Growth Rate (CAGR) of 4.20% from 2025 to 2033 indicates a consistent expansion, fueled by factors like the growing global population requiring increased food production and the escalating awareness of soil nutrient deficiencies among farmers. Key segments within the market, such as sulfur, calcium, and magnesium-based fertilizers, cater to diverse crop types including grains and cereals, pulses and oilseeds, and fruits and vegetables. The preference for liquid application methods over solid fertilizers is expected to gain traction, driven by ease of use and improved nutrient uptake efficiency. Leading companies like Haifa Group, Eurochem Group AG, and Yara International ASA are actively shaping market dynamics through innovation, strategic partnerships, and expansions into key regions within EMEA. The market is geographically diversified, with significant contributions expected from countries like Germany, the United Kingdom, France, and major economies in the Middle East and Africa, reflecting the strong agricultural base and increasing investment in sustainable farming practices.
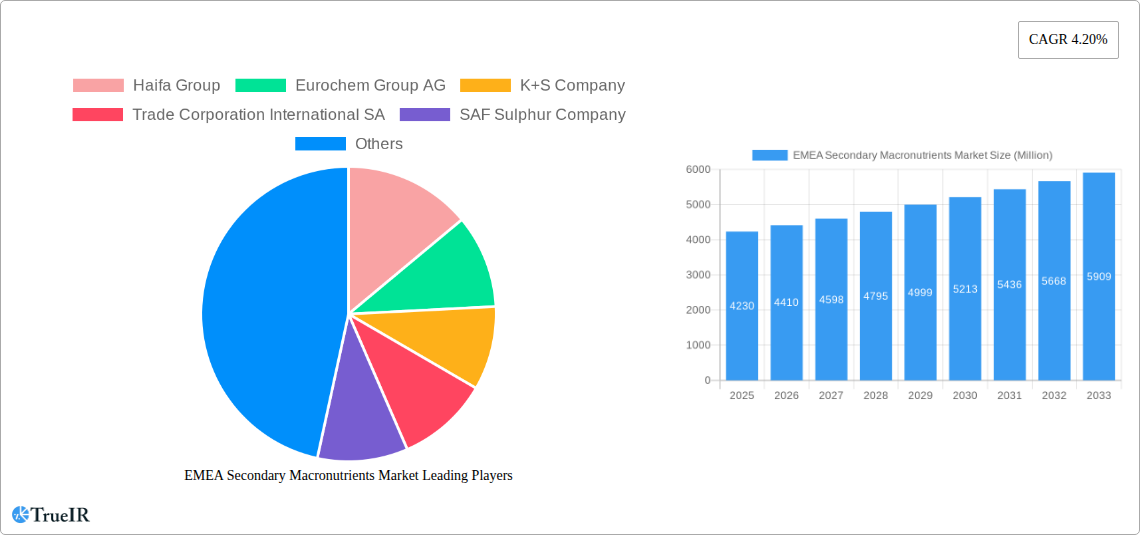
EMEA Secondary Macronutrients Market Market Size (In Billion)
The competitive landscape is characterized by established players and regional players, each with a unique portfolio of products and distribution networks. Future growth will be shaped by factors including government regulations promoting sustainable agriculture, advancements in fertilizer technology offering improved nutrient efficiency and reduced environmental impact, and fluctuating commodity prices impacting input costs. However, challenges remain, including price volatility of raw materials and potential environmental concerns associated with fertilizer application. Market players are focusing on developing innovative solutions that address these challenges, such as precision fertilization techniques and the development of slow-release fertilizers. This market is anticipated to benefit from increasing government initiatives and subsidies promoting sustainable agricultural practices across EMEA, contributing to its overall sustained growth trajectory.
EMEA Secondary Macronutrients Market Company Market Share
EMEA Secondary Macronutrients Market: A Comprehensive Market Report (2019-2033)
This dynamic report provides a deep dive into the EMEA Secondary Macronutrients Market, offering a comprehensive analysis of market trends, competitive dynamics, and future growth projections from 2019 to 2033. With a focus on key segments including Sulfur, Calcium, and Magnesium nutrients, delivered via solid and liquid application methods to various crop types (Grains & Cereals, Pulses & Oilseeds, Fruits & Vegetables, Turfs & Ornamentals, and Other Crop Types), this report is an essential resource for industry professionals, investors, and strategic decision-makers. The report utilizes a base year of 2025 and an estimated year of 2025, forecasting market trends until 2033 based on the historical period of 2019-2024. The market size is expected to reach xx Million by 2033, showcasing significant growth potential.
EMEA Secondary Macronutrients Market Market Structure & Competitive Landscape
The EMEA secondary macronutrients market exhibits a moderately concentrated structure, with several major players holding significant market share. The Herfindahl-Hirschman Index (HHI) for 2024 is estimated at xx, indicating a moderately competitive landscape. Key drivers of innovation include the demand for high-yield agriculture, stringent environmental regulations promoting sustainable farming practices, and the development of advanced nutrient delivery systems. Regulatory impacts vary across EMEA nations, influencing product registration, labeling, and distribution. Substitute products, such as organic amendments and biofertilizers, are gradually gaining traction, challenging the dominance of conventional secondary macronutrients. End-user segmentation is primarily driven by crop type and farming practices (conventional vs. organic). M&A activity in the sector has been moderate, with approximately xx deals recorded between 2019 and 2024, predominantly focused on expanding geographical reach and product portfolios.
- Market Concentration: HHI (2024): xx
- Innovation Drivers: Sustainable farming, technological advancements in nutrient delivery.
- Regulatory Impacts: Vary across EMEA, influencing product registration and distribution.
- Product Substitutes: Organic amendments and biofertilizers.
- End-User Segmentation: Crop type (Grains & Cereals, Pulses & Oilseeds, etc.) and farming practices.
- M&A Trends: Moderate activity (xx deals, 2019-2024), focused on geographic expansion and portfolio diversification.
EMEA Secondary Macronutrients Market Market Trends & Opportunities
The EMEA secondary macronutrients market is experiencing robust growth, driven by the increasing demand for food security, the rising adoption of precision agriculture techniques, and government initiatives promoting sustainable agricultural practices. The market size, valued at xx Million in 2024, is projected to reach xx Million by 2033, exhibiting a Compound Annual Growth Rate (CAGR) of xx% during the forecast period (2025-2033). Technological advancements, such as controlled-release fertilizers and nutrient sensors, are enhancing application efficiency and reducing environmental impact. Consumer preferences are shifting towards sustainably produced crops, fostering the demand for environmentally friendly secondary macronutrients. Competitive dynamics are characterized by both price competition and product differentiation, based on nutrient formulation, application method, and efficacy. Market penetration rates are relatively high in developed countries, while significant growth opportunities exist in emerging markets with expanding agricultural sectors.
Dominant Markets & Segments in EMEA Secondary Macronutrients Market
The largest regional market within EMEA is Western Europe, driven by intensive agricultural practices and a large demand for high-quality produce. Within Western Europe, France and Germany stand out as key countries, benefiting from advanced agricultural technologies and supportive government policies.
Key Growth Drivers (by Segment):
- Nutrient Type: Sulfur is the dominant segment, driven by its crucial role in crop yield and quality. The demand for Calcium and Magnesium is also significant, particularly in specific crop types.
- Application Method: Liquid application is growing faster than solid, driven by its precise application capabilities and ease of use.
- Crop Type: Grains and cereals constitute the largest consumer segment, closely followed by pulses and oilseeds. Fruit and vegetable cultivation is also a major driver of demand.
- Country: France and Germany lead in terms of consumption and market growth within Western Europe. Eastern Europe's emerging markets display significant growth potential, although growth might be slower in these regions given their current economies.
Market Dominance Analysis: The dominance of specific regions, countries, and segments is largely attributable to factors such as:
- Developed agricultural infrastructure: Regions with well-established irrigation systems, storage facilities, and distribution networks experience higher market penetration.
- Supportive government policies: Subsidies, tax incentives, and regulations encouraging sustainable agriculture boost the demand for secondary macronutrients.
- High crop yields: Regions and segments with high crop yields have increased demand for fertilizers to sustain productivity.
EMEA Secondary Macronutrients Market Product Analysis
Recent product innovations have focused on improving nutrient efficacy and reducing environmental impact. Controlled-release fertilizers provide a more targeted and efficient nutrient supply, while formulations tailored to specific crop needs enhance effectiveness. Technological advancements in liquid application systems ensure precise nutrient delivery, minimizing waste and maximizing yield. The competitive advantage for manufacturers lies in offering tailored solutions, ensuring product quality, and demonstrating environmental responsibility.
Key Drivers, Barriers & Challenges in EMEA Secondary Macronutrients Market
Key Drivers:
- Growing global food demand: Population growth and changing dietary habits are increasing the pressure on agricultural production.
- Technological advancements: Precision agriculture techniques, such as GPS-guided application, optimize fertilizer use.
- Government support for sustainable agriculture: Incentives and regulations encourage the use of efficient and environmentally friendly fertilizers.
Key Challenges:
- Fluctuating raw material prices: Variations in the prices of sulfur, calcium, and magnesium impact production costs and market competitiveness.
- Stringent environmental regulations: Compliance costs and limitations on application methods can increase production expenses.
- Supply chain disruptions: Geopolitical instability and logistical challenges can affect the availability of raw materials and finished products, resulting in price hikes. An estimated xx% increase in transportation costs in 2022 negatively affected market accessibility.
Growth Drivers in the EMEA Secondary Macronutrients Market Market
The increasing demand for food in a growing population, coupled with changing dietary habits, is the primary driver of growth. Furthermore, the adoption of advanced agricultural technologies, including precision farming, and supportive government policies promoting sustainable agricultural practices significantly influence the market.
Challenges Impacting EMEA Secondary Macronutrients Market Growth
Supply chain disruptions caused by geopolitical factors and natural disasters pose a major challenge. Additionally, stringent environmental regulations and fluctuating raw material prices impact market profitability. Intense competition among established players further complicates growth.
Key Players Shaping the EMEA Secondary Macronutrients Market Market
- Haifa Group
- Eurochem Group AG
- K+S Company
- Trade Corporation International SA
- SAF Sulphur Company
- Saudi United Fertilizer Company (al-asmida)
- Al-tayseer Chemical Industry
- Israel Chemical Company
- Takamul National Agriculture
- Yara International ASA
Significant EMEA Secondary Macronutrients Market Industry Milestones
- 2022 Q3: Yara International ASA launched a new range of sustainable secondary macronutrient products.
- 2021 Q4: Eurochem Group AG acquired a smaller fertilizer company expanding its reach in Eastern Europe.
- 2020 Q2: New EU regulations on fertilizer labeling came into effect.
- 2019 Q1: Haifa Group announced a strategic partnership to improve the distribution of liquid fertilizers in the UK.
Future Outlook for EMEA Secondary Macronutrients Market Market
The EMEA secondary macronutrients market is poised for continued growth, driven by the increasing global food demand, technological advancements, and supportive regulatory frameworks. Strategic opportunities for manufacturers lie in developing innovative, sustainable products tailored to specific crop needs and market segments. Focus on enhancing supply chain resilience and efficient distribution networks will be critical for sustained growth. The market is projected to experience a robust expansion over the forecast period, presenting significant investment potential for various players in the sector.
EMEA Secondary Macronutrients Market Segmentation
- 1. Production Analysis
- 2. Consumption Analysis
- 3. Import Market Analysis (Value & Volume)
- 4. Export Market Analysis (Value & Volume)
- 5. Price Trend Analysis
EMEA Secondary Macronutrients Market Segmentation By Geography
-
1. North America
- 1.1. United States
- 1.2. Canada
- 1.3. Mexico
-
2. South America
- 2.1. Brazil
- 2.2. Argentina
- 2.3. Rest of South America
-
3. Europe
- 3.1. United Kingdom
- 3.2. Germany
- 3.3. France
- 3.4. Italy
- 3.5. Spain
- 3.6. Russia
- 3.7. Benelux
- 3.8. Nordics
- 3.9. Rest of Europe
-
4. Middle East & Africa
- 4.1. Turkey
- 4.2. Israel
- 4.3. GCC
- 4.4. North Africa
- 4.5. South Africa
- 4.6. Rest of Middle East & Africa
-
5. Asia Pacific
- 5.1. China
- 5.2. India
- 5.3. Japan
- 5.4. South Korea
- 5.5. ASEAN
- 5.6. Oceania
- 5.7. Rest of Asia Pacific
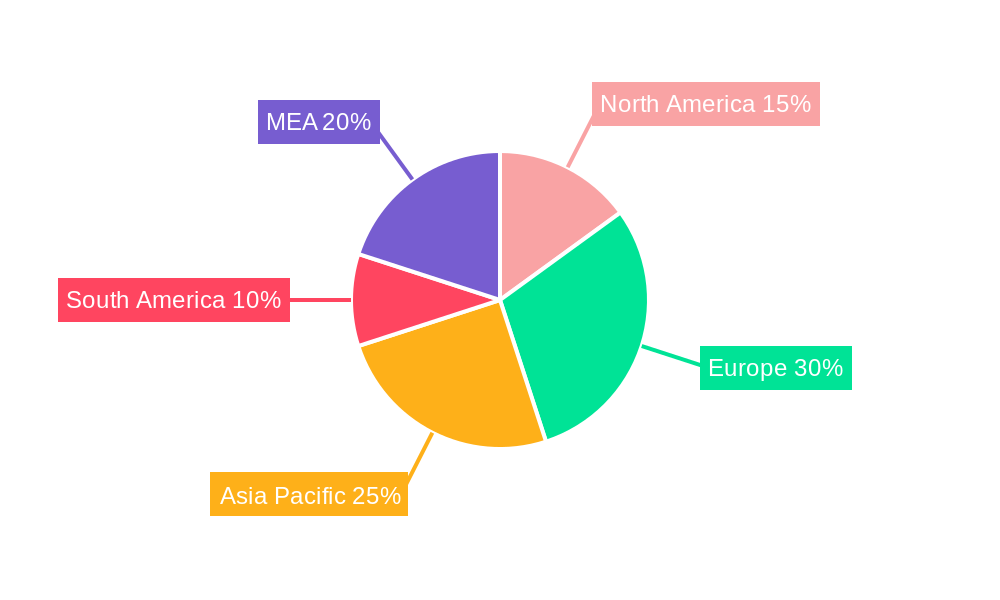
EMEA Secondary Macronutrients Market Regional Market Share
Geographic Coverage of EMEA Secondary Macronutrients Market
EMEA Secondary Macronutrients Market REPORT HIGHLIGHTS
| Aspects | Details |
|---|---|
| Study Period | 2020-2034 |
| Base Year | 2025 |
| Estimated Year | 2026 |
| Forecast Period | 2026-2034 |
| Historical Period | 2020-2025 |
| Growth Rate | CAGR of 4.20% from 2020-2034 |
| Segmentation |
|
Table of Contents
- 1. Introduction
- 1.1. Research Scope
- 1.2. Market Segmentation
- 1.3. Research Objective
- 1.4. Definitions and Assumptions
- 2. Executive Summary
- 2.1. Market Snapshot
- 3. Market Dynamics
- 3.1. Market Drivers
- 3.2. Market Restrains
- 3.3. Market Trends
- 3.4. Market Opportunities
- 4. Market Factor Analysis
- 4.1. Porters Five Forces
- 4.1.1. Bargaining Power of Suppliers
- 4.1.2. Bargaining Power of Buyers
- 4.1.3. Threat of New Entrants
- 4.1.4. Threat of Substitutes
- 4.1.5. Competitive Rivalry
- 4.2. PESTEL analysis
- 4.3. BCG Analysis
- 4.3.1. Stars (High Growth, High Market Share)
- 4.3.2. Cash Cows (Low Growth, High Market Share)
- 4.3.3. Question Mark (High Growth, Low Market Share)
- 4.3.4. Dogs (Low Growth, Low Market Share)
- 4.4. Ansoff Matrix Analysis
- 4.5. Supply Chain Analysis
- 4.6. Regulatory Landscape
- 4.7. Current Market Potential and Opportunity Assessment (TAM–SAM–SOM Framework)
- 4.8. TIR Analyst Note
- 4.1. Porters Five Forces
- 5. Market Analysis, Insights and Forecast 2021-2033
- 5.1. Market Analysis, Insights and Forecast - by Production Analysis
- 5.2. Market Analysis, Insights and Forecast - by Consumption Analysis
- 5.3. Market Analysis, Insights and Forecast - by Import Market Analysis (Value & Volume)
- 5.4. Market Analysis, Insights and Forecast - by Export Market Analysis (Value & Volume)
- 5.5. Market Analysis, Insights and Forecast - by Price Trend Analysis
- 5.6. Market Analysis, Insights and Forecast - by Region
- 5.6.1. North America
- 5.6.2. South America
- 5.6.3. Europe
- 5.6.4. Middle East & Africa
- 5.6.5. Asia Pacific
- 6. Global EMEA Secondary Macronutrients Market Analysis, Insights and Forecast, 2021-2033
- 6.1. Market Analysis, Insights and Forecast - by Production Analysis
- 6.2. Market Analysis, Insights and Forecast - by Consumption Analysis
- 6.3. Market Analysis, Insights and Forecast - by Import Market Analysis (Value & Volume)
- 6.4. Market Analysis, Insights and Forecast - by Export Market Analysis (Value & Volume)
- 6.5. Market Analysis, Insights and Forecast - by Price Trend Analysis
- 7. North America EMEA Secondary Macronutrients Market Analysis, Insights and Forecast, 2020-2032
- 7.1. Market Analysis, Insights and Forecast - by Production Analysis
- 7.2. Market Analysis, Insights and Forecast - by Consumption Analysis
- 7.3. Market Analysis, Insights and Forecast - by Import Market Analysis (Value & Volume)
- 7.4. Market Analysis, Insights and Forecast - by Export Market Analysis (Value & Volume)
- 7.5. Market Analysis, Insights and Forecast - by Price Trend Analysis
- 8. South America EMEA Secondary Macronutrients Market Analysis, Insights and Forecast, 2020-2032
- 8.1. Market Analysis, Insights and Forecast - by Production Analysis
- 8.2. Market Analysis, Insights and Forecast - by Consumption Analysis
- 8.3. Market Analysis, Insights and Forecast - by Import Market Analysis (Value & Volume)
- 8.4. Market Analysis, Insights and Forecast - by Export Market Analysis (Value & Volume)
- 8.5. Market Analysis, Insights and Forecast - by Price Trend Analysis
- 9. Europe EMEA Secondary Macronutrients Market Analysis, Insights and Forecast, 2020-2032
- 9.1. Market Analysis, Insights and Forecast - by Production Analysis
- 9.2. Market Analysis, Insights and Forecast - by Consumption Analysis
- 9.3. Market Analysis, Insights and Forecast - by Import Market Analysis (Value & Volume)
- 9.4. Market Analysis, Insights and Forecast - by Export Market Analysis (Value & Volume)
- 9.5. Market Analysis, Insights and Forecast - by Price Trend Analysis
- 10. Middle East & Africa EMEA Secondary Macronutrients Market Analysis, Insights and Forecast, 2020-2032
- 10.1. Market Analysis, Insights and Forecast - by Production Analysis
- 10.2. Market Analysis, Insights and Forecast - by Consumption Analysis
- 10.3. Market Analysis, Insights and Forecast - by Import Market Analysis (Value & Volume)
- 10.4. Market Analysis, Insights and Forecast - by Export Market Analysis (Value & Volume)
- 10.5. Market Analysis, Insights and Forecast - by Price Trend Analysis
- 11. Asia Pacific EMEA Secondary Macronutrients Market Analysis, Insights and Forecast, 2020-2032
- 11.1. Market Analysis, Insights and Forecast - by Production Analysis
- 11.2. Market Analysis, Insights and Forecast - by Consumption Analysis
- 11.3. Market Analysis, Insights and Forecast - by Import Market Analysis (Value & Volume)
- 11.4. Market Analysis, Insights and Forecast - by Export Market Analysis (Value & Volume)
- 11.5. Market Analysis, Insights and Forecast - by Price Trend Analysis
- 12. Competitive Analysis
- 12.1. Company Profiles
- 12.1.1 Haifa Group
- 12.1.1.1. Company Overview
- 12.1.1.2. Products
- 12.1.1.3. Company Financials
- 12.1.1.4. SWOT Analysis
- 12.1.2 Eurochem Group AG
- 12.1.2.1. Company Overview
- 12.1.2.2. Products
- 12.1.2.3. Company Financials
- 12.1.2.4. SWOT Analysis
- 12.1.3 K+S Company
- 12.1.3.1. Company Overview
- 12.1.3.2. Products
- 12.1.3.3. Company Financials
- 12.1.3.4. SWOT Analysis
- 12.1.4 Trade Corporation International SA
- 12.1.4.1. Company Overview
- 12.1.4.2. Products
- 12.1.4.3. Company Financials
- 12.1.4.4. SWOT Analysis
- 12.1.5 SAF Sulphur Company
- 12.1.5.1. Company Overview
- 12.1.5.2. Products
- 12.1.5.3. Company Financials
- 12.1.5.4. SWOT Analysis
- 12.1.6 Saudi United Fertilizer Company (al-asmida)
- 12.1.6.1. Company Overview
- 12.1.6.2. Products
- 12.1.6.3. Company Financials
- 12.1.6.4. SWOT Analysis
- 12.1.7 Al-tayseer Chemical Industry
- 12.1.7.1. Company Overview
- 12.1.7.2. Products
- 12.1.7.3. Company Financials
- 12.1.7.4. SWOT Analysis
- 12.1.8 Israel Chemical Company
- 12.1.8.1. Company Overview
- 12.1.8.2. Products
- 12.1.8.3. Company Financials
- 12.1.8.4. SWOT Analysis
- 12.1.9 Takamul National Agriculture
- 12.1.9.1. Company Overview
- 12.1.9.2. Products
- 12.1.9.3. Company Financials
- 12.1.9.4. SWOT Analysis
- 12.1.10 Yara International ASA
- 12.1.10.1. Company Overview
- 12.1.10.2. Products
- 12.1.10.3. Company Financials
- 12.1.10.4. SWOT Analysis
- 12.1.1 Haifa Group
- 12.2. Market Entropy
- 12.2.1 Company's Key Areas Served
- 12.2.2 Recent Developments
- 12.3. Company Market Share Analysis 2025
- 12.3.1 Top 5 Companies Market Share Analysis
- 12.3.2 Top 3 Companies Market Share Analysis
- 12.4. List of Potential Customers
- 13. Research Methodology
List of Figures
- Figure 1: Global EMEA Secondary Macronutrients Market Revenue Breakdown (Million, %) by Region 2025 & 2033
- Figure 2: North America EMEA Secondary Macronutrients Market Revenue (Million), by Production Analysis 2025 & 2033
- Figure 3: North America EMEA Secondary Macronutrients Market Revenue Share (%), by Production Analysis 2025 & 2033
- Figure 4: North America EMEA Secondary Macronutrients Market Revenue (Million), by Consumption Analysis 2025 & 2033
- Figure 5: North America EMEA Secondary Macronutrients Market Revenue Share (%), by Consumption Analysis 2025 & 2033
- Figure 6: North America EMEA Secondary Macronutrients Market Revenue (Million), by Import Market Analysis (Value & Volume) 2025 & 2033
- Figure 7: North America EMEA Secondary Macronutrients Market Revenue Share (%), by Import Market Analysis (Value & Volume) 2025 & 2033
- Figure 8: North America EMEA Secondary Macronutrients Market Revenue (Million), by Export Market Analysis (Value & Volume) 2025 & 2033
- Figure 9: North America EMEA Secondary Macronutrients Market Revenue Share (%), by Export Market Analysis (Value & Volume) 2025 & 2033
- Figure 10: North America EMEA Secondary Macronutrients Market Revenue (Million), by Price Trend Analysis 2025 & 2033
- Figure 11: North America EMEA Secondary Macronutrients Market Revenue Share (%), by Price Trend Analysis 2025 & 2033
- Figure 12: North America EMEA Secondary Macronutrients Market Revenue (Million), by Country 2025 & 2033
- Figure 13: North America EMEA Secondary Macronutrients Market Revenue Share (%), by Country 2025 & 2033
- Figure 14: South America EMEA Secondary Macronutrients Market Revenue (Million), by Production Analysis 2025 & 2033
- Figure 15: South America EMEA Secondary Macronutrients Market Revenue Share (%), by Production Analysis 2025 & 2033
- Figure 16: South America EMEA Secondary Macronutrients Market Revenue (Million), by Consumption Analysis 2025 & 2033
- Figure 17: South America EMEA Secondary Macronutrients Market Revenue Share (%), by Consumption Analysis 2025 & 2033
- Figure 18: South America EMEA Secondary Macronutrients Market Revenue (Million), by Import Market Analysis (Value & Volume) 2025 & 2033
- Figure 19: South America EMEA Secondary Macronutrients Market Revenue Share (%), by Import Market Analysis (Value & Volume) 2025 & 2033
- Figure 20: South America EMEA Secondary Macronutrients Market Revenue (Million), by Export Market Analysis (Value & Volume) 2025 & 2033
- Figure 21: South America EMEA Secondary Macronutrients Market Revenue Share (%), by Export Market Analysis (Value & Volume) 2025 & 2033
- Figure 22: South America EMEA Secondary Macronutrients Market Revenue (Million), by Price Trend Analysis 2025 & 2033
- Figure 23: South America EMEA Secondary Macronutrients Market Revenue Share (%), by Price Trend Analysis 2025 & 2033
- Figure 24: South America EMEA Secondary Macronutrients Market Revenue (Million), by Country 2025 & 2033
- Figure 25: South America EMEA Secondary Macronutrients Market Revenue Share (%), by Country 2025 & 2033
- Figure 26: Europe EMEA Secondary Macronutrients Market Revenue (Million), by Production Analysis 2025 & 2033
- Figure 27: Europe EMEA Secondary Macronutrients Market Revenue Share (%), by Production Analysis 2025 & 2033
- Figure 28: Europe EMEA Secondary Macronutrients Market Revenue (Million), by Consumption Analysis 2025 & 2033
- Figure 29: Europe EMEA Secondary Macronutrients Market Revenue Share (%), by Consumption Analysis 2025 & 2033
- Figure 30: Europe EMEA Secondary Macronutrients Market Revenue (Million), by Import Market Analysis (Value & Volume) 2025 & 2033
- Figure 31: Europe EMEA Secondary Macronutrients Market Revenue Share (%), by Import Market Analysis (Value & Volume) 2025 & 2033
- Figure 32: Europe EMEA Secondary Macronutrients Market Revenue (Million), by Export Market Analysis (Value & Volume) 2025 & 2033
- Figure 33: Europe EMEA Secondary Macronutrients Market Revenue Share (%), by Export Market Analysis (Value & Volume) 2025 & 2033
- Figure 34: Europe EMEA Secondary Macronutrients Market Revenue (Million), by Price Trend Analysis 2025 & 2033
- Figure 35: Europe EMEA Secondary Macronutrients Market Revenue Share (%), by Price Trend Analysis 2025 & 2033
- Figure 36: Europe EMEA Secondary Macronutrients Market Revenue (Million), by Country 2025 & 2033
- Figure 37: Europe EMEA Secondary Macronutrients Market Revenue Share (%), by Country 2025 & 2033
- Figure 38: Middle East & Africa EMEA Secondary Macronutrients Market Revenue (Million), by Production Analysis 2025 & 2033
- Figure 39: Middle East & Africa EMEA Secondary Macronutrients Market Revenue Share (%), by Production Analysis 2025 & 2033
- Figure 40: Middle East & Africa EMEA Secondary Macronutrients Market Revenue (Million), by Consumption Analysis 2025 & 2033
- Figure 41: Middle East & Africa EMEA Secondary Macronutrients Market Revenue Share (%), by Consumption Analysis 2025 & 2033
- Figure 42: Middle East & Africa EMEA Secondary Macronutrients Market Revenue (Million), by Import Market Analysis (Value & Volume) 2025 & 2033
- Figure 43: Middle East & Africa EMEA Secondary Macronutrients Market Revenue Share (%), by Import Market Analysis (Value & Volume) 2025 & 2033
- Figure 44: Middle East & Africa EMEA Secondary Macronutrients Market Revenue (Million), by Export Market Analysis (Value & Volume) 2025 & 2033
- Figure 45: Middle East & Africa EMEA Secondary Macronutrients Market Revenue Share (%), by Export Market Analysis (Value & Volume) 2025 & 2033
- Figure 46: Middle East & Africa EMEA Secondary Macronutrients Market Revenue (Million), by Price Trend Analysis 2025 & 2033
- Figure 47: Middle East & Africa EMEA Secondary Macronutrients Market Revenue Share (%), by Price Trend Analysis 2025 & 2033
- Figure 48: Middle East & Africa EMEA Secondary Macronutrients Market Revenue (Million), by Country 2025 & 2033
- Figure 49: Middle East & Africa EMEA Secondary Macronutrients Market Revenue Share (%), by Country 2025 & 2033
- Figure 50: Asia Pacific EMEA Secondary Macronutrients Market Revenue (Million), by Production Analysis 2025 & 2033
- Figure 51: Asia Pacific EMEA Secondary Macronutrients Market Revenue Share (%), by Production Analysis 2025 & 2033
- Figure 52: Asia Pacific EMEA Secondary Macronutrients Market Revenue (Million), by Consumption Analysis 2025 & 2033
- Figure 53: Asia Pacific EMEA Secondary Macronutrients Market Revenue Share (%), by Consumption Analysis 2025 & 2033
- Figure 54: Asia Pacific EMEA Secondary Macronutrients Market Revenue (Million), by Import Market Analysis (Value & Volume) 2025 & 2033
- Figure 55: Asia Pacific EMEA Secondary Macronutrients Market Revenue Share (%), by Import Market Analysis (Value & Volume) 2025 & 2033
- Figure 56: Asia Pacific EMEA Secondary Macronutrients Market Revenue (Million), by Export Market Analysis (Value & Volume) 2025 & 2033
- Figure 57: Asia Pacific EMEA Secondary Macronutrients Market Revenue Share (%), by Export Market Analysis (Value & Volume) 2025 & 2033
- Figure 58: Asia Pacific EMEA Secondary Macronutrients Market Revenue (Million), by Price Trend Analysis 2025 & 2033
- Figure 59: Asia Pacific EMEA Secondary Macronutrients Market Revenue Share (%), by Price Trend Analysis 2025 & 2033
- Figure 60: Asia Pacific EMEA Secondary Macronutrients Market Revenue (Million), by Country 2025 & 2033
- Figure 61: Asia Pacific EMEA Secondary Macronutrients Market Revenue Share (%), by Country 2025 & 2033
List of Tables
- Table 1: Global EMEA Secondary Macronutrients Market Revenue Million Forecast, by Production Analysis 2020 & 2033
- Table 2: Global EMEA Secondary Macronutrients Market Revenue Million Forecast, by Consumption Analysis 2020 & 2033
- Table 3: Global EMEA Secondary Macronutrients Market Revenue Million Forecast, by Import Market Analysis (Value & Volume) 2020 & 2033
- Table 4: Global EMEA Secondary Macronutrients Market Revenue Million Forecast, by Export Market Analysis (Value & Volume) 2020 & 2033
- Table 5: Global EMEA Secondary Macronutrients Market Revenue Million Forecast, by Price Trend Analysis 2020 & 2033
- Table 6: Global EMEA Secondary Macronutrients Market Revenue Million Forecast, by Region 2020 & 2033
- Table 7: Global EMEA Secondary Macronutrients Market Revenue Million Forecast, by Production Analysis 2020 & 2033
- Table 8: Global EMEA Secondary Macronutrients Market Revenue Million Forecast, by Consumption Analysis 2020 & 2033
- Table 9: Global EMEA Secondary Macronutrients Market Revenue Million Forecast, by Import Market Analysis (Value & Volume) 2020 & 2033
- Table 10: Global EMEA Secondary Macronutrients Market Revenue Million Forecast, by Export Market Analysis (Value & Volume) 2020 & 2033
- Table 11: Global EMEA Secondary Macronutrients Market Revenue Million Forecast, by Price Trend Analysis 2020 & 2033
- Table 12: Global EMEA Secondary Macronutrients Market Revenue Million Forecast, by Country 2020 & 2033
- Table 13: United States EMEA Secondary Macronutrients Market Revenue (Million) Forecast, by Application 2020 & 2033
- Table 14: Canada EMEA Secondary Macronutrients Market Revenue (Million) Forecast, by Application 2020 & 2033
- Table 15: Mexico EMEA Secondary Macronutrients Market Revenue (Million) Forecast, by Application 2020 & 2033
- Table 16: Global EMEA Secondary Macronutrients Market Revenue Million Forecast, by Production Analysis 2020 & 2033
- Table 17: Global EMEA Secondary Macronutrients Market Revenue Million Forecast, by Consumption Analysis 2020 & 2033
- Table 18: Global EMEA Secondary Macronutrients Market Revenue Million Forecast, by Import Market Analysis (Value & Volume) 2020 & 2033
- Table 19: Global EMEA Secondary Macronutrients Market Revenue Million Forecast, by Export Market Analysis (Value & Volume) 2020 & 2033
- Table 20: Global EMEA Secondary Macronutrients Market Revenue Million Forecast, by Price Trend Analysis 2020 & 2033
- Table 21: Global EMEA Secondary Macronutrients Market Revenue Million Forecast, by Country 2020 & 2033
- Table 22: Brazil EMEA Secondary Macronutrients Market Revenue (Million) Forecast, by Application 2020 & 2033
- Table 23: Argentina EMEA Secondary Macronutrients Market Revenue (Million) Forecast, by Application 2020 & 2033
- Table 24: Rest of South America EMEA Secondary Macronutrients Market Revenue (Million) Forecast, by Application 2020 & 2033
- Table 25: Global EMEA Secondary Macronutrients Market Revenue Million Forecast, by Production Analysis 2020 & 2033
- Table 26: Global EMEA Secondary Macronutrients Market Revenue Million Forecast, by Consumption Analysis 2020 & 2033
- Table 27: Global EMEA Secondary Macronutrients Market Revenue Million Forecast, by Import Market Analysis (Value & Volume) 2020 & 2033
- Table 28: Global EMEA Secondary Macronutrients Market Revenue Million Forecast, by Export Market Analysis (Value & Volume) 2020 & 2033
- Table 29: Global EMEA Secondary Macronutrients Market Revenue Million Forecast, by Price Trend Analysis 2020 & 2033
- Table 30: Global EMEA Secondary Macronutrients Market Revenue Million Forecast, by Country 2020 & 2033
- Table 31: United Kingdom EMEA Secondary Macronutrients Market Revenue (Million) Forecast, by Application 2020 & 2033
- Table 32: Germany EMEA Secondary Macronutrients Market Revenue (Million) Forecast, by Application 2020 & 2033
- Table 33: France EMEA Secondary Macronutrients Market Revenue (Million) Forecast, by Application 2020 & 2033
- Table 34: Italy EMEA Secondary Macronutrients Market Revenue (Million) Forecast, by Application 2020 & 2033
- Table 35: Spain EMEA Secondary Macronutrients Market Revenue (Million) Forecast, by Application 2020 & 2033
- Table 36: Russia EMEA Secondary Macronutrients Market Revenue (Million) Forecast, by Application 2020 & 2033
- Table 37: Benelux EMEA Secondary Macronutrients Market Revenue (Million) Forecast, by Application 2020 & 2033
- Table 38: Nordics EMEA Secondary Macronutrients Market Revenue (Million) Forecast, by Application 2020 & 2033
- Table 39: Rest of Europe EMEA Secondary Macronutrients Market Revenue (Million) Forecast, by Application 2020 & 2033
- Table 40: Global EMEA Secondary Macronutrients Market Revenue Million Forecast, by Production Analysis 2020 & 2033
- Table 41: Global EMEA Secondary Macronutrients Market Revenue Million Forecast, by Consumption Analysis 2020 & 2033
- Table 42: Global EMEA Secondary Macronutrients Market Revenue Million Forecast, by Import Market Analysis (Value & Volume) 2020 & 2033
- Table 43: Global EMEA Secondary Macronutrients Market Revenue Million Forecast, by Export Market Analysis (Value & Volume) 2020 & 2033
- Table 44: Global EMEA Secondary Macronutrients Market Revenue Million Forecast, by Price Trend Analysis 2020 & 2033
- Table 45: Global EMEA Secondary Macronutrients Market Revenue Million Forecast, by Country 2020 & 2033
- Table 46: Turkey EMEA Secondary Macronutrients Market Revenue (Million) Forecast, by Application 2020 & 2033
- Table 47: Israel EMEA Secondary Macronutrients Market Revenue (Million) Forecast, by Application 2020 & 2033
- Table 48: GCC EMEA Secondary Macronutrients Market Revenue (Million) Forecast, by Application 2020 & 2033
- Table 49: North Africa EMEA Secondary Macronutrients Market Revenue (Million) Forecast, by Application 2020 & 2033
- Table 50: South Africa EMEA Secondary Macronutrients Market Revenue (Million) Forecast, by Application 2020 & 2033
- Table 51: Rest of Middle East & Africa EMEA Secondary Macronutrients Market Revenue (Million) Forecast, by Application 2020 & 2033
- Table 52: Global EMEA Secondary Macronutrients Market Revenue Million Forecast, by Production Analysis 2020 & 2033
- Table 53: Global EMEA Secondary Macronutrients Market Revenue Million Forecast, by Consumption Analysis 2020 & 2033
- Table 54: Global EMEA Secondary Macronutrients Market Revenue Million Forecast, by Import Market Analysis (Value & Volume) 2020 & 2033
- Table 55: Global EMEA Secondary Macronutrients Market Revenue Million Forecast, by Export Market Analysis (Value & Volume) 2020 & 2033
- Table 56: Global EMEA Secondary Macronutrients Market Revenue Million Forecast, by Price Trend Analysis 2020 & 2033
- Table 57: Global EMEA Secondary Macronutrients Market Revenue Million Forecast, by Country 2020 & 2033
- Table 58: China EMEA Secondary Macronutrients Market Revenue (Million) Forecast, by Application 2020 & 2033
- Table 59: India EMEA Secondary Macronutrients Market Revenue (Million) Forecast, by Application 2020 & 2033
- Table 60: Japan EMEA Secondary Macronutrients Market Revenue (Million) Forecast, by Application 2020 & 2033
- Table 61: South Korea EMEA Secondary Macronutrients Market Revenue (Million) Forecast, by Application 2020 & 2033
- Table 62: ASEAN EMEA Secondary Macronutrients Market Revenue (Million) Forecast, by Application 2020 & 2033
- Table 63: Oceania EMEA Secondary Macronutrients Market Revenue (Million) Forecast, by Application 2020 & 2033
- Table 64: Rest of Asia Pacific EMEA Secondary Macronutrients Market Revenue (Million) Forecast, by Application 2020 & 2033
Frequently Asked Questions
1. What is the projected Compound Annual Growth Rate (CAGR) of the EMEA Secondary Macronutrients Market?
The projected CAGR is approximately 4.20%.
2. Which companies are prominent players in the EMEA Secondary Macronutrients Market?
Key companies in the market include Haifa Group, Eurochem Group AG, K+S Company, Trade Corporation International SA, SAF Sulphur Company, Saudi United Fertilizer Company (al-asmida), Al-tayseer Chemical Industry, Israel Chemical Company, Takamul National Agriculture, Yara International ASA.
3. What are the main segments of the EMEA Secondary Macronutrients Market?
The market segments include Production Analysis, Consumption Analysis, Import Market Analysis (Value & Volume), Export Market Analysis (Value & Volume), Price Trend Analysis.
4. Can you provide details about the market size?
The market size is estimated to be USD 4.23 Million as of 2022.
5. What are some drivers contributing to market growth?
Seed Treatment As A Solution To Enhance Yield; Growing Awareness For Seed Treatment Among The Farmers; Rising Trend Of Organic Farming.
6. What are the notable trends driving market growth?
Secondary Macronutrients Ensure Healthy Plant Growth.
7. Are there any restraints impacting market growth?
Limitations Across Farm-Level Seed Treatment; Rising Environmental Concerns.
8. Can you provide examples of recent developments in the market?
N/A
9. What pricing options are available for accessing the report?
Pricing options include single-user, multi-user, and enterprise licenses priced at USD 4750, USD 5250, and USD 8750 respectively.
10. Is the market size provided in terms of value or volume?
The market size is provided in terms of value, measured in Million.
11. Are there any specific market keywords associated with the report?
Yes, the market keyword associated with the report is "EMEA Secondary Macronutrients Market," which aids in identifying and referencing the specific market segment covered.
12. How do I determine which pricing option suits my needs best?
The pricing options vary based on user requirements and access needs. Individual users may opt for single-user licenses, while businesses requiring broader access may choose multi-user or enterprise licenses for cost-effective access to the report.
13. Are there any additional resources or data provided in the EMEA Secondary Macronutrients Market report?
While the report offers comprehensive insights, it's advisable to review the specific contents or supplementary materials provided to ascertain if additional resources or data are available.
14. How can I stay updated on further developments or reports in the EMEA Secondary Macronutrients Market?
To stay informed about further developments, trends, and reports in the EMEA Secondary Macronutrients Market, consider subscribing to industry newsletters, following relevant companies and organizations, or regularly checking reputable industry news sources and publications.
Methodology
Step 1 - Identification of Relevant Samples Size from Population Database


Step 2 - Approaches for Defining Global Market Size (Value, Volume* & Price*)

Note*: In applicable scenarios
Step 3 - Data Sources
Primary Research
- Web Analytics
- Survey Reports
- Research Institute
- Latest Research Reports
- Opinion Leaders
Secondary Research
- Annual Reports
- White Paper
- Latest Press Release
- Industry Association
- Paid Database
- Investor Presentations

Step 4 - Data Triangulation
Involves using different sources of information in order to increase the validity of a study
These sources are likely to be stakeholders in a program - participants, other researchers, program staff, other community members, and so on.
Then we put all data in single framework & apply various statistical tools to find out the dynamic on the market.
During the analysis stage, feedback from the stakeholder groups would be compared to determine areas of agreement as well as areas of divergence