

Key Insights
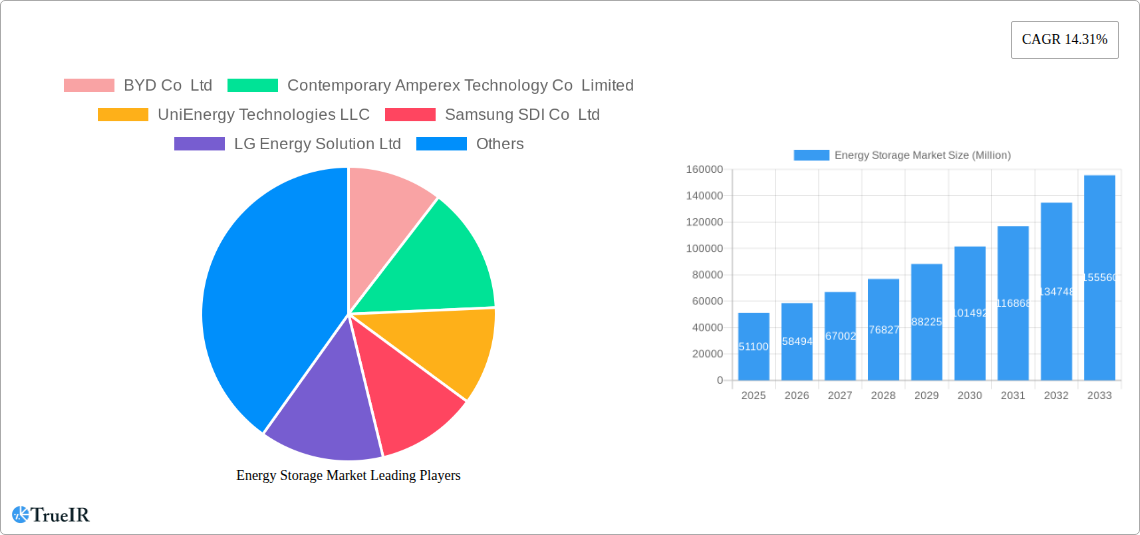
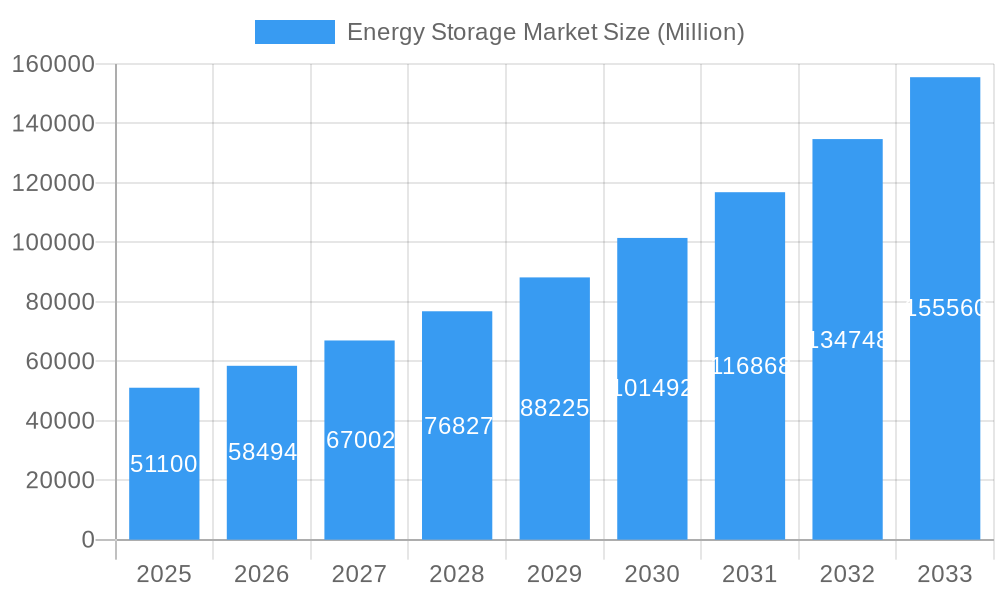
The global energy storage market, valued at $51.10 billion in 2025, is projected to experience robust growth, driven by the increasing adoption of renewable energy sources, the need for grid stabilization, and the rising demand for backup power solutions across residential, commercial, and industrial sectors. The market's Compound Annual Growth Rate (CAGR) of 14.31% from 2025 to 2033 indicates significant expansion over the forecast period. Key growth drivers include supportive government policies promoting clean energy transition, declining battery costs, and technological advancements in various energy storage technologies like lithium-ion batteries, pumped-storage hydroelectricity (PSH), and thermal energy storage (TES). The residential segment is witnessing rapid growth due to increased awareness of energy efficiency and self-sufficiency, while the commercial and industrial sectors are adopting energy storage solutions to improve grid reliability and reduce operational costs. Competition is intense, with major players like BYD, CATL, Tesla, and LG Energy Solution leading the market, constantly innovating to improve efficiency, lifespan, and safety of their energy storage products. This competitive landscape fosters further innovation and accelerates market growth.
Energy Storage Market Market Size (In Billion)
The diverse range of energy storage technologies presents both opportunities and challenges. Lithium-ion batteries currently dominate the market due to their high energy density and versatility, but concerns regarding raw material sourcing and environmental impact persist. Pumped-storage hydroelectricity offers a large-scale solution, but its geographical limitations constrain its widespread adoption. Thermal energy storage and flywheel energy storage technologies are emerging as viable alternatives with specific application advantages. Market growth will be influenced by factors such as the availability of raw materials, technological advancements in battery chemistry, grid infrastructure development, and the overall global transition towards renewable energy. Regional variations in market growth are expected, with Asia Pacific anticipated to lead due to strong economic growth and government support for renewable energy, followed by North America and Europe.
Energy Storage Market Company Market Share
Energy Storage Market: A Comprehensive Report (2019-2033)
This dynamic report provides a detailed analysis of the global energy storage market, encompassing market size, growth projections, competitive landscape, and key technological advancements from 2019 to 2033. The study covers a range of energy storage types, applications, and key players, offering valuable insights for investors, industry professionals, and policymakers. With a base year of 2025 and a forecast period extending to 2033, this report is an indispensable resource for understanding the future of energy storage. The market is projected to reach xx Million by 2033, exhibiting a significant CAGR of xx% during the forecast period.
Energy Storage Market Structure & Competitive Landscape
The energy storage market exhibits a moderately concentrated structure, with a few dominant players capturing a significant market share. However, the market is witnessing increased competition from new entrants, particularly in niche segments like zinc-ion batteries. Innovation plays a crucial role, driven by advancements in battery chemistry, thermal storage technologies, and control systems. Regulatory frameworks, including incentives and grid integration standards, significantly influence market growth and deployment. Product substitutes, such as conventional power generation methods, continue to compete for market share, though the increasing need for grid stability and renewable energy integration fuels demand for energy storage solutions. M&A activity within the sector remains relatively high, indicating both consolidation and expansion efforts. The market concentration ratio (CR4) is estimated at xx%, indicating a moderate level of concentration. M&A activity in the period 2019-2024 involved approximately xx Million in deals.
- High Barriers to Entry: Significant capital investment and technological expertise required.
- Increasing Competition: New entrants and diversification from established players.
- Regulatory Landscape: Government policies and incentives influence market growth.
- Technological Advancements: Continuous development in battery technologies and storage solutions.
- End-User Segmentation: Residential, commercial, and industrial sectors contribute differently to market demand.
Energy Storage Market Trends & Opportunities
The energy storage market is experiencing robust growth, driven by several factors. The increasing adoption of renewable energy sources like solar and wind power necessitates reliable energy storage solutions to address intermittency issues. This is further amplified by rising electricity prices and growing concerns about energy security. Technological advancements, such as the development of more efficient and cost-effective battery technologies (e.g., solid-state batteries, improved lithium-ion chemistries), are opening new market opportunities. Consumer preferences are shifting towards cleaner energy solutions and decentralized energy systems, enhancing the appeal of residential energy storage systems. The competitive dynamics are characterized by ongoing innovation, strategic partnerships, and mergers and acquisitions. Market size is expected to reach xx Million by 2025, growing at a CAGR of xx% from 2025 to 2033. Market penetration rate for residential energy storage is projected to reach xx% by 2033.
Dominant Markets & Segments in Energy Storage Market
The Asia-Pacific region currently dominates the energy storage market, driven by strong economic growth, supportive government policies, and substantial investments in renewable energy infrastructure. China, in particular, is a leading market due to its massive renewable energy deployment and ambitious decarbonization targets. Within segments, Battery storage technologies hold the largest share, while the Pumped-storage Hydroelectricity (PSH) segment accounts for a substantial share due to its established technology and scalability.
Key Growth Drivers:
- Government policies and incentives: Subsidies, tax credits, and renewable energy mandates.
- Rising electricity prices and energy security concerns.
- Growth of renewable energy installations.
- Technological advancements and cost reductions.
Segment Analysis:
- Batteries: Dominated by lithium-ion, but alternative technologies like flow batteries are gaining traction.
- Pumped-storage Hydroelectricity (PSH): Mature technology suitable for large-scale energy storage.
- Thermal Energy Storage (TES): Growing interest in applications like industrial process heat.
- Flywheel Energy Storage (FES): Niche applications with advantages in high-power applications.
- Other Types: Emerging technologies like compressed air energy storage (CAES) are showing promise.
- Application: Commercial and Industrial sectors demonstrate the highest growth potential.
Energy Storage Market Product Analysis
Significant product innovations are reshaping the energy storage market. Advancements in battery chemistry are leading to increased energy density, longer lifespans, and improved safety profiles. New thermal energy storage technologies are offering higher efficiency and better integration with renewable energy sources. The competitive advantage hinges on factors like cost-effectiveness, efficiency, lifespan, safety, and ease of integration with existing grid infrastructure. These innovations are enhancing the market fit of energy storage solutions across various applications.
Key Drivers, Barriers & Challenges in Energy Storage Market
Key Drivers: The transition to renewable energy, the need for grid stabilization, and the increasing demand for reliable and efficient power sources are key factors driving market growth. Government policies promoting renewable energy and energy storage are also playing a crucial role. Technological advancements leading to improved efficiency and reduced costs are further fueling the market's expansion.
Challenges: Supply chain disruptions, particularly for critical raw materials like lithium, pose a significant challenge. High upfront capital costs for large-scale energy storage projects can limit adoption, especially in developing countries. Regulatory uncertainty and inconsistent standards related to grid integration and safety can impede market growth. Furthermore, competition from established energy sources and the need for efficient recycling and disposal solutions for spent batteries pose further challenges.
Growth Drivers in the Energy Storage Market Market
Technological advancements, including improvements in battery chemistry and thermal storage, are driving cost reductions and increased efficiency, leading to wider adoption. Government policies promoting renewable energy and incentivizing energy storage deployment are also crucial drivers. The increasing demand for grid stability and reliability due to the integration of intermittent renewable energy sources is another major impetus for market growth.
Challenges Impacting Energy Storage Market Growth
High initial investment costs, especially for large-scale projects, represent a significant barrier to wider adoption. Supply chain complexities and geopolitical factors can impact the availability of critical raw materials. Concerns about battery safety and lifecycle management, along with regulatory uncertainties and evolving grid integration standards, pose further challenges to market expansion.
Key Players Shaping the Energy Storage Market Market
- BYD Co Ltd
- Contemporary Amperex Technology Co Limited
- UniEnergy Technologies LLC
- Samsung SDI Co Ltd
- LG Energy Solution Ltd
- NGK Insulators Ltd
- Tesla Inc
- Clarios (Formerly Johnson Controls International PLC)
- GS Yuasa Corporation
Significant Energy Storage Market Industry Milestones
- February 2022: FIMER and Vega Solar partnership supplies 14 PVS-100 inverters to Albania, showcasing advancements in cost-effective decentralized solar systems.
- May 2022: Salient Energy partners with Horton World Solutions, promoting the adoption of zinc-ion batteries for residential energy storage, highlighting the rise of alternative battery technologies.
Future Outlook for Energy Storage Market Market
The energy storage market is poised for substantial growth, driven by a confluence of factors. Continued technological advancements, supportive government policies, and the increasing need for grid stability and resilience will create significant opportunities for market expansion. The focus on sustainable energy solutions and improving energy efficiency across various sectors will fuel further demand. Strategic partnerships and investments in research and development will accelerate innovation and the introduction of new energy storage technologies and solutions.
Energy Storage Market Segmentation
-
1. Type
- 1.1. Batteries
- 1.2. Pumped-storage Hydroelectricity (PSH)
- 1.3. Thermal Energy Storage (TES)
- 1.4. Flywheel Energy Storage (FES)
- 1.5. Other Types
-
2. Application
- 2.1. Residential
- 2.2. Commercial and Industrial
Energy Storage Market Segmentation By Geography
-
1. North America
- 1.1. United States
- 1.2. Canada
- 1.3. Rest of North America
-
2. Asia Pacific
- 2.1. India
- 2.2. China
- 2.3. Australia
- 2.4. Rest of Asia Pacific
-
3. Europe
- 3.1. Germany
- 3.2. United Kingdom
- 3.3. Rest of Europe
-
4. South America
- 4.1. Brazil
- 4.2. Argentina
- 4.3. Rest of South America
-
5. Middle East and Africa
- 5.1. Saudi Arabia
- 5.2. Iraq
- 5.3. Jordan
- 5.4. Rest of Middle East and Africa
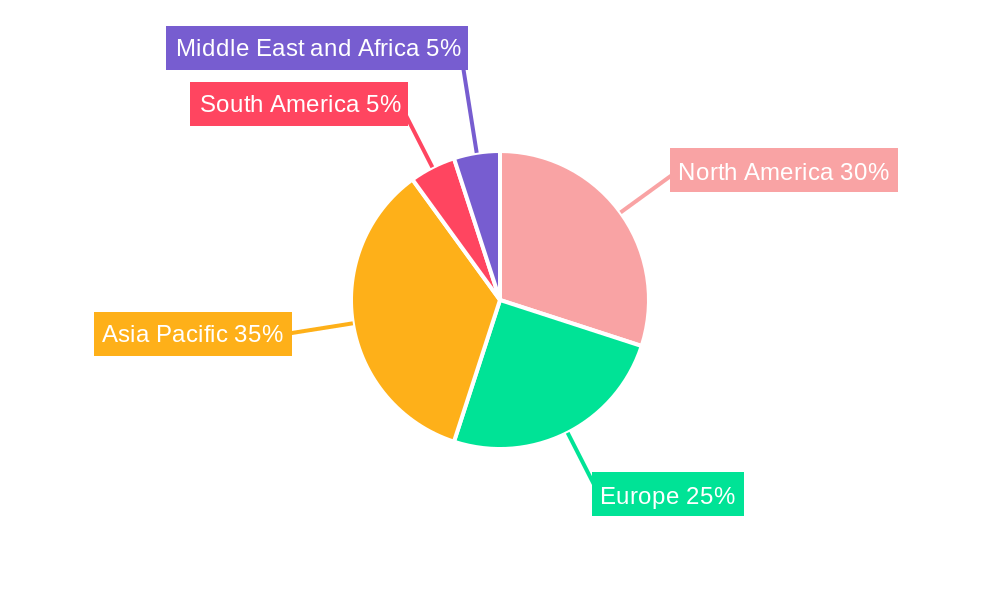
Energy Storage Market Regional Market Share
Geographic Coverage of Energy Storage Market
Energy Storage Market REPORT HIGHLIGHTS
| Aspects | Details |
|---|---|
| Study Period | 2020-2034 |
| Base Year | 2025 |
| Estimated Year | 2026 |
| Forecast Period | 2026-2034 |
| Historical Period | 2020-2025 |
| Growth Rate | CAGR of 14.31% from 2020-2034 |
| Segmentation |
|
Table of Contents
- 1. Introduction
- 1.1. Research Scope
- 1.2. Market Segmentation
- 1.3. Research Objective
- 1.4. Definitions and Assumptions
- 2. Executive Summary
- 2.1. Market Snapshot
- 3. Market Dynamics
- 3.1. Market Drivers
- 3.2. Market Restrains
- 3.3. Market Trends
- 3.4. Market Opportunities
- 4. Market Factor Analysis
- 4.1. Porters Five Forces
- 4.1.1. Bargaining Power of Suppliers
- 4.1.2. Bargaining Power of Buyers
- 4.1.3. Threat of New Entrants
- 4.1.4. Threat of Substitutes
- 4.1.5. Competitive Rivalry
- 4.2. PESTEL analysis
- 4.3. BCG Analysis
- 4.3.1. Stars (High Growth, High Market Share)
- 4.3.2. Cash Cows (Low Growth, High Market Share)
- 4.3.3. Question Mark (High Growth, Low Market Share)
- 4.3.4. Dogs (Low Growth, Low Market Share)
- 4.4. Ansoff Matrix Analysis
- 4.5. Supply Chain Analysis
- 4.6. Regulatory Landscape
- 4.7. Current Market Potential and Opportunity Assessment (TAM–SAM–SOM Framework)
- 4.8. TIR Analyst Note
- 4.1. Porters Five Forces
- 5. Market Analysis, Insights and Forecast 2021-2033
- 5.1. Market Analysis, Insights and Forecast - by Type
- 5.1.1. Batteries
- 5.1.2. Pumped-storage Hydroelectricity (PSH)
- 5.1.3. Thermal Energy Storage (TES)
- 5.1.4. Flywheel Energy Storage (FES)
- 5.1.5. Other Types
- 5.2. Market Analysis, Insights and Forecast - by Application
- 5.2.1. Residential
- 5.2.2. Commercial and Industrial
- 5.3. Market Analysis, Insights and Forecast - by Region
- 5.3.1. North America
- 5.3.2. Asia Pacific
- 5.3.3. Europe
- 5.3.4. South America
- 5.3.5. Middle East and Africa
- 5.1. Market Analysis, Insights and Forecast - by Type
- 6. Global Energy Storage Market Analysis, Insights and Forecast, 2021-2033
- 6.1. Market Analysis, Insights and Forecast - by Type
- 6.1.1. Batteries
- 6.1.2. Pumped-storage Hydroelectricity (PSH)
- 6.1.3. Thermal Energy Storage (TES)
- 6.1.4. Flywheel Energy Storage (FES)
- 6.1.5. Other Types
- 6.2. Market Analysis, Insights and Forecast - by Application
- 6.2.1. Residential
- 6.2.2. Commercial and Industrial
- 6.1. Market Analysis, Insights and Forecast - by Type
- 7. North America Energy Storage Market Analysis, Insights and Forecast, 2020-2032
- 7.1. Market Analysis, Insights and Forecast - by Type
- 7.1.1. Batteries
- 7.1.2. Pumped-storage Hydroelectricity (PSH)
- 7.1.3. Thermal Energy Storage (TES)
- 7.1.4. Flywheel Energy Storage (FES)
- 7.1.5. Other Types
- 7.2. Market Analysis, Insights and Forecast - by Application
- 7.2.1. Residential
- 7.2.2. Commercial and Industrial
- 7.1. Market Analysis, Insights and Forecast - by Type
- 8. Asia Pacific Energy Storage Market Analysis, Insights and Forecast, 2020-2032
- 8.1. Market Analysis, Insights and Forecast - by Type
- 8.1.1. Batteries
- 8.1.2. Pumped-storage Hydroelectricity (PSH)
- 8.1.3. Thermal Energy Storage (TES)
- 8.1.4. Flywheel Energy Storage (FES)
- 8.1.5. Other Types
- 8.2. Market Analysis, Insights and Forecast - by Application
- 8.2.1. Residential
- 8.2.2. Commercial and Industrial
- 8.1. Market Analysis, Insights and Forecast - by Type
- 9. Europe Energy Storage Market Analysis, Insights and Forecast, 2020-2032
- 9.1. Market Analysis, Insights and Forecast - by Type
- 9.1.1. Batteries
- 9.1.2. Pumped-storage Hydroelectricity (PSH)
- 9.1.3. Thermal Energy Storage (TES)
- 9.1.4. Flywheel Energy Storage (FES)
- 9.1.5. Other Types
- 9.2. Market Analysis, Insights and Forecast - by Application
- 9.2.1. Residential
- 9.2.2. Commercial and Industrial
- 9.1. Market Analysis, Insights and Forecast - by Type
- 10. South America Energy Storage Market Analysis, Insights and Forecast, 2020-2032
- 10.1. Market Analysis, Insights and Forecast - by Type
- 10.1.1. Batteries
- 10.1.2. Pumped-storage Hydroelectricity (PSH)
- 10.1.3. Thermal Energy Storage (TES)
- 10.1.4. Flywheel Energy Storage (FES)
- 10.1.5. Other Types
- 10.2. Market Analysis, Insights and Forecast - by Application
- 10.2.1. Residential
- 10.2.2. Commercial and Industrial
- 10.1. Market Analysis, Insights and Forecast - by Type
- 11. Middle East and Africa Energy Storage Market Analysis, Insights and Forecast, 2020-2032
- 11.1. Market Analysis, Insights and Forecast - by Type
- 11.1.1. Batteries
- 11.1.2. Pumped-storage Hydroelectricity (PSH)
- 11.1.3. Thermal Energy Storage (TES)
- 11.1.4. Flywheel Energy Storage (FES)
- 11.1.5. Other Types
- 11.2. Market Analysis, Insights and Forecast - by Application
- 11.2.1. Residential
- 11.2.2. Commercial and Industrial
- 11.1. Market Analysis, Insights and Forecast - by Type
- 12. Competitive Analysis
- 12.1. Company Profiles
- 12.1.1 BYD Co Ltd
- 12.1.1.1. Company Overview
- 12.1.1.2. Products
- 12.1.1.3. Company Financials
- 12.1.1.4. SWOT Analysis
- 12.1.2 Contemporary Amperex Technology Co Limited
- 12.1.2.1. Company Overview
- 12.1.2.2. Products
- 12.1.2.3. Company Financials
- 12.1.2.4. SWOT Analysis
- 12.1.3 UniEnergy Technologies LLC
- 12.1.3.1. Company Overview
- 12.1.3.2. Products
- 12.1.3.3. Company Financials
- 12.1.3.4. SWOT Analysis
- 12.1.4 Samsung SDI Co Ltd
- 12.1.4.1. Company Overview
- 12.1.4.2. Products
- 12.1.4.3. Company Financials
- 12.1.4.4. SWOT Analysis
- 12.1.5 LG Energy Solution Ltd
- 12.1.5.1. Company Overview
- 12.1.5.2. Products
- 12.1.5.3. Company Financials
- 12.1.5.4. SWOT Analysis
- 12.1.6 NGK Insulators Ltd
- 12.1.6.1. Company Overview
- 12.1.6.2. Products
- 12.1.6.3. Company Financials
- 12.1.6.4. SWOT Analysis
- 12.1.7 Tesla Inc *List Not Exhaustive
- 12.1.7.1. Company Overview
- 12.1.7.2. Products
- 12.1.7.3. Company Financials
- 12.1.7.4. SWOT Analysis
- 12.1.8 Clarios (Formerly Johnson Controls International PLC)
- 12.1.8.1. Company Overview
- 12.1.8.2. Products
- 12.1.8.3. Company Financials
- 12.1.8.4. SWOT Analysis
- 12.1.9 GS Yuasa Corporation
- 12.1.9.1. Company Overview
- 12.1.9.2. Products
- 12.1.9.3. Company Financials
- 12.1.9.4. SWOT Analysis
- 12.1.1 BYD Co Ltd
- 12.2. Market Entropy
- 12.2.1 Company's Key Areas Served
- 12.2.2 Recent Developments
- 12.3. Company Market Share Analysis 2025
- 12.3.1 Top 5 Companies Market Share Analysis
- 12.3.2 Top 3 Companies Market Share Analysis
- 12.4. List of Potential Customers
- 13. Research Methodology
List of Figures
- Figure 1: Global Energy Storage Market Revenue Breakdown (Million, %) by Region 2025 & 2033
- Figure 2: Global Energy Storage Market Volume Breakdown (K Unit, %) by Region 2025 & 2033
- Figure 3: North America Energy Storage Market Revenue (Million), by Type 2025 & 2033
- Figure 4: North America Energy Storage Market Volume (K Unit), by Type 2025 & 2033
- Figure 5: North America Energy Storage Market Revenue Share (%), by Type 2025 & 2033
- Figure 6: North America Energy Storage Market Volume Share (%), by Type 2025 & 2033
- Figure 7: North America Energy Storage Market Revenue (Million), by Application 2025 & 2033
- Figure 8: North America Energy Storage Market Volume (K Unit), by Application 2025 & 2033
- Figure 9: North America Energy Storage Market Revenue Share (%), by Application 2025 & 2033
- Figure 10: North America Energy Storage Market Volume Share (%), by Application 2025 & 2033
- Figure 11: North America Energy Storage Market Revenue (Million), by Country 2025 & 2033
- Figure 12: North America Energy Storage Market Volume (K Unit), by Country 2025 & 2033
- Figure 13: North America Energy Storage Market Revenue Share (%), by Country 2025 & 2033
- Figure 14: North America Energy Storage Market Volume Share (%), by Country 2025 & 2033
- Figure 15: Asia Pacific Energy Storage Market Revenue (Million), by Type 2025 & 2033
- Figure 16: Asia Pacific Energy Storage Market Volume (K Unit), by Type 2025 & 2033
- Figure 17: Asia Pacific Energy Storage Market Revenue Share (%), by Type 2025 & 2033
- Figure 18: Asia Pacific Energy Storage Market Volume Share (%), by Type 2025 & 2033
- Figure 19: Asia Pacific Energy Storage Market Revenue (Million), by Application 2025 & 2033
- Figure 20: Asia Pacific Energy Storage Market Volume (K Unit), by Application 2025 & 2033
- Figure 21: Asia Pacific Energy Storage Market Revenue Share (%), by Application 2025 & 2033
- Figure 22: Asia Pacific Energy Storage Market Volume Share (%), by Application 2025 & 2033
- Figure 23: Asia Pacific Energy Storage Market Revenue (Million), by Country 2025 & 2033
- Figure 24: Asia Pacific Energy Storage Market Volume (K Unit), by Country 2025 & 2033
- Figure 25: Asia Pacific Energy Storage Market Revenue Share (%), by Country 2025 & 2033
- Figure 26: Asia Pacific Energy Storage Market Volume Share (%), by Country 2025 & 2033
- Figure 27: Europe Energy Storage Market Revenue (Million), by Type 2025 & 2033
- Figure 28: Europe Energy Storage Market Volume (K Unit), by Type 2025 & 2033
- Figure 29: Europe Energy Storage Market Revenue Share (%), by Type 2025 & 2033
- Figure 30: Europe Energy Storage Market Volume Share (%), by Type 2025 & 2033
- Figure 31: Europe Energy Storage Market Revenue (Million), by Application 2025 & 2033
- Figure 32: Europe Energy Storage Market Volume (K Unit), by Application 2025 & 2033
- Figure 33: Europe Energy Storage Market Revenue Share (%), by Application 2025 & 2033
- Figure 34: Europe Energy Storage Market Volume Share (%), by Application 2025 & 2033
- Figure 35: Europe Energy Storage Market Revenue (Million), by Country 2025 & 2033
- Figure 36: Europe Energy Storage Market Volume (K Unit), by Country 2025 & 2033
- Figure 37: Europe Energy Storage Market Revenue Share (%), by Country 2025 & 2033
- Figure 38: Europe Energy Storage Market Volume Share (%), by Country 2025 & 2033
- Figure 39: South America Energy Storage Market Revenue (Million), by Type 2025 & 2033
- Figure 40: South America Energy Storage Market Volume (K Unit), by Type 2025 & 2033
- Figure 41: South America Energy Storage Market Revenue Share (%), by Type 2025 & 2033
- Figure 42: South America Energy Storage Market Volume Share (%), by Type 2025 & 2033
- Figure 43: South America Energy Storage Market Revenue (Million), by Application 2025 & 2033
- Figure 44: South America Energy Storage Market Volume (K Unit), by Application 2025 & 2033
- Figure 45: South America Energy Storage Market Revenue Share (%), by Application 2025 & 2033
- Figure 46: South America Energy Storage Market Volume Share (%), by Application 2025 & 2033
- Figure 47: South America Energy Storage Market Revenue (Million), by Country 2025 & 2033
- Figure 48: South America Energy Storage Market Volume (K Unit), by Country 2025 & 2033
- Figure 49: South America Energy Storage Market Revenue Share (%), by Country 2025 & 2033
- Figure 50: South America Energy Storage Market Volume Share (%), by Country 2025 & 2033
- Figure 51: Middle East and Africa Energy Storage Market Revenue (Million), by Type 2025 & 2033
- Figure 52: Middle East and Africa Energy Storage Market Volume (K Unit), by Type 2025 & 2033
- Figure 53: Middle East and Africa Energy Storage Market Revenue Share (%), by Type 2025 & 2033
- Figure 54: Middle East and Africa Energy Storage Market Volume Share (%), by Type 2025 & 2033
- Figure 55: Middle East and Africa Energy Storage Market Revenue (Million), by Application 2025 & 2033
- Figure 56: Middle East and Africa Energy Storage Market Volume (K Unit), by Application 2025 & 2033
- Figure 57: Middle East and Africa Energy Storage Market Revenue Share (%), by Application 2025 & 2033
- Figure 58: Middle East and Africa Energy Storage Market Volume Share (%), by Application 2025 & 2033
- Figure 59: Middle East and Africa Energy Storage Market Revenue (Million), by Country 2025 & 2033
- Figure 60: Middle East and Africa Energy Storage Market Volume (K Unit), by Country 2025 & 2033
- Figure 61: Middle East and Africa Energy Storage Market Revenue Share (%), by Country 2025 & 2033
- Figure 62: Middle East and Africa Energy Storage Market Volume Share (%), by Country 2025 & 2033
List of Tables
- Table 1: Global Energy Storage Market Revenue Million Forecast, by Type 2020 & 2033
- Table 2: Global Energy Storage Market Volume K Unit Forecast, by Type 2020 & 2033
- Table 3: Global Energy Storage Market Revenue Million Forecast, by Application 2020 & 2033
- Table 4: Global Energy Storage Market Volume K Unit Forecast, by Application 2020 & 2033
- Table 5: Global Energy Storage Market Revenue Million Forecast, by Region 2020 & 2033
- Table 6: Global Energy Storage Market Volume K Unit Forecast, by Region 2020 & 2033
- Table 7: Global Energy Storage Market Revenue Million Forecast, by Type 2020 & 2033
- Table 8: Global Energy Storage Market Volume K Unit Forecast, by Type 2020 & 2033
- Table 9: Global Energy Storage Market Revenue Million Forecast, by Application 2020 & 2033
- Table 10: Global Energy Storage Market Volume K Unit Forecast, by Application 2020 & 2033
- Table 11: Global Energy Storage Market Revenue Million Forecast, by Country 2020 & 2033
- Table 12: Global Energy Storage Market Volume K Unit Forecast, by Country 2020 & 2033
- Table 13: United States Energy Storage Market Revenue (Million) Forecast, by Application 2020 & 2033
- Table 14: United States Energy Storage Market Volume (K Unit) Forecast, by Application 2020 & 2033
- Table 15: Canada Energy Storage Market Revenue (Million) Forecast, by Application 2020 & 2033
- Table 16: Canada Energy Storage Market Volume (K Unit) Forecast, by Application 2020 & 2033
- Table 17: Rest of North America Energy Storage Market Revenue (Million) Forecast, by Application 2020 & 2033
- Table 18: Rest of North America Energy Storage Market Volume (K Unit) Forecast, by Application 2020 & 2033
- Table 19: Global Energy Storage Market Revenue Million Forecast, by Type 2020 & 2033
- Table 20: Global Energy Storage Market Volume K Unit Forecast, by Type 2020 & 2033
- Table 21: Global Energy Storage Market Revenue Million Forecast, by Application 2020 & 2033
- Table 22: Global Energy Storage Market Volume K Unit Forecast, by Application 2020 & 2033
- Table 23: Global Energy Storage Market Revenue Million Forecast, by Country 2020 & 2033
- Table 24: Global Energy Storage Market Volume K Unit Forecast, by Country 2020 & 2033
- Table 25: India Energy Storage Market Revenue (Million) Forecast, by Application 2020 & 2033
- Table 26: India Energy Storage Market Volume (K Unit) Forecast, by Application 2020 & 2033
- Table 27: China Energy Storage Market Revenue (Million) Forecast, by Application 2020 & 2033
- Table 28: China Energy Storage Market Volume (K Unit) Forecast, by Application 2020 & 2033
- Table 29: Australia Energy Storage Market Revenue (Million) Forecast, by Application 2020 & 2033
- Table 30: Australia Energy Storage Market Volume (K Unit) Forecast, by Application 2020 & 2033
- Table 31: Rest of Asia Pacific Energy Storage Market Revenue (Million) Forecast, by Application 2020 & 2033
- Table 32: Rest of Asia Pacific Energy Storage Market Volume (K Unit) Forecast, by Application 2020 & 2033
- Table 33: Global Energy Storage Market Revenue Million Forecast, by Type 2020 & 2033
- Table 34: Global Energy Storage Market Volume K Unit Forecast, by Type 2020 & 2033
- Table 35: Global Energy Storage Market Revenue Million Forecast, by Application 2020 & 2033
- Table 36: Global Energy Storage Market Volume K Unit Forecast, by Application 2020 & 2033
- Table 37: Global Energy Storage Market Revenue Million Forecast, by Country 2020 & 2033
- Table 38: Global Energy Storage Market Volume K Unit Forecast, by Country 2020 & 2033
- Table 39: Germany Energy Storage Market Revenue (Million) Forecast, by Application 2020 & 2033
- Table 40: Germany Energy Storage Market Volume (K Unit) Forecast, by Application 2020 & 2033
- Table 41: United Kingdom Energy Storage Market Revenue (Million) Forecast, by Application 2020 & 2033
- Table 42: United Kingdom Energy Storage Market Volume (K Unit) Forecast, by Application 2020 & 2033
- Table 43: Rest of Europe Energy Storage Market Revenue (Million) Forecast, by Application 2020 & 2033
- Table 44: Rest of Europe Energy Storage Market Volume (K Unit) Forecast, by Application 2020 & 2033
- Table 45: Global Energy Storage Market Revenue Million Forecast, by Type 2020 & 2033
- Table 46: Global Energy Storage Market Volume K Unit Forecast, by Type 2020 & 2033
- Table 47: Global Energy Storage Market Revenue Million Forecast, by Application 2020 & 2033
- Table 48: Global Energy Storage Market Volume K Unit Forecast, by Application 2020 & 2033
- Table 49: Global Energy Storage Market Revenue Million Forecast, by Country 2020 & 2033
- Table 50: Global Energy Storage Market Volume K Unit Forecast, by Country 2020 & 2033
- Table 51: Brazil Energy Storage Market Revenue (Million) Forecast, by Application 2020 & 2033
- Table 52: Brazil Energy Storage Market Volume (K Unit) Forecast, by Application 2020 & 2033
- Table 53: Argentina Energy Storage Market Revenue (Million) Forecast, by Application 2020 & 2033
- Table 54: Argentina Energy Storage Market Volume (K Unit) Forecast, by Application 2020 & 2033
- Table 55: Rest of South America Energy Storage Market Revenue (Million) Forecast, by Application 2020 & 2033
- Table 56: Rest of South America Energy Storage Market Volume (K Unit) Forecast, by Application 2020 & 2033
- Table 57: Global Energy Storage Market Revenue Million Forecast, by Type 2020 & 2033
- Table 58: Global Energy Storage Market Volume K Unit Forecast, by Type 2020 & 2033
- Table 59: Global Energy Storage Market Revenue Million Forecast, by Application 2020 & 2033
- Table 60: Global Energy Storage Market Volume K Unit Forecast, by Application 2020 & 2033
- Table 61: Global Energy Storage Market Revenue Million Forecast, by Country 2020 & 2033
- Table 62: Global Energy Storage Market Volume K Unit Forecast, by Country 2020 & 2033
- Table 63: Saudi Arabia Energy Storage Market Revenue (Million) Forecast, by Application 2020 & 2033
- Table 64: Saudi Arabia Energy Storage Market Volume (K Unit) Forecast, by Application 2020 & 2033
- Table 65: Iraq Energy Storage Market Revenue (Million) Forecast, by Application 2020 & 2033
- Table 66: Iraq Energy Storage Market Volume (K Unit) Forecast, by Application 2020 & 2033
- Table 67: Jordan Energy Storage Market Revenue (Million) Forecast, by Application 2020 & 2033
- Table 68: Jordan Energy Storage Market Volume (K Unit) Forecast, by Application 2020 & 2033
- Table 69: Rest of Middle East and Africa Energy Storage Market Revenue (Million) Forecast, by Application 2020 & 2033
- Table 70: Rest of Middle East and Africa Energy Storage Market Volume (K Unit) Forecast, by Application 2020 & 2033
Frequently Asked Questions
1. What is the projected Compound Annual Growth Rate (CAGR) of the Energy Storage Market?
The projected CAGR is approximately 14.31%.
2. Which companies are prominent players in the Energy Storage Market?
Key companies in the market include BYD Co Ltd, Contemporary Amperex Technology Co Limited, UniEnergy Technologies LLC, Samsung SDI Co Ltd, LG Energy Solution Ltd, NGK Insulators Ltd, Tesla Inc *List Not Exhaustive, Clarios (Formerly Johnson Controls International PLC), GS Yuasa Corporation.
3. What are the main segments of the Energy Storage Market?
The market segments include Type, Application.
4. Can you provide details about the market size?
The market size is estimated to be USD 51.10 Million as of 2022.
5. What are some drivers contributing to market growth?
Rising Supporting Government Policies for Solar Energy in South Africa4.; Increasing Investment in Renewable Energy Such as Solar. Wind. and Others.
6. What are the notable trends driving market growth?
Batteries Segment to Dominate the Market.
7. Are there any restraints impacting market growth?
Increasing Adoption of Alternate Renewable Technologies Such as Wind.
8. Can you provide examples of recent developments in the market?
February 2022: The partnership between FIMER and Vega Solar supplied 14 PVS-100 inverters, a three-phase string solution, to Albania. The PVS-100/120-TL is a cloud-connected three-phase string inverter by FIMER designed for cost-effective decentralized solar systems on both ground and rooftops.
9. What pricing options are available for accessing the report?
Pricing options include single-user, multi-user, and enterprise licenses priced at USD 4750, USD 5250, and USD 8750 respectively.
10. Is the market size provided in terms of value or volume?
The market size is provided in terms of value, measured in Million and volume, measured in K Unit.
11. Are there any specific market keywords associated with the report?
Yes, the market keyword associated with the report is "Energy Storage Market," which aids in identifying and referencing the specific market segment covered.
12. How do I determine which pricing option suits my needs best?
The pricing options vary based on user requirements and access needs. Individual users may opt for single-user licenses, while businesses requiring broader access may choose multi-user or enterprise licenses for cost-effective access to the report.
13. Are there any additional resources or data provided in the Energy Storage Market report?
While the report offers comprehensive insights, it's advisable to review the specific contents or supplementary materials provided to ascertain if additional resources or data are available.
14. How can I stay updated on further developments or reports in the Energy Storage Market?
To stay informed about further developments, trends, and reports in the Energy Storage Market, consider subscribing to industry newsletters, following relevant companies and organizations, or regularly checking reputable industry news sources and publications.
Methodology
Step 1 - Identification of Relevant Samples Size from Population Database


Step 2 - Approaches for Defining Global Market Size (Value, Volume* & Price*)

Note*: In applicable scenarios
Step 3 - Data Sources
Primary Research
- Web Analytics
- Survey Reports
- Research Institute
- Latest Research Reports
- Opinion Leaders
Secondary Research
- Annual Reports
- White Paper
- Latest Press Release
- Industry Association
- Paid Database
- Investor Presentations

Step 4 - Data Triangulation
Involves using different sources of information in order to increase the validity of a study
These sources are likely to be stakeholders in a program - participants, other researchers, program staff, other community members, and so on.
Then we put all data in single framework & apply various statistical tools to find out the dynamic on the market.
During the analysis stage, feedback from the stakeholder groups would be compared to determine areas of agreement as well as areas of divergence