

Key Insights
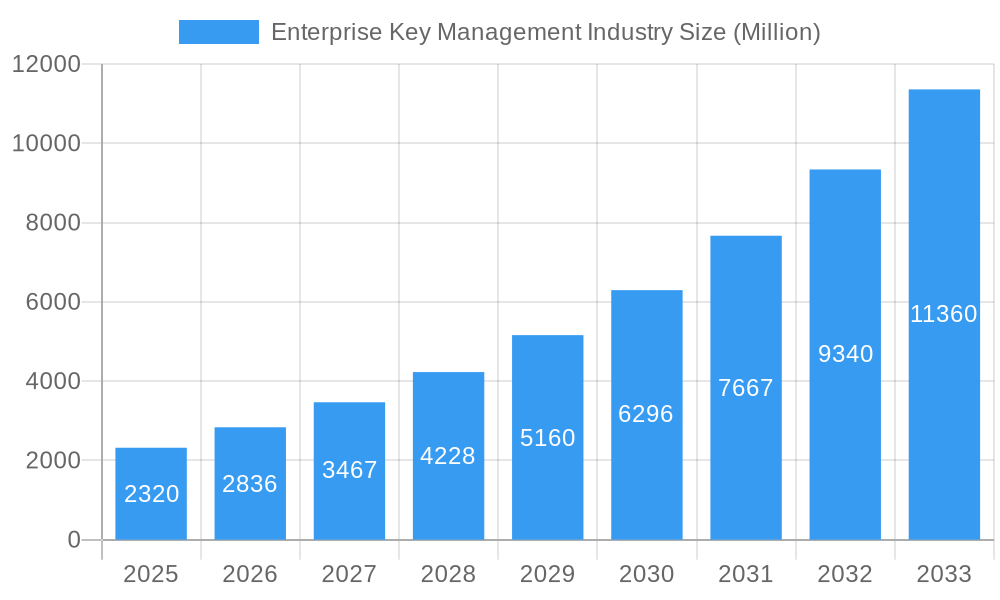
The Enterprise Key Management (EKM) market is experiencing robust growth, projected to reach $2.32 billion in 2025 and exhibiting a Compound Annual Growth Rate (CAGR) of 22.32% from 2025 to 2033. This expansion is driven by several key factors. The increasing adoption of cloud computing and the proliferation of data necessitate robust security measures, fueling demand for EKM solutions to protect sensitive information. Furthermore, stringent government regulations and industry compliance standards, like GDPR and CCPA, mandate strong encryption and key management practices, thereby boosting market growth. The rise of sophisticated cyber threats and data breaches further underscores the critical need for effective EKM strategies across various sectors. Growth is particularly strong in sectors like BFSI (Banking, Financial Services, and Insurance), Healthcare, and Government, driven by their sensitive data and stringent regulatory requirements. The market is segmented by deployment type (cloud and on-premises), enterprise size (SMEs and large enterprises), application (disk, file/folder, database, communication, and cloud encryption), and end-user verticals. Cloud-based EKM solutions are expected to dominate due to their scalability, cost-effectiveness, and accessibility. The competitive landscape features a mix of established players like IBM, Microsoft, and Thales, alongside emerging technology providers, leading to innovation and competition in the market.
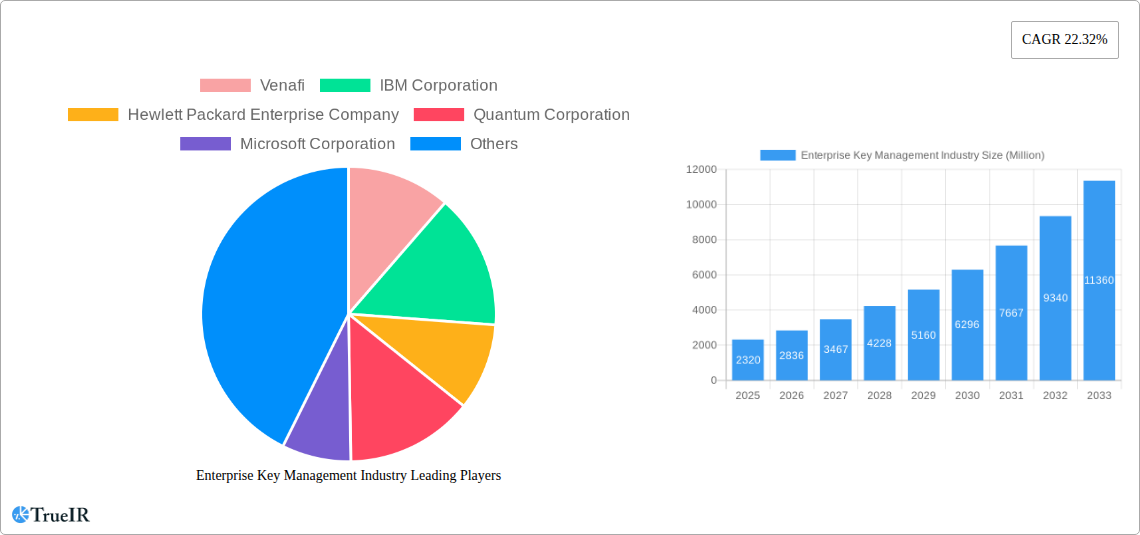
Enterprise Key Management Industry Market Size (In Billion)
Continued growth through 2033 is anticipated, driven by ongoing digital transformation initiatives, the expanding Internet of Things (IoT) ecosystem, and the increasing adoption of advanced encryption techniques. However, the market faces certain restraints, including the complexity of implementing EKM solutions, the associated costs, and the shortage of skilled cybersecurity professionals. Despite these challenges, the overall market outlook remains positive, with a projected significant increase in market value over the forecast period. The market will see continued innovation in areas like automated key management, integration with cloud security platforms, and advanced threat detection capabilities. Strategic partnerships and acquisitions are also expected to shape the competitive landscape further.
Enterprise Key Management Industry Company Market Share
Enterprise Key Management Market Report: 2019-2033
This comprehensive report provides a detailed analysis of the Enterprise Key Management (EKM) industry, offering invaluable insights for businesses, investors, and stakeholders seeking to navigate this rapidly evolving market. The study period covers 2019-2033, with 2025 serving as the base and estimated year. The forecast period spans 2025-2033, while the historical period encompasses 2019-2024. The global EKM market is projected to reach xx Million by 2033, exhibiting a robust Compound Annual Growth Rate (CAGR) of xx%.
Enterprise Key Management Industry Market Structure & Competitive Landscape
The Enterprise Key Management market is characterized by a moderately concentrated landscape, with key players like Venafi, IBM, and Microsoft holding significant market share. However, the market is also witnessing increased competition from smaller, specialized vendors and cloud providers. Innovation is driven by the need for robust security solutions in the face of rising cyber threats and stringent data privacy regulations. The regulatory environment plays a crucial role, with compliance mandates like GDPR and CCPA significantly impacting market growth and vendor strategies. Product substitutes are limited, with traditional methods lacking the scalability and centralized management offered by EKM solutions. The market is segmented by deployment type (cloud, on-premises), enterprise size (SMEs, large enterprises), application (disk, file, database, communication, cloud encryption), and end-user vertical (BFSI, healthcare, government, IT/telecom, retail). M&A activity in the sector has been relatively moderate in recent years, with an estimated xx Million in deal value over the past five years. This reflects strategic acquisitions aimed at expanding product portfolios and enhancing technological capabilities. The concentration ratio (CR4) for the top four players is estimated at xx%, indicating a moderately competitive market.
Enterprise Key Management Industry Market Trends & Opportunities
The EKM market is experiencing significant growth, driven by the increasing adoption of cloud computing, the expanding attack surface from IoT devices, and the rising awareness of data breaches. The market is shifting towards cloud-based deployments, offering scalability, cost efficiency, and ease of management. Consumer preferences favor solutions with robust encryption capabilities, centralized key management, and seamless integration with existing IT infrastructure. The competitive landscape is dynamic, with established players facing challenges from agile startups and cloud giants offering integrated security solutions. The global market size is projected to reach xx Million in 2025, with a CAGR of xx% during the forecast period. This growth reflects the rising adoption of EKM solutions across various industries and enterprise sizes. Market penetration rates vary across different segments; the cloud segment exhibits the fastest growth, while large enterprises are leading in adoption due to their high data security needs.
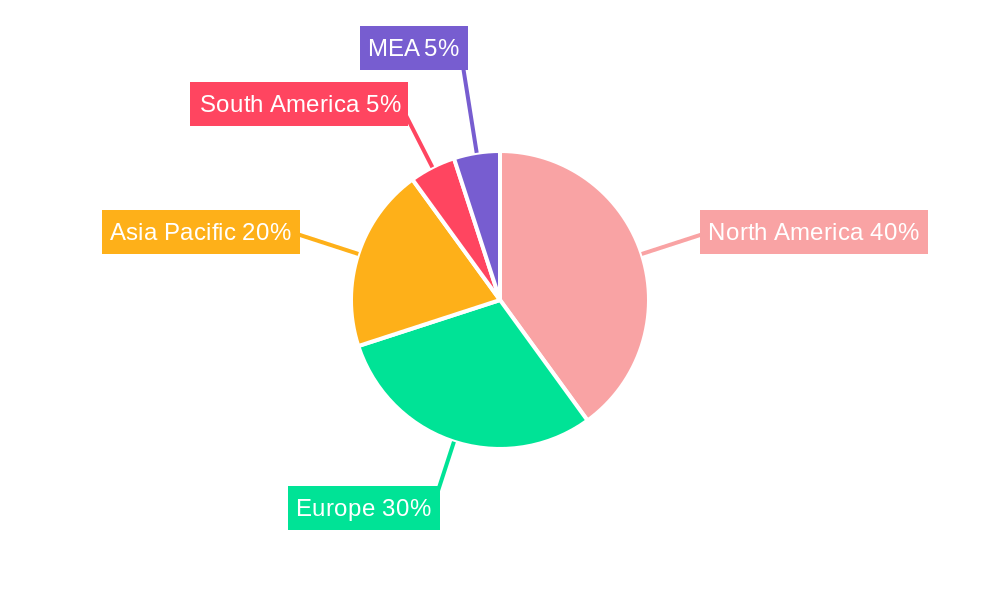
Dominant Markets & Segments in Enterprise Key Management Industry
The North American region currently dominates the EKM market, driven by high levels of technological adoption, strong regulatory compliance pressures, and a large concentration of enterprises with significant data security concerns. However, Asia-Pacific is expected to experience significant growth, driven by increasing digitalization and government initiatives.
- By Deployment Type: The cloud segment dominates, fueled by its scalability and cost-effectiveness.
- By Enterprise Size: Large Enterprises represent the largest market segment due to higher security budgets and sophisticated IT infrastructure.
- By Application: Database encryption and cloud encryption show strong growth due to the high value and sensitivity of the protected data.
- By End-user Verticals: BFSI and Government & Defense sectors are key adopters, due to the stringent regulatory compliance requirements and sensitive data handling.
Key growth drivers for specific segments include robust infrastructure investments in the cloud segment, stringent data protection regulations in the BFSI sector, and increasing cybersecurity threats across all verticals.
Enterprise Key Management Industry Product Analysis
EKM solutions are increasingly incorporating advanced encryption algorithms, automated key management features, and integrated security monitoring capabilities. Products emphasize ease of use, scalability, and compliance with industry standards. The competitive advantage lies in superior key management efficiency, advanced threat detection, and seamless integration with various IT environments. Technological advancements such as hardware security modules (HSMs) and blockchain technologies are enhancing the security and trustworthiness of EKM systems.
Key Drivers, Barriers & Challenges in Enterprise Key Management Industry
Key Drivers: The rising incidence of data breaches, increasing regulatory compliance mandates (GDPR, CCPA), and the growing adoption of cloud computing are major drivers. The shift towards digital transformation and the expanding attack surface of interconnected devices further fuel market growth.
Challenges: Integration complexities with existing IT infrastructure, high upfront investment costs, and the need for specialized expertise pose significant challenges. Supply chain disruptions can impact the availability of specialized hardware components, while stringent regulatory compliance requirements add to operational costs. The intense competition among existing players and the emergence of new entrants further intensify the challenges. The competitive pressure could result in price wars and reduced profit margins. xx% of organizations reported challenges with integration in a recent survey.
Growth Drivers in the Enterprise Key Management Industry Market
Technological advancements, increasing regulatory scrutiny, and the growing adoption of cloud computing are key drivers. The rise of IoT and edge computing further contributes to market expansion, while economic factors such as increasing IT budgets and growing awareness of data security risks also play a crucial role.
Challenges Impacting Enterprise Key Management Industry Growth
Regulatory complexity, particularly concerning international data transfer regulations, poses a significant barrier. Supply chain vulnerabilities and potential disruptions can affect hardware availability. Finally, intense competition, particularly from large cloud providers offering integrated security solutions, can impact pricing and profitability.
Key Players Shaping the Enterprise Key Management Industry Market
Significant Enterprise Key Management Industry Industry Milestones
- September 2023: Thales launched Hold Your Own Key (HYOK) by CipherTrust Cloud Key Management in Oracle Cloud Infrastructure (OCI) across 45 Oracle Cloud Regions. This significantly enhances customer control over their encryption keys in the cloud environment.
- May 2023: Cubist launched a service targeting institutional blockchain staking providers, highlighting the expanding application of EKM solutions in the blockchain and cryptocurrency space.
Future Outlook for Enterprise Key Management Industry Market
The EKM market is poised for continued growth, driven by ongoing digital transformation, increasing cyber threats, and the expanding regulatory landscape. Strategic opportunities lie in developing innovative solutions that address emerging challenges such as quantum computing threats and the security needs of edge computing environments. The market potential is significant, with substantial growth expected across various segments and geographical regions.
Enterprise Key Management Industry Segmentation
-
1. Deployment Type
- 1.1. Cloud
- 1.2. On-Premises
-
2. Application
- 2.1. Disk Encryption
- 2.2. File and Folder Encryption
- 2.3. Database Encryption
- 2.4. Communication Encryption
- 2.5. Cloud Encryption
-
3. End-user Verticals
- 3.1. BFSI
- 3.2. Healthcare
- 3.3. Government and Defense
- 3.4. IT and Telecom
- 3.5. Retail
- 3.6. Other End-user Verticals
Enterprise Key Management Industry Segmentation By Geography
- 1. North America
- 2. Europe
- 3. Asia
- 4. Australia and New Zealand
- 5. Latin America
- 6. Middle East and Africa
Enterprise Key Management Industry Regional Market Share
Geographic Coverage of Enterprise Key Management Industry
Enterprise Key Management Industry REPORT HIGHLIGHTS
| Aspects | Details |
|---|---|
| Study Period | 2020-2034 |
| Base Year | 2025 |
| Estimated Year | 2026 |
| Forecast Period | 2026-2034 |
| Historical Period | 2020-2025 |
| Growth Rate | CAGR of 22.32% from 2020-2034 |
| Segmentation |
|
Table of Contents
- 1. Introduction
- 1.1. Research Scope
- 1.2. Market Segmentation
- 1.3. Research Objective
- 1.4. Definitions and Assumptions
- 2. Executive Summary
- 2.1. Market Snapshot
- 3. Market Dynamics
- 3.1. Market Drivers
- 3.2. Market Restrains
- 3.3. Market Trends
- 3.4. Market Opportunities
- 4. Market Factor Analysis
- 4.1. Porters Five Forces
- 4.1.1. Bargaining Power of Suppliers
- 4.1.2. Bargaining Power of Buyers
- 4.1.3. Threat of New Entrants
- 4.1.4. Threat of Substitutes
- 4.1.5. Competitive Rivalry
- 4.2. PESTEL analysis
- 4.3. BCG Analysis
- 4.3.1. Stars (High Growth, High Market Share)
- 4.3.2. Cash Cows (Low Growth, High Market Share)
- 4.3.3. Question Mark (High Growth, Low Market Share)
- 4.3.4. Dogs (Low Growth, Low Market Share)
- 4.4. Ansoff Matrix Analysis
- 4.5. Supply Chain Analysis
- 4.6. Regulatory Landscape
- 4.7. Current Market Potential and Opportunity Assessment (TAM–SAM–SOM Framework)
- 4.8. TIR Analyst Note
- 4.1. Porters Five Forces
- 5. Market Analysis, Insights and Forecast 2021-2033
- 5.1. Market Analysis, Insights and Forecast - by Deployment Type
- 5.1.1. Cloud
- 5.1.2. On-Premises
- 5.2. Market Analysis, Insights and Forecast - by Application
- 5.2.1. Disk Encryption
- 5.2.2. File and Folder Encryption
- 5.2.3. Database Encryption
- 5.2.4. Communication Encryption
- 5.2.5. Cloud Encryption
- 5.3. Market Analysis, Insights and Forecast - by End-user Verticals
- 5.3.1. BFSI
- 5.3.2. Healthcare
- 5.3.3. Government and Defense
- 5.3.4. IT and Telecom
- 5.3.5. Retail
- 5.3.6. Other End-user Verticals
- 5.4. Market Analysis, Insights and Forecast - by Region
- 5.4.1. North America
- 5.4.2. Europe
- 5.4.3. Asia
- 5.4.4. Australia and New Zealand
- 5.4.5. Latin America
- 5.4.6. Middle East and Africa
- 5.1. Market Analysis, Insights and Forecast - by Deployment Type
- 6. Global Enterprise Key Management Industry Analysis, Insights and Forecast, 2021-2033
- 6.1. Market Analysis, Insights and Forecast - by Deployment Type
- 6.1.1. Cloud
- 6.1.2. On-Premises
- 6.2. Market Analysis, Insights and Forecast - by Application
- 6.2.1. Disk Encryption
- 6.2.2. File and Folder Encryption
- 6.2.3. Database Encryption
- 6.2.4. Communication Encryption
- 6.2.5. Cloud Encryption
- 6.3. Market Analysis, Insights and Forecast - by End-user Verticals
- 6.3.1. BFSI
- 6.3.2. Healthcare
- 6.3.3. Government and Defense
- 6.3.4. IT and Telecom
- 6.3.5. Retail
- 6.3.6. Other End-user Verticals
- 6.1. Market Analysis, Insights and Forecast - by Deployment Type
- 7. North America Enterprise Key Management Industry Analysis, Insights and Forecast, 2020-2032
- 7.1. Market Analysis, Insights and Forecast - by Deployment Type
- 7.1.1. Cloud
- 7.1.2. On-Premises
- 7.2. Market Analysis, Insights and Forecast - by Application
- 7.2.1. Disk Encryption
- 7.2.2. File and Folder Encryption
- 7.2.3. Database Encryption
- 7.2.4. Communication Encryption
- 7.2.5. Cloud Encryption
- 7.3. Market Analysis, Insights and Forecast - by End-user Verticals
- 7.3.1. BFSI
- 7.3.2. Healthcare
- 7.3.3. Government and Defense
- 7.3.4. IT and Telecom
- 7.3.5. Retail
- 7.3.6. Other End-user Verticals
- 7.1. Market Analysis, Insights and Forecast - by Deployment Type
- 8. Europe Enterprise Key Management Industry Analysis, Insights and Forecast, 2020-2032
- 8.1. Market Analysis, Insights and Forecast - by Deployment Type
- 8.1.1. Cloud
- 8.1.2. On-Premises
- 8.2. Market Analysis, Insights and Forecast - by Application
- 8.2.1. Disk Encryption
- 8.2.2. File and Folder Encryption
- 8.2.3. Database Encryption
- 8.2.4. Communication Encryption
- 8.2.5. Cloud Encryption
- 8.3. Market Analysis, Insights and Forecast - by End-user Verticals
- 8.3.1. BFSI
- 8.3.2. Healthcare
- 8.3.3. Government and Defense
- 8.3.4. IT and Telecom
- 8.3.5. Retail
- 8.3.6. Other End-user Verticals
- 8.1. Market Analysis, Insights and Forecast - by Deployment Type
- 9. Asia Enterprise Key Management Industry Analysis, Insights and Forecast, 2020-2032
- 9.1. Market Analysis, Insights and Forecast - by Deployment Type
- 9.1.1. Cloud
- 9.1.2. On-Premises
- 9.2. Market Analysis, Insights and Forecast - by Application
- 9.2.1. Disk Encryption
- 9.2.2. File and Folder Encryption
- 9.2.3. Database Encryption
- 9.2.4. Communication Encryption
- 9.2.5. Cloud Encryption
- 9.3. Market Analysis, Insights and Forecast - by End-user Verticals
- 9.3.1. BFSI
- 9.3.2. Healthcare
- 9.3.3. Government and Defense
- 9.3.4. IT and Telecom
- 9.3.5. Retail
- 9.3.6. Other End-user Verticals
- 9.1. Market Analysis, Insights and Forecast - by Deployment Type
- 10. Australia and New Zealand Enterprise Key Management Industry Analysis, Insights and Forecast, 2020-2032
- 10.1. Market Analysis, Insights and Forecast - by Deployment Type
- 10.1.1. Cloud
- 10.1.2. On-Premises
- 10.2. Market Analysis, Insights and Forecast - by Application
- 10.2.1. Disk Encryption
- 10.2.2. File and Folder Encryption
- 10.2.3. Database Encryption
- 10.2.4. Communication Encryption
- 10.2.5. Cloud Encryption
- 10.3. Market Analysis, Insights and Forecast - by End-user Verticals
- 10.3.1. BFSI
- 10.3.2. Healthcare
- 10.3.3. Government and Defense
- 10.3.4. IT and Telecom
- 10.3.5. Retail
- 10.3.6. Other End-user Verticals
- 10.1. Market Analysis, Insights and Forecast - by Deployment Type
- 11. Latin America Enterprise Key Management Industry Analysis, Insights and Forecast, 2020-2032
- 11.1. Market Analysis, Insights and Forecast - by Deployment Type
- 11.1.1. Cloud
- 11.1.2. On-Premises
- 11.2. Market Analysis, Insights and Forecast - by Application
- 11.2.1. Disk Encryption
- 11.2.2. File and Folder Encryption
- 11.2.3. Database Encryption
- 11.2.4. Communication Encryption
- 11.2.5. Cloud Encryption
- 11.3. Market Analysis, Insights and Forecast - by End-user Verticals
- 11.3.1. BFSI
- 11.3.2. Healthcare
- 11.3.3. Government and Defense
- 11.3.4. IT and Telecom
- 11.3.5. Retail
- 11.3.6. Other End-user Verticals
- 11.1. Market Analysis, Insights and Forecast - by Deployment Type
- 12. Middle East and Africa Enterprise Key Management Industry Analysis, Insights and Forecast, 2020-2032
- 12.1. Market Analysis, Insights and Forecast - by Deployment Type
- 12.1.1. Cloud
- 12.1.2. On-Premises
- 12.2. Market Analysis, Insights and Forecast - by Application
- 12.2.1. Disk Encryption
- 12.2.2. File and Folder Encryption
- 12.2.3. Database Encryption
- 12.2.4. Communication Encryption
- 12.2.5. Cloud Encryption
- 12.3. Market Analysis, Insights and Forecast - by End-user Verticals
- 12.3.1. BFSI
- 12.3.2. Healthcare
- 12.3.3. Government and Defense
- 12.3.4. IT and Telecom
- 12.3.5. Retail
- 12.3.6. Other End-user Verticals
- 12.1. Market Analysis, Insights and Forecast - by Deployment Type
- 13. Competitive Analysis
- 13.1. Company Profiles
- 13.1.1 Venafi
- 13.1.1.1. Company Overview
- 13.1.1.2. Products
- 13.1.1.3. Company Financials
- 13.1.1.4. SWOT Analysis
- 13.1.2 IBM Corporation
- 13.1.2.1. Company Overview
- 13.1.2.2. Products
- 13.1.2.3. Company Financials
- 13.1.2.4. SWOT Analysis
- 13.1.3 Hewlett Packard Enterprise Company
- 13.1.3.1. Company Overview
- 13.1.3.2. Products
- 13.1.3.3. Company Financials
- 13.1.3.4. SWOT Analysis
- 13.1.4 Quantum Corporation
- 13.1.4.1. Company Overview
- 13.1.4.2. Products
- 13.1.4.3. Company Financials
- 13.1.4.4. SWOT Analysis
- 13.1.5 Microsoft Corporation
- 13.1.5.1. Company Overview
- 13.1.5.2. Products
- 13.1.5.3. Company Financials
- 13.1.5.4. SWOT Analysis
- 13.1.6 Amazon Web Services Inc
- 13.1.6.1. Company Overview
- 13.1.6.2. Products
- 13.1.6.3. Company Financials
- 13.1.6.4. SWOT Analysis
- 13.1.7 Winmagic Inc
- 13.1.7.1. Company Overview
- 13.1.7.2. Products
- 13.1.7.3. Company Financials
- 13.1.7.4. SWOT Analysis
- 13.1.8 Google Inc (Alphabet)
- 13.1.8.1. Company Overview
- 13.1.8.2. Products
- 13.1.8.3. Company Financials
- 13.1.8.4. SWOT Analysis
- 13.1.9 Thales Group (Gemalto NV)
- 13.1.9.1. Company Overview
- 13.1.9.2. Products
- 13.1.9.3. Company Financials
- 13.1.9.4. SWOT Analysis
- 13.1.10 Oracle Corporation
- 13.1.10.1. Company Overview
- 13.1.10.2. Products
- 13.1.10.3. Company Financials
- 13.1.10.4. SWOT Analysis
- 13.1.11 Dell Technologies Inc
- 13.1.11.1. Company Overview
- 13.1.11.2. Products
- 13.1.11.3. Company Financials
- 13.1.11.4. SWOT Analysis
- 13.1.1 Venafi
- 13.2. Market Entropy
- 13.2.1 Company's Key Areas Served
- 13.2.2 Recent Developments
- 13.3. Company Market Share Analysis 2025
- 13.3.1 Top 5 Companies Market Share Analysis
- 13.3.2 Top 3 Companies Market Share Analysis
- 13.4. List of Potential Customers
- 14. Research Methodology
List of Figures
- Figure 1: Global Enterprise Key Management Industry Revenue Breakdown (Million, %) by Region 2025 & 2033
- Figure 2: Global Enterprise Key Management Industry Volume Breakdown (K Unit, %) by Region 2025 & 2033
- Figure 3: North America Enterprise Key Management Industry Revenue (Million), by Deployment Type 2025 & 2033
- Figure 4: North America Enterprise Key Management Industry Volume (K Unit), by Deployment Type 2025 & 2033
- Figure 5: North America Enterprise Key Management Industry Revenue Share (%), by Deployment Type 2025 & 2033
- Figure 6: North America Enterprise Key Management Industry Volume Share (%), by Deployment Type 2025 & 2033
- Figure 7: North America Enterprise Key Management Industry Revenue (Million), by Application 2025 & 2033
- Figure 8: North America Enterprise Key Management Industry Volume (K Unit), by Application 2025 & 2033
- Figure 9: North America Enterprise Key Management Industry Revenue Share (%), by Application 2025 & 2033
- Figure 10: North America Enterprise Key Management Industry Volume Share (%), by Application 2025 & 2033
- Figure 11: North America Enterprise Key Management Industry Revenue (Million), by End-user Verticals 2025 & 2033
- Figure 12: North America Enterprise Key Management Industry Volume (K Unit), by End-user Verticals 2025 & 2033
- Figure 13: North America Enterprise Key Management Industry Revenue Share (%), by End-user Verticals 2025 & 2033
- Figure 14: North America Enterprise Key Management Industry Volume Share (%), by End-user Verticals 2025 & 2033
- Figure 15: North America Enterprise Key Management Industry Revenue (Million), by Country 2025 & 2033
- Figure 16: North America Enterprise Key Management Industry Volume (K Unit), by Country 2025 & 2033
- Figure 17: North America Enterprise Key Management Industry Revenue Share (%), by Country 2025 & 2033
- Figure 18: North America Enterprise Key Management Industry Volume Share (%), by Country 2025 & 2033
- Figure 19: Europe Enterprise Key Management Industry Revenue (Million), by Deployment Type 2025 & 2033
- Figure 20: Europe Enterprise Key Management Industry Volume (K Unit), by Deployment Type 2025 & 2033
- Figure 21: Europe Enterprise Key Management Industry Revenue Share (%), by Deployment Type 2025 & 2033
- Figure 22: Europe Enterprise Key Management Industry Volume Share (%), by Deployment Type 2025 & 2033
- Figure 23: Europe Enterprise Key Management Industry Revenue (Million), by Application 2025 & 2033
- Figure 24: Europe Enterprise Key Management Industry Volume (K Unit), by Application 2025 & 2033
- Figure 25: Europe Enterprise Key Management Industry Revenue Share (%), by Application 2025 & 2033
- Figure 26: Europe Enterprise Key Management Industry Volume Share (%), by Application 2025 & 2033
- Figure 27: Europe Enterprise Key Management Industry Revenue (Million), by End-user Verticals 2025 & 2033
- Figure 28: Europe Enterprise Key Management Industry Volume (K Unit), by End-user Verticals 2025 & 2033
- Figure 29: Europe Enterprise Key Management Industry Revenue Share (%), by End-user Verticals 2025 & 2033
- Figure 30: Europe Enterprise Key Management Industry Volume Share (%), by End-user Verticals 2025 & 2033
- Figure 31: Europe Enterprise Key Management Industry Revenue (Million), by Country 2025 & 2033
- Figure 32: Europe Enterprise Key Management Industry Volume (K Unit), by Country 2025 & 2033
- Figure 33: Europe Enterprise Key Management Industry Revenue Share (%), by Country 2025 & 2033
- Figure 34: Europe Enterprise Key Management Industry Volume Share (%), by Country 2025 & 2033
- Figure 35: Asia Enterprise Key Management Industry Revenue (Million), by Deployment Type 2025 & 2033
- Figure 36: Asia Enterprise Key Management Industry Volume (K Unit), by Deployment Type 2025 & 2033
- Figure 37: Asia Enterprise Key Management Industry Revenue Share (%), by Deployment Type 2025 & 2033
- Figure 38: Asia Enterprise Key Management Industry Volume Share (%), by Deployment Type 2025 & 2033
- Figure 39: Asia Enterprise Key Management Industry Revenue (Million), by Application 2025 & 2033
- Figure 40: Asia Enterprise Key Management Industry Volume (K Unit), by Application 2025 & 2033
- Figure 41: Asia Enterprise Key Management Industry Revenue Share (%), by Application 2025 & 2033
- Figure 42: Asia Enterprise Key Management Industry Volume Share (%), by Application 2025 & 2033
- Figure 43: Asia Enterprise Key Management Industry Revenue (Million), by End-user Verticals 2025 & 2033
- Figure 44: Asia Enterprise Key Management Industry Volume (K Unit), by End-user Verticals 2025 & 2033
- Figure 45: Asia Enterprise Key Management Industry Revenue Share (%), by End-user Verticals 2025 & 2033
- Figure 46: Asia Enterprise Key Management Industry Volume Share (%), by End-user Verticals 2025 & 2033
- Figure 47: Asia Enterprise Key Management Industry Revenue (Million), by Country 2025 & 2033
- Figure 48: Asia Enterprise Key Management Industry Volume (K Unit), by Country 2025 & 2033
- Figure 49: Asia Enterprise Key Management Industry Revenue Share (%), by Country 2025 & 2033
- Figure 50: Asia Enterprise Key Management Industry Volume Share (%), by Country 2025 & 2033
- Figure 51: Australia and New Zealand Enterprise Key Management Industry Revenue (Million), by Deployment Type 2025 & 2033
- Figure 52: Australia and New Zealand Enterprise Key Management Industry Volume (K Unit), by Deployment Type 2025 & 2033
- Figure 53: Australia and New Zealand Enterprise Key Management Industry Revenue Share (%), by Deployment Type 2025 & 2033
- Figure 54: Australia and New Zealand Enterprise Key Management Industry Volume Share (%), by Deployment Type 2025 & 2033
- Figure 55: Australia and New Zealand Enterprise Key Management Industry Revenue (Million), by Application 2025 & 2033
- Figure 56: Australia and New Zealand Enterprise Key Management Industry Volume (K Unit), by Application 2025 & 2033
- Figure 57: Australia and New Zealand Enterprise Key Management Industry Revenue Share (%), by Application 2025 & 2033
- Figure 58: Australia and New Zealand Enterprise Key Management Industry Volume Share (%), by Application 2025 & 2033
- Figure 59: Australia and New Zealand Enterprise Key Management Industry Revenue (Million), by End-user Verticals 2025 & 2033
- Figure 60: Australia and New Zealand Enterprise Key Management Industry Volume (K Unit), by End-user Verticals 2025 & 2033
- Figure 61: Australia and New Zealand Enterprise Key Management Industry Revenue Share (%), by End-user Verticals 2025 & 2033
- Figure 62: Australia and New Zealand Enterprise Key Management Industry Volume Share (%), by End-user Verticals 2025 & 2033
- Figure 63: Australia and New Zealand Enterprise Key Management Industry Revenue (Million), by Country 2025 & 2033
- Figure 64: Australia and New Zealand Enterprise Key Management Industry Volume (K Unit), by Country 2025 & 2033
- Figure 65: Australia and New Zealand Enterprise Key Management Industry Revenue Share (%), by Country 2025 & 2033
- Figure 66: Australia and New Zealand Enterprise Key Management Industry Volume Share (%), by Country 2025 & 2033
- Figure 67: Latin America Enterprise Key Management Industry Revenue (Million), by Deployment Type 2025 & 2033
- Figure 68: Latin America Enterprise Key Management Industry Volume (K Unit), by Deployment Type 2025 & 2033
- Figure 69: Latin America Enterprise Key Management Industry Revenue Share (%), by Deployment Type 2025 & 2033
- Figure 70: Latin America Enterprise Key Management Industry Volume Share (%), by Deployment Type 2025 & 2033
- Figure 71: Latin America Enterprise Key Management Industry Revenue (Million), by Application 2025 & 2033
- Figure 72: Latin America Enterprise Key Management Industry Volume (K Unit), by Application 2025 & 2033
- Figure 73: Latin America Enterprise Key Management Industry Revenue Share (%), by Application 2025 & 2033
- Figure 74: Latin America Enterprise Key Management Industry Volume Share (%), by Application 2025 & 2033
- Figure 75: Latin America Enterprise Key Management Industry Revenue (Million), by End-user Verticals 2025 & 2033
- Figure 76: Latin America Enterprise Key Management Industry Volume (K Unit), by End-user Verticals 2025 & 2033
- Figure 77: Latin America Enterprise Key Management Industry Revenue Share (%), by End-user Verticals 2025 & 2033
- Figure 78: Latin America Enterprise Key Management Industry Volume Share (%), by End-user Verticals 2025 & 2033
- Figure 79: Latin America Enterprise Key Management Industry Revenue (Million), by Country 2025 & 2033
- Figure 80: Latin America Enterprise Key Management Industry Volume (K Unit), by Country 2025 & 2033
- Figure 81: Latin America Enterprise Key Management Industry Revenue Share (%), by Country 2025 & 2033
- Figure 82: Latin America Enterprise Key Management Industry Volume Share (%), by Country 2025 & 2033
- Figure 83: Middle East and Africa Enterprise Key Management Industry Revenue (Million), by Deployment Type 2025 & 2033
- Figure 84: Middle East and Africa Enterprise Key Management Industry Volume (K Unit), by Deployment Type 2025 & 2033
- Figure 85: Middle East and Africa Enterprise Key Management Industry Revenue Share (%), by Deployment Type 2025 & 2033
- Figure 86: Middle East and Africa Enterprise Key Management Industry Volume Share (%), by Deployment Type 2025 & 2033
- Figure 87: Middle East and Africa Enterprise Key Management Industry Revenue (Million), by Application 2025 & 2033
- Figure 88: Middle East and Africa Enterprise Key Management Industry Volume (K Unit), by Application 2025 & 2033
- Figure 89: Middle East and Africa Enterprise Key Management Industry Revenue Share (%), by Application 2025 & 2033
- Figure 90: Middle East and Africa Enterprise Key Management Industry Volume Share (%), by Application 2025 & 2033
- Figure 91: Middle East and Africa Enterprise Key Management Industry Revenue (Million), by End-user Verticals 2025 & 2033
- Figure 92: Middle East and Africa Enterprise Key Management Industry Volume (K Unit), by End-user Verticals 2025 & 2033
- Figure 93: Middle East and Africa Enterprise Key Management Industry Revenue Share (%), by End-user Verticals 2025 & 2033
- Figure 94: Middle East and Africa Enterprise Key Management Industry Volume Share (%), by End-user Verticals 2025 & 2033
- Figure 95: Middle East and Africa Enterprise Key Management Industry Revenue (Million), by Country 2025 & 2033
- Figure 96: Middle East and Africa Enterprise Key Management Industry Volume (K Unit), by Country 2025 & 2033
- Figure 97: Middle East and Africa Enterprise Key Management Industry Revenue Share (%), by Country 2025 & 2033
- Figure 98: Middle East and Africa Enterprise Key Management Industry Volume Share (%), by Country 2025 & 2033
List of Tables
- Table 1: Global Enterprise Key Management Industry Revenue Million Forecast, by Deployment Type 2020 & 2033
- Table 2: Global Enterprise Key Management Industry Volume K Unit Forecast, by Deployment Type 2020 & 2033
- Table 3: Global Enterprise Key Management Industry Revenue Million Forecast, by Application 2020 & 2033
- Table 4: Global Enterprise Key Management Industry Volume K Unit Forecast, by Application 2020 & 2033
- Table 5: Global Enterprise Key Management Industry Revenue Million Forecast, by End-user Verticals 2020 & 2033
- Table 6: Global Enterprise Key Management Industry Volume K Unit Forecast, by End-user Verticals 2020 & 2033
- Table 7: Global Enterprise Key Management Industry Revenue Million Forecast, by Region 2020 & 2033
- Table 8: Global Enterprise Key Management Industry Volume K Unit Forecast, by Region 2020 & 2033
- Table 9: Global Enterprise Key Management Industry Revenue Million Forecast, by Deployment Type 2020 & 2033
- Table 10: Global Enterprise Key Management Industry Volume K Unit Forecast, by Deployment Type 2020 & 2033
- Table 11: Global Enterprise Key Management Industry Revenue Million Forecast, by Application 2020 & 2033
- Table 12: Global Enterprise Key Management Industry Volume K Unit Forecast, by Application 2020 & 2033
- Table 13: Global Enterprise Key Management Industry Revenue Million Forecast, by End-user Verticals 2020 & 2033
- Table 14: Global Enterprise Key Management Industry Volume K Unit Forecast, by End-user Verticals 2020 & 2033
- Table 15: Global Enterprise Key Management Industry Revenue Million Forecast, by Country 2020 & 2033
- Table 16: Global Enterprise Key Management Industry Volume K Unit Forecast, by Country 2020 & 2033
- Table 17: Global Enterprise Key Management Industry Revenue Million Forecast, by Deployment Type 2020 & 2033
- Table 18: Global Enterprise Key Management Industry Volume K Unit Forecast, by Deployment Type 2020 & 2033
- Table 19: Global Enterprise Key Management Industry Revenue Million Forecast, by Application 2020 & 2033
- Table 20: Global Enterprise Key Management Industry Volume K Unit Forecast, by Application 2020 & 2033
- Table 21: Global Enterprise Key Management Industry Revenue Million Forecast, by End-user Verticals 2020 & 2033
- Table 22: Global Enterprise Key Management Industry Volume K Unit Forecast, by End-user Verticals 2020 & 2033
- Table 23: Global Enterprise Key Management Industry Revenue Million Forecast, by Country 2020 & 2033
- Table 24: Global Enterprise Key Management Industry Volume K Unit Forecast, by Country 2020 & 2033
- Table 25: Global Enterprise Key Management Industry Revenue Million Forecast, by Deployment Type 2020 & 2033
- Table 26: Global Enterprise Key Management Industry Volume K Unit Forecast, by Deployment Type 2020 & 2033
- Table 27: Global Enterprise Key Management Industry Revenue Million Forecast, by Application 2020 & 2033
- Table 28: Global Enterprise Key Management Industry Volume K Unit Forecast, by Application 2020 & 2033
- Table 29: Global Enterprise Key Management Industry Revenue Million Forecast, by End-user Verticals 2020 & 2033
- Table 30: Global Enterprise Key Management Industry Volume K Unit Forecast, by End-user Verticals 2020 & 2033
- Table 31: Global Enterprise Key Management Industry Revenue Million Forecast, by Country 2020 & 2033
- Table 32: Global Enterprise Key Management Industry Volume K Unit Forecast, by Country 2020 & 2033
- Table 33: Global Enterprise Key Management Industry Revenue Million Forecast, by Deployment Type 2020 & 2033
- Table 34: Global Enterprise Key Management Industry Volume K Unit Forecast, by Deployment Type 2020 & 2033
- Table 35: Global Enterprise Key Management Industry Revenue Million Forecast, by Application 2020 & 2033
- Table 36: Global Enterprise Key Management Industry Volume K Unit Forecast, by Application 2020 & 2033
- Table 37: Global Enterprise Key Management Industry Revenue Million Forecast, by End-user Verticals 2020 & 2033
- Table 38: Global Enterprise Key Management Industry Volume K Unit Forecast, by End-user Verticals 2020 & 2033
- Table 39: Global Enterprise Key Management Industry Revenue Million Forecast, by Country 2020 & 2033
- Table 40: Global Enterprise Key Management Industry Volume K Unit Forecast, by Country 2020 & 2033
- Table 41: Global Enterprise Key Management Industry Revenue Million Forecast, by Deployment Type 2020 & 2033
- Table 42: Global Enterprise Key Management Industry Volume K Unit Forecast, by Deployment Type 2020 & 2033
- Table 43: Global Enterprise Key Management Industry Revenue Million Forecast, by Application 2020 & 2033
- Table 44: Global Enterprise Key Management Industry Volume K Unit Forecast, by Application 2020 & 2033
- Table 45: Global Enterprise Key Management Industry Revenue Million Forecast, by End-user Verticals 2020 & 2033
- Table 46: Global Enterprise Key Management Industry Volume K Unit Forecast, by End-user Verticals 2020 & 2033
- Table 47: Global Enterprise Key Management Industry Revenue Million Forecast, by Country 2020 & 2033
- Table 48: Global Enterprise Key Management Industry Volume K Unit Forecast, by Country 2020 & 2033
- Table 49: Global Enterprise Key Management Industry Revenue Million Forecast, by Deployment Type 2020 & 2033
- Table 50: Global Enterprise Key Management Industry Volume K Unit Forecast, by Deployment Type 2020 & 2033
- Table 51: Global Enterprise Key Management Industry Revenue Million Forecast, by Application 2020 & 2033
- Table 52: Global Enterprise Key Management Industry Volume K Unit Forecast, by Application 2020 & 2033
- Table 53: Global Enterprise Key Management Industry Revenue Million Forecast, by End-user Verticals 2020 & 2033
- Table 54: Global Enterprise Key Management Industry Volume K Unit Forecast, by End-user Verticals 2020 & 2033
- Table 55: Global Enterprise Key Management Industry Revenue Million Forecast, by Country 2020 & 2033
- Table 56: Global Enterprise Key Management Industry Volume K Unit Forecast, by Country 2020 & 2033
Frequently Asked Questions
1. What is the projected Compound Annual Growth Rate (CAGR) of the Enterprise Key Management Industry?
The projected CAGR is approximately 22.32%.
2. Which companies are prominent players in the Enterprise Key Management Industry?
Key companies in the market include Venafi, IBM Corporation, Hewlett Packard Enterprise Company, Quantum Corporation, Microsoft Corporation, Amazon Web Services Inc, Winmagic Inc, Google Inc (Alphabet), Thales Group (Gemalto NV), Oracle Corporation, Dell Technologies Inc.
3. What are the main segments of the Enterprise Key Management Industry?
The market segments include Deployment Type, Application, End-user Verticals.
4. Can you provide details about the market size?
The market size is estimated to be USD 2.32 Million as of 2022.
5. What are some drivers contributing to market growth?
Optimizing Overall Ownership Cost for Security While Maximizing Operational Efficiency and Security; Loss of High Profile Data and Compliance Issues; Massive Growth of Data Due to the Adoption of IoT and Cloud Technologies.
6. What are the notable trends driving market growth?
Cloud Segment to Witness Significant Growth.
7. Are there any restraints impacting market growth?
Lack of Awareness and Skilled Workforce.
8. Can you provide examples of recent developments in the market?
September 2023: Thales launched Hold Your Own Key (HYOK) by CipherTrust Cloud Key Management in Oracle Cloud Infrastructure (OCI) across 45 Oracle Cloud Regions. Customers of OCI can store and manage their encryption keys outside of OCI in a physical or virtual appliance that is completely under their control and not connected to the cloud by integrating CipherTrust Cloud Key Management. By keeping the key in a separate location from the encrypted data, the Thales external key management solution can facilitate the transfer of sensitive data into Oracle Cloud Regions quickly.
9. What pricing options are available for accessing the report?
Pricing options include single-user, multi-user, and enterprise licenses priced at USD 4750, USD 5250, and USD 8750 respectively.
10. Is the market size provided in terms of value or volume?
The market size is provided in terms of value, measured in Million and volume, measured in K Unit.
11. Are there any specific market keywords associated with the report?
Yes, the market keyword associated with the report is "Enterprise Key Management Industry," which aids in identifying and referencing the specific market segment covered.
12. How do I determine which pricing option suits my needs best?
The pricing options vary based on user requirements and access needs. Individual users may opt for single-user licenses, while businesses requiring broader access may choose multi-user or enterprise licenses for cost-effective access to the report.
13. Are there any additional resources or data provided in the Enterprise Key Management Industry report?
While the report offers comprehensive insights, it's advisable to review the specific contents or supplementary materials provided to ascertain if additional resources or data are available.
14. How can I stay updated on further developments or reports in the Enterprise Key Management Industry?
To stay informed about further developments, trends, and reports in the Enterprise Key Management Industry, consider subscribing to industry newsletters, following relevant companies and organizations, or regularly checking reputable industry news sources and publications.
Methodology
Step 1 - Identification of Relevant Samples Size from Population Database


Step 2 - Approaches for Defining Global Market Size (Value, Volume* & Price*)

Note*: In applicable scenarios
Step 3 - Data Sources
Primary Research
- Web Analytics
- Survey Reports
- Research Institute
- Latest Research Reports
- Opinion Leaders
Secondary Research
- Annual Reports
- White Paper
- Latest Press Release
- Industry Association
- Paid Database
- Investor Presentations

Step 4 - Data Triangulation
Involves using different sources of information in order to increase the validity of a study
These sources are likely to be stakeholders in a program - participants, other researchers, program staff, other community members, and so on.
Then we put all data in single framework & apply various statistical tools to find out the dynamic on the market.
During the analysis stage, feedback from the stakeholder groups would be compared to determine areas of agreement as well as areas of divergence