

Key Insights
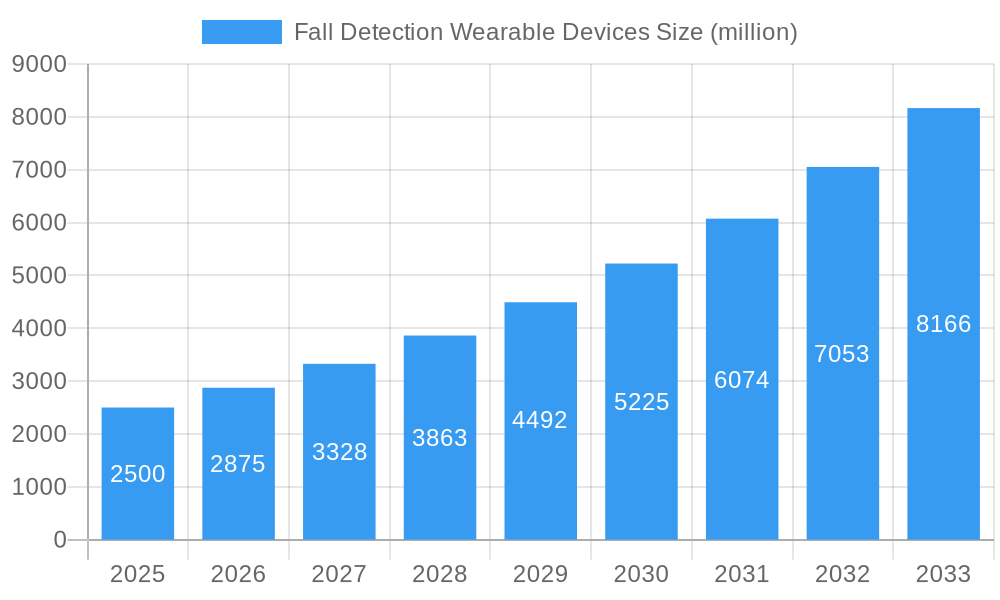
The global market for fall detection wearable devices is experiencing robust growth, driven by an aging population, increasing awareness of fall-related injuries, and technological advancements leading to more sophisticated and user-friendly devices. The market, estimated at $2.5 billion in 2025, is projected to exhibit a Compound Annual Growth Rate (CAGR) of 15% from 2025 to 2033, reaching an estimated market value of approximately $7 billion by 2033. Key growth drivers include rising healthcare costs associated with fall-related injuries, the increasing adoption of telehealth solutions, and the growing demand for independent living among elderly individuals. Market trends indicate a shift towards more integrated devices offering features beyond fall detection, such as GPS tracking, heart rate monitoring, and emergency communication capabilities. While the market faces restraints such as high initial costs of devices, concerns about battery life and device accuracy, and the need for improved user education and adoption, the overall growth trajectory remains positive. Major players such as Medical Guardian, Lively, and Bay Alarm Medical are continuously innovating to address these challenges and expand their market share. Segment-wise, the market is likely dominated by devices targeting the elderly population, with a strong growth potential observed in segments focused on specific healthcare needs and integration with smart home technologies.
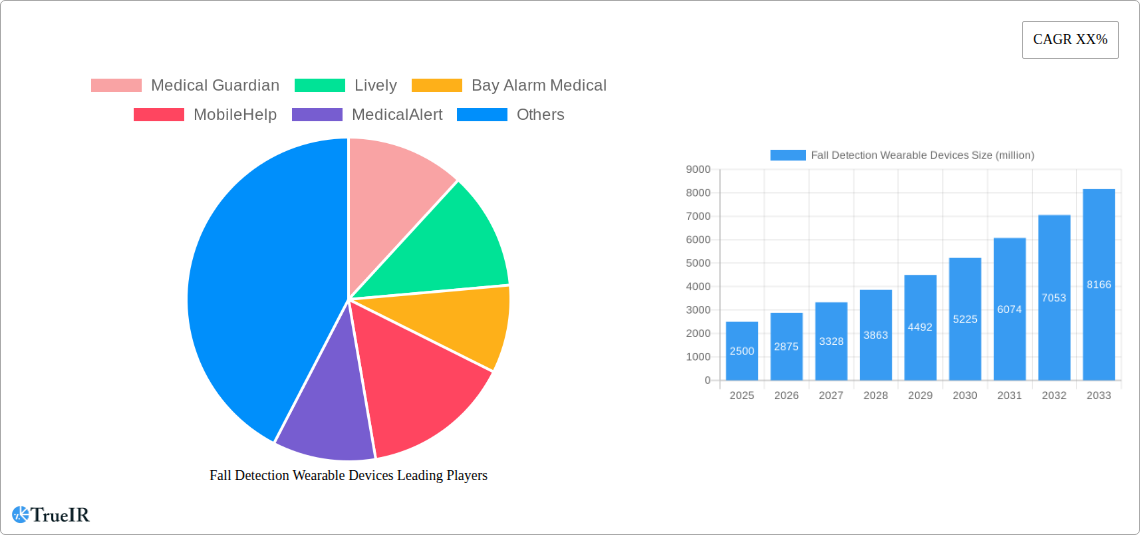
Fall Detection Wearable Devices Market Size (In Billion)
The competitive landscape is characterized by a mix of established players and emerging companies vying for market share. Established companies are leveraging their strong brand reputation and distribution networks, while newer entrants are focusing on innovation and competitive pricing strategies. Technological advancements, particularly in areas like artificial intelligence (AI) and machine learning (ML), are expected to further improve the accuracy and functionality of fall detection wearables. Future market growth will hinge on advancements in sensor technology, improved integration with healthcare systems, and increased awareness of the benefits of fall detection devices amongst both consumers and healthcare providers. The focus on personalized healthcare and remote patient monitoring solutions also presents a significant opportunity for growth in this sector.
Fall Detection Wearable Devices Company Market Share
Fall Detection Wearable Devices Market Report: 2019-2033
This comprehensive report provides a detailed analysis of the Fall Detection Wearable Devices market, offering invaluable insights for industry stakeholders, investors, and researchers. The report covers the period from 2019 to 2033, with a base year of 2025 and a forecast period from 2025 to 2033. The market is projected to reach a value of $XX million by 2033, demonstrating significant growth potential. This report leverages extensive data analysis, expert insights, and key performance indicators (KPIs) to offer a holistic understanding of market dynamics, competitive landscape, and future opportunities.
Fall Detection Wearable Devices Market Structure & Competitive Landscape
The Fall Detection Wearable Devices market exhibits a moderately concentrated structure, with a few major players holding significant market share. The Herfindahl-Hirschman Index (HHI) for 2025 is estimated at xx, indicating a moderately competitive landscape. Innovation is a key driver, with continuous advancements in sensor technology, AI-powered algorithms, and connectivity solutions fueling market growth. Regulatory compliance, particularly concerning data privacy and medical device approvals, significantly impacts market dynamics. Substitutes include traditional personal emergency response systems (PERS) and caregiver monitoring services. The market is primarily segmented by end-user (elderly individuals, patients with chronic conditions, athletes etc.), device type (smartwatches, pendants, etc.), and pricing tiers. The M&A activity in this space is expected to remain robust, with an estimated xx million dollars in deal value projected for 2025-2027 driven by consolidation and expansion of market share within the industry.
- Market Concentration: HHI of xx in 2025.
- Innovation Drivers: Advancements in sensor technology, AI, and connectivity.
- Regulatory Impacts: Data privacy regulations and medical device approvals.
- Product Substitutes: Traditional PERS and caregiver monitoring.
- End-User Segmentation: Elderly individuals, patients with chronic conditions, athletes.
- M&A Trends: xx million in deal value projected for 2025-2027.
Fall Detection Wearable Devices Market Trends & Opportunities
The global Fall Detection Wearable Devices market is experiencing substantial growth, driven by an aging global population, increasing awareness of fall-related injuries, and technological advancements enabling more sophisticated and user-friendly devices. The market size is projected to reach $XX million by 2033, exhibiting a compound annual growth rate (CAGR) of xx% during the forecast period (2025-2033). Technological shifts, such as the integration of AI and machine learning for improved fall detection accuracy and the development of more comfortable and aesthetically pleasing devices, are reshaping the market. Consumer preferences are shifting towards smaller, lighter devices with extended battery life and seamless integration with smartphones and other health applications. The market penetration rate of these devices is increasing steadily, particularly among the elderly population, reaching an estimated xx% in 2025. Competitive dynamics are characterized by both established players and new entrants striving for innovation and market share.
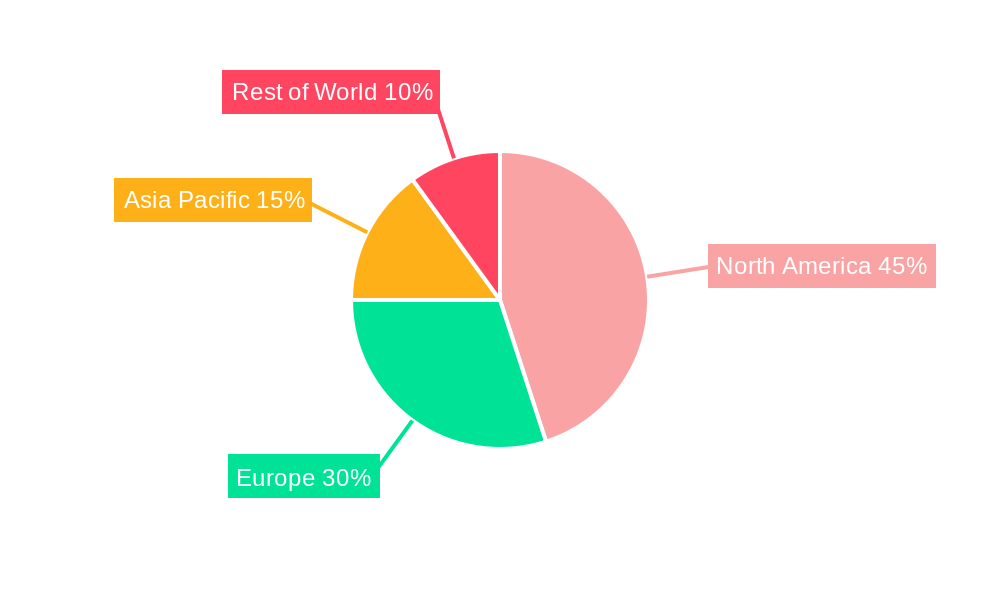
Dominant Markets & Segments in Fall Detection Wearable Devices
North America currently dominates the Fall Detection Wearable Devices market, driven by factors including high geriatric population density, robust healthcare infrastructure, and high disposable income. This region accounts for approximately xx% of the global market share in 2025.
- Key Growth Drivers in North America:
- High geriatric population.
- Advanced healthcare infrastructure.
- High adoption of smart technologies.
- Favorable regulatory environment.
- Increased government initiatives and insurance coverage.
The European market is also significant, with steady growth expected over the forecast period. Asia-Pacific is expected to witness the fastest growth, driven by increasing disposable incomes and growing awareness of fall-related risks.
Fall Detection Wearable Devices Product Analysis
The market offers a range of products, from simple fall detection pendants to sophisticated smartwatches with advanced health monitoring capabilities. Key technological advancements include improved sensor technology for accurate fall detection, advanced algorithms to minimize false alarms, and better integration with telehealth platforms. This allows for more efficient monitoring and immediate response capabilities. Successful products offer a balance of functionality, user-friendliness, comfort, and affordability, catering to diverse needs and preferences across different age groups and health conditions.
Key Drivers, Barriers & Challenges in Fall Detection Wearable Devices
Key Drivers:
- The aging global population, leading to increased fall incidents.
- Technological advancements leading to improved accuracy and affordability.
- Rising healthcare costs and demand for remote patient monitoring solutions.
- Increased government initiatives and insurance coverage for fall prevention.
Challenges:
- High initial investment costs for devices and infrastructure.
- Potential for false alarms, impacting user trust and adoption.
- Regulatory hurdles and data privacy concerns impacting product development and market access.
- Intense competition among existing and emerging players. An estimated xx million dollars in lost revenue in 2025 due to competitive pressures.
Growth Drivers in the Fall Detection Wearable Devices Market
The market's growth is propelled by the aging global population, technological progress offering more precise and affordable devices, the rising expenses of healthcare, and an increase in government-led initiatives focused on preventing falls. The integration of AI and machine learning in fall detection algorithms enhances accuracy while reducing false alarms. Government regulations mandating fall prevention measures and increased insurance coverage for preventative technologies are additional growth catalysts.
Challenges Impacting Fall Detection Wearable Devices Growth
High initial device and infrastructure costs are a significant barrier, along with challenges like false alarms affecting user confidence and adoption rates. Regulatory hurdles and privacy concerns surrounding data handling complicate product development and market access. Furthermore, fierce competition among established and new companies puts downward pressure on profit margins.
Key Players Shaping the Fall Detection Wearable Devices Market
Significant Fall Detection Wearable Devices Industry Milestones
- 2020: Launch of AI-powered fall detection algorithm by xx company.
- 2021: FDA approval of a new fall detection smartwatch by xx company.
- 2022: Merger between two major players in the market leading to increased market share.
- 2023: Introduction of a new low-cost fall detection device targeting developing markets.
- 2024: Significant increase in government funding for fall prevention programs, stimulating market growth.
Future Outlook for Fall Detection Wearable Devices Market
The market is poised for sustained growth, fueled by continued technological advancements, increasing adoption by the elderly population, and supportive government policies. Strategic opportunities lie in developing more affordable, user-friendly, and feature-rich devices, coupled with integrated telehealth services for seamless patient monitoring. The market's potential is substantial, with projections of millions of units sold annually by 2033, indicating a lucrative investment opportunity and significant potential for positive social impact.
Fall Detection Wearable Devices Segmentation
-
1. Application
- 1.1. Hospitals
- 1.2. Nursing Homes
- 1.3. Home Use
- 1.4. Others
-
2. Types
- 2.1. Pendants
- 2.2. Bracelets
- 2.3. Others
Fall Detection Wearable Devices Segmentation By Geography
-
1. North America
- 1.1. United States
- 1.2. Canada
- 1.3. Mexico
-
2. South America
- 2.1. Brazil
- 2.2. Argentina
- 2.3. Rest of South America
-
3. Europe
- 3.1. United Kingdom
- 3.2. Germany
- 3.3. France
- 3.4. Italy
- 3.5. Spain
- 3.6. Russia
- 3.7. Benelux
- 3.8. Nordics
- 3.9. Rest of Europe
-
4. Middle East & Africa
- 4.1. Turkey
- 4.2. Israel
- 4.3. GCC
- 4.4. North Africa
- 4.5. South Africa
- 4.6. Rest of Middle East & Africa
-
5. Asia Pacific
- 5.1. China
- 5.2. India
- 5.3. Japan
- 5.4. South Korea
- 5.5. ASEAN
- 5.6. Oceania
- 5.7. Rest of Asia Pacific
Fall Detection Wearable Devices Regional Market Share
Geographic Coverage of Fall Detection Wearable Devices
Fall Detection Wearable Devices REPORT HIGHLIGHTS
| Aspects | Details |
|---|---|
| Study Period | 2020-2034 |
| Base Year | 2025 |
| Estimated Year | 2026 |
| Forecast Period | 2026-2034 |
| Historical Period | 2020-2025 |
| Growth Rate | CAGR of XX% from 2020-2034 |
| Segmentation |
|
Table of Contents
- 1. Introduction
- 1.1. Research Scope
- 1.2. Market Segmentation
- 1.3. Research Objective
- 1.4. Definitions and Assumptions
- 2. Executive Summary
- 2.1. Market Snapshot
- 3. Market Dynamics
- 3.1. Market Drivers
- 3.2. Market Restrains
- 3.3. Market Trends
- 3.4. Market Opportunities
- 4. Market Factor Analysis
- 4.1. Porters Five Forces
- 4.1.1. Bargaining Power of Suppliers
- 4.1.2. Bargaining Power of Buyers
- 4.1.3. Threat of New Entrants
- 4.1.4. Threat of Substitutes
- 4.1.5. Competitive Rivalry
- 4.2. PESTEL analysis
- 4.3. BCG Analysis
- 4.3.1. Stars (High Growth, High Market Share)
- 4.3.2. Cash Cows (Low Growth, High Market Share)
- 4.3.3. Question Mark (High Growth, Low Market Share)
- 4.3.4. Dogs (Low Growth, Low Market Share)
- 4.4. Ansoff Matrix Analysis
- 4.5. Supply Chain Analysis
- 4.6. Regulatory Landscape
- 4.7. Current Market Potential and Opportunity Assessment (TAM–SAM–SOM Framework)
- 4.8. TIR Analyst Note
- 4.1. Porters Five Forces
- 5. Market Analysis, Insights and Forecast 2021-2033
- 5.1. Market Analysis, Insights and Forecast - by Application
- 5.1.1. Hospitals
- 5.1.2. Nursing Homes
- 5.1.3. Home Use
- 5.1.4. Others
- 5.2. Market Analysis, Insights and Forecast - by Types
- 5.2.1. Pendants
- 5.2.2. Bracelets
- 5.2.3. Others
- 5.3. Market Analysis, Insights and Forecast - by Region
- 5.3.1. North America
- 5.3.2. South America
- 5.3.3. Europe
- 5.3.4. Middle East & Africa
- 5.3.5. Asia Pacific
- 5.1. Market Analysis, Insights and Forecast - by Application
- 6. Global Fall Detection Wearable Devices Analysis, Insights and Forecast, 2021-2033
- 6.1. Market Analysis, Insights and Forecast - by Application
- 6.1.1. Hospitals
- 6.1.2. Nursing Homes
- 6.1.3. Home Use
- 6.1.4. Others
- 6.2. Market Analysis, Insights and Forecast - by Types
- 6.2.1. Pendants
- 6.2.2. Bracelets
- 6.2.3. Others
- 6.1. Market Analysis, Insights and Forecast - by Application
- 7. North America Fall Detection Wearable Devices Analysis, Insights and Forecast, 2020-2032
- 7.1. Market Analysis, Insights and Forecast - by Application
- 7.1.1. Hospitals
- 7.1.2. Nursing Homes
- 7.1.3. Home Use
- 7.1.4. Others
- 7.2. Market Analysis, Insights and Forecast - by Types
- 7.2.1. Pendants
- 7.2.2. Bracelets
- 7.2.3. Others
- 7.1. Market Analysis, Insights and Forecast - by Application
- 8. South America Fall Detection Wearable Devices Analysis, Insights and Forecast, 2020-2032
- 8.1. Market Analysis, Insights and Forecast - by Application
- 8.1.1. Hospitals
- 8.1.2. Nursing Homes
- 8.1.3. Home Use
- 8.1.4. Others
- 8.2. Market Analysis, Insights and Forecast - by Types
- 8.2.1. Pendants
- 8.2.2. Bracelets
- 8.2.3. Others
- 8.1. Market Analysis, Insights and Forecast - by Application
- 9. Europe Fall Detection Wearable Devices Analysis, Insights and Forecast, 2020-2032
- 9.1. Market Analysis, Insights and Forecast - by Application
- 9.1.1. Hospitals
- 9.1.2. Nursing Homes
- 9.1.3. Home Use
- 9.1.4. Others
- 9.2. Market Analysis, Insights and Forecast - by Types
- 9.2.1. Pendants
- 9.2.2. Bracelets
- 9.2.3. Others
- 9.1. Market Analysis, Insights and Forecast - by Application
- 10. Middle East & Africa Fall Detection Wearable Devices Analysis, Insights and Forecast, 2020-2032
- 10.1. Market Analysis, Insights and Forecast - by Application
- 10.1.1. Hospitals
- 10.1.2. Nursing Homes
- 10.1.3. Home Use
- 10.1.4. Others
- 10.2. Market Analysis, Insights and Forecast - by Types
- 10.2.1. Pendants
- 10.2.2. Bracelets
- 10.2.3. Others
- 10.1. Market Analysis, Insights and Forecast - by Application
- 11. Asia Pacific Fall Detection Wearable Devices Analysis, Insights and Forecast, 2020-2032
- 11.1. Market Analysis, Insights and Forecast - by Application
- 11.1.1. Hospitals
- 11.1.2. Nursing Homes
- 11.1.3. Home Use
- 11.1.4. Others
- 11.2. Market Analysis, Insights and Forecast - by Types
- 11.2.1. Pendants
- 11.2.2. Bracelets
- 11.2.3. Others
- 11.1. Market Analysis, Insights and Forecast - by Application
- 12. Competitive Analysis
- 12.1. Company Profiles
- 12.1.1 Medical Guardian
- 12.1.1.1. Company Overview
- 12.1.1.2. Products
- 12.1.1.3. Company Financials
- 12.1.1.4. SWOT Analysis
- 12.1.2 Lively
- 12.1.2.1. Company Overview
- 12.1.2.2. Products
- 12.1.2.3. Company Financials
- 12.1.2.4. SWOT Analysis
- 12.1.3 Bay Alarm Medical
- 12.1.3.1. Company Overview
- 12.1.3.2. Products
- 12.1.3.3. Company Financials
- 12.1.3.4. SWOT Analysis
- 12.1.4 MobileHelp
- 12.1.4.1. Company Overview
- 12.1.4.2. Products
- 12.1.4.3. Company Financials
- 12.1.4.4. SWOT Analysis
- 12.1.5 MedicalAlert
- 12.1.5.1. Company Overview
- 12.1.5.2. Products
- 12.1.5.3. Company Financials
- 12.1.5.4. SWOT Analysis
- 12.1.6 Aloe Care Health
- 12.1.6.1. Company Overview
- 12.1.6.2. Products
- 12.1.6.3. Company Financials
- 12.1.6.4. SWOT Analysis
- 12.1.7 Tunstall Healthcare
- 12.1.7.1. Company Overview
- 12.1.7.2. Products
- 12.1.7.3. Company Financials
- 12.1.7.4. SWOT Analysis
- 12.1.8 SureSafe
- 12.1.8.1. Company Overview
- 12.1.8.2. Products
- 12.1.8.3. Company Financials
- 12.1.8.4. SWOT Analysis
- 12.1.9 GetSafe
- 12.1.9.1. Company Overview
- 12.1.9.2. Products
- 12.1.9.3. Company Financials
- 12.1.9.4. SWOT Analysis
- 12.1.10 Philips Lifeline
- 12.1.10.1. Company Overview
- 12.1.10.2. Products
- 12.1.10.3. Company Financials
- 12.1.10.4. SWOT Analysis
- 12.1.1 Medical Guardian
- 12.2. Market Entropy
- 12.2.1 Company's Key Areas Served
- 12.2.2 Recent Developments
- 12.3. Company Market Share Analysis 2025
- 12.3.1 Top 5 Companies Market Share Analysis
- 12.3.2 Top 3 Companies Market Share Analysis
- 12.4. List of Potential Customers
- 13. Research Methodology
List of Figures
- Figure 1: Global Fall Detection Wearable Devices Revenue Breakdown (million, %) by Region 2025 & 2033
- Figure 2: Global Fall Detection Wearable Devices Volume Breakdown (K, %) by Region 2025 & 2033
- Figure 3: North America Fall Detection Wearable Devices Revenue (million), by Application 2025 & 2033
- Figure 4: North America Fall Detection Wearable Devices Volume (K), by Application 2025 & 2033
- Figure 5: North America Fall Detection Wearable Devices Revenue Share (%), by Application 2025 & 2033
- Figure 6: North America Fall Detection Wearable Devices Volume Share (%), by Application 2025 & 2033
- Figure 7: North America Fall Detection Wearable Devices Revenue (million), by Types 2025 & 2033
- Figure 8: North America Fall Detection Wearable Devices Volume (K), by Types 2025 & 2033
- Figure 9: North America Fall Detection Wearable Devices Revenue Share (%), by Types 2025 & 2033
- Figure 10: North America Fall Detection Wearable Devices Volume Share (%), by Types 2025 & 2033
- Figure 11: North America Fall Detection Wearable Devices Revenue (million), by Country 2025 & 2033
- Figure 12: North America Fall Detection Wearable Devices Volume (K), by Country 2025 & 2033
- Figure 13: North America Fall Detection Wearable Devices Revenue Share (%), by Country 2025 & 2033
- Figure 14: North America Fall Detection Wearable Devices Volume Share (%), by Country 2025 & 2033
- Figure 15: South America Fall Detection Wearable Devices Revenue (million), by Application 2025 & 2033
- Figure 16: South America Fall Detection Wearable Devices Volume (K), by Application 2025 & 2033
- Figure 17: South America Fall Detection Wearable Devices Revenue Share (%), by Application 2025 & 2033
- Figure 18: South America Fall Detection Wearable Devices Volume Share (%), by Application 2025 & 2033
- Figure 19: South America Fall Detection Wearable Devices Revenue (million), by Types 2025 & 2033
- Figure 20: South America Fall Detection Wearable Devices Volume (K), by Types 2025 & 2033
- Figure 21: South America Fall Detection Wearable Devices Revenue Share (%), by Types 2025 & 2033
- Figure 22: South America Fall Detection Wearable Devices Volume Share (%), by Types 2025 & 2033
- Figure 23: South America Fall Detection Wearable Devices Revenue (million), by Country 2025 & 2033
- Figure 24: South America Fall Detection Wearable Devices Volume (K), by Country 2025 & 2033
- Figure 25: South America Fall Detection Wearable Devices Revenue Share (%), by Country 2025 & 2033
- Figure 26: South America Fall Detection Wearable Devices Volume Share (%), by Country 2025 & 2033
- Figure 27: Europe Fall Detection Wearable Devices Revenue (million), by Application 2025 & 2033
- Figure 28: Europe Fall Detection Wearable Devices Volume (K), by Application 2025 & 2033
- Figure 29: Europe Fall Detection Wearable Devices Revenue Share (%), by Application 2025 & 2033
- Figure 30: Europe Fall Detection Wearable Devices Volume Share (%), by Application 2025 & 2033
- Figure 31: Europe Fall Detection Wearable Devices Revenue (million), by Types 2025 & 2033
- Figure 32: Europe Fall Detection Wearable Devices Volume (K), by Types 2025 & 2033
- Figure 33: Europe Fall Detection Wearable Devices Revenue Share (%), by Types 2025 & 2033
- Figure 34: Europe Fall Detection Wearable Devices Volume Share (%), by Types 2025 & 2033
- Figure 35: Europe Fall Detection Wearable Devices Revenue (million), by Country 2025 & 2033
- Figure 36: Europe Fall Detection Wearable Devices Volume (K), by Country 2025 & 2033
- Figure 37: Europe Fall Detection Wearable Devices Revenue Share (%), by Country 2025 & 2033
- Figure 38: Europe Fall Detection Wearable Devices Volume Share (%), by Country 2025 & 2033
- Figure 39: Middle East & Africa Fall Detection Wearable Devices Revenue (million), by Application 2025 & 2033
- Figure 40: Middle East & Africa Fall Detection Wearable Devices Volume (K), by Application 2025 & 2033
- Figure 41: Middle East & Africa Fall Detection Wearable Devices Revenue Share (%), by Application 2025 & 2033
- Figure 42: Middle East & Africa Fall Detection Wearable Devices Volume Share (%), by Application 2025 & 2033
- Figure 43: Middle East & Africa Fall Detection Wearable Devices Revenue (million), by Types 2025 & 2033
- Figure 44: Middle East & Africa Fall Detection Wearable Devices Volume (K), by Types 2025 & 2033
- Figure 45: Middle East & Africa Fall Detection Wearable Devices Revenue Share (%), by Types 2025 & 2033
- Figure 46: Middle East & Africa Fall Detection Wearable Devices Volume Share (%), by Types 2025 & 2033
- Figure 47: Middle East & Africa Fall Detection Wearable Devices Revenue (million), by Country 2025 & 2033
- Figure 48: Middle East & Africa Fall Detection Wearable Devices Volume (K), by Country 2025 & 2033
- Figure 49: Middle East & Africa Fall Detection Wearable Devices Revenue Share (%), by Country 2025 & 2033
- Figure 50: Middle East & Africa Fall Detection Wearable Devices Volume Share (%), by Country 2025 & 2033
- Figure 51: Asia Pacific Fall Detection Wearable Devices Revenue (million), by Application 2025 & 2033
- Figure 52: Asia Pacific Fall Detection Wearable Devices Volume (K), by Application 2025 & 2033
- Figure 53: Asia Pacific Fall Detection Wearable Devices Revenue Share (%), by Application 2025 & 2033
- Figure 54: Asia Pacific Fall Detection Wearable Devices Volume Share (%), by Application 2025 & 2033
- Figure 55: Asia Pacific Fall Detection Wearable Devices Revenue (million), by Types 2025 & 2033
- Figure 56: Asia Pacific Fall Detection Wearable Devices Volume (K), by Types 2025 & 2033
- Figure 57: Asia Pacific Fall Detection Wearable Devices Revenue Share (%), by Types 2025 & 2033
- Figure 58: Asia Pacific Fall Detection Wearable Devices Volume Share (%), by Types 2025 & 2033
- Figure 59: Asia Pacific Fall Detection Wearable Devices Revenue (million), by Country 2025 & 2033
- Figure 60: Asia Pacific Fall Detection Wearable Devices Volume (K), by Country 2025 & 2033
- Figure 61: Asia Pacific Fall Detection Wearable Devices Revenue Share (%), by Country 2025 & 2033
- Figure 62: Asia Pacific Fall Detection Wearable Devices Volume Share (%), by Country 2025 & 2033
List of Tables
- Table 1: Global Fall Detection Wearable Devices Revenue million Forecast, by Application 2020 & 2033
- Table 2: Global Fall Detection Wearable Devices Volume K Forecast, by Application 2020 & 2033
- Table 3: Global Fall Detection Wearable Devices Revenue million Forecast, by Types 2020 & 2033
- Table 4: Global Fall Detection Wearable Devices Volume K Forecast, by Types 2020 & 2033
- Table 5: Global Fall Detection Wearable Devices Revenue million Forecast, by Region 2020 & 2033
- Table 6: Global Fall Detection Wearable Devices Volume K Forecast, by Region 2020 & 2033
- Table 7: Global Fall Detection Wearable Devices Revenue million Forecast, by Application 2020 & 2033
- Table 8: Global Fall Detection Wearable Devices Volume K Forecast, by Application 2020 & 2033
- Table 9: Global Fall Detection Wearable Devices Revenue million Forecast, by Types 2020 & 2033
- Table 10: Global Fall Detection Wearable Devices Volume K Forecast, by Types 2020 & 2033
- Table 11: Global Fall Detection Wearable Devices Revenue million Forecast, by Country 2020 & 2033
- Table 12: Global Fall Detection Wearable Devices Volume K Forecast, by Country 2020 & 2033
- Table 13: United States Fall Detection Wearable Devices Revenue (million) Forecast, by Application 2020 & 2033
- Table 14: United States Fall Detection Wearable Devices Volume (K) Forecast, by Application 2020 & 2033
- Table 15: Canada Fall Detection Wearable Devices Revenue (million) Forecast, by Application 2020 & 2033
- Table 16: Canada Fall Detection Wearable Devices Volume (K) Forecast, by Application 2020 & 2033
- Table 17: Mexico Fall Detection Wearable Devices Revenue (million) Forecast, by Application 2020 & 2033
- Table 18: Mexico Fall Detection Wearable Devices Volume (K) Forecast, by Application 2020 & 2033
- Table 19: Global Fall Detection Wearable Devices Revenue million Forecast, by Application 2020 & 2033
- Table 20: Global Fall Detection Wearable Devices Volume K Forecast, by Application 2020 & 2033
- Table 21: Global Fall Detection Wearable Devices Revenue million Forecast, by Types 2020 & 2033
- Table 22: Global Fall Detection Wearable Devices Volume K Forecast, by Types 2020 & 2033
- Table 23: Global Fall Detection Wearable Devices Revenue million Forecast, by Country 2020 & 2033
- Table 24: Global Fall Detection Wearable Devices Volume K Forecast, by Country 2020 & 2033
- Table 25: Brazil Fall Detection Wearable Devices Revenue (million) Forecast, by Application 2020 & 2033
- Table 26: Brazil Fall Detection Wearable Devices Volume (K) Forecast, by Application 2020 & 2033
- Table 27: Argentina Fall Detection Wearable Devices Revenue (million) Forecast, by Application 2020 & 2033
- Table 28: Argentina Fall Detection Wearable Devices Volume (K) Forecast, by Application 2020 & 2033
- Table 29: Rest of South America Fall Detection Wearable Devices Revenue (million) Forecast, by Application 2020 & 2033
- Table 30: Rest of South America Fall Detection Wearable Devices Volume (K) Forecast, by Application 2020 & 2033
- Table 31: Global Fall Detection Wearable Devices Revenue million Forecast, by Application 2020 & 2033
- Table 32: Global Fall Detection Wearable Devices Volume K Forecast, by Application 2020 & 2033
- Table 33: Global Fall Detection Wearable Devices Revenue million Forecast, by Types 2020 & 2033
- Table 34: Global Fall Detection Wearable Devices Volume K Forecast, by Types 2020 & 2033
- Table 35: Global Fall Detection Wearable Devices Revenue million Forecast, by Country 2020 & 2033
- Table 36: Global Fall Detection Wearable Devices Volume K Forecast, by Country 2020 & 2033
- Table 37: United Kingdom Fall Detection Wearable Devices Revenue (million) Forecast, by Application 2020 & 2033
- Table 38: United Kingdom Fall Detection Wearable Devices Volume (K) Forecast, by Application 2020 & 2033
- Table 39: Germany Fall Detection Wearable Devices Revenue (million) Forecast, by Application 2020 & 2033
- Table 40: Germany Fall Detection Wearable Devices Volume (K) Forecast, by Application 2020 & 2033
- Table 41: France Fall Detection Wearable Devices Revenue (million) Forecast, by Application 2020 & 2033
- Table 42: France Fall Detection Wearable Devices Volume (K) Forecast, by Application 2020 & 2033
- Table 43: Italy Fall Detection Wearable Devices Revenue (million) Forecast, by Application 2020 & 2033
- Table 44: Italy Fall Detection Wearable Devices Volume (K) Forecast, by Application 2020 & 2033
- Table 45: Spain Fall Detection Wearable Devices Revenue (million) Forecast, by Application 2020 & 2033
- Table 46: Spain Fall Detection Wearable Devices Volume (K) Forecast, by Application 2020 & 2033
- Table 47: Russia Fall Detection Wearable Devices Revenue (million) Forecast, by Application 2020 & 2033
- Table 48: Russia Fall Detection Wearable Devices Volume (K) Forecast, by Application 2020 & 2033
- Table 49: Benelux Fall Detection Wearable Devices Revenue (million) Forecast, by Application 2020 & 2033
- Table 50: Benelux Fall Detection Wearable Devices Volume (K) Forecast, by Application 2020 & 2033
- Table 51: Nordics Fall Detection Wearable Devices Revenue (million) Forecast, by Application 2020 & 2033
- Table 52: Nordics Fall Detection Wearable Devices Volume (K) Forecast, by Application 2020 & 2033
- Table 53: Rest of Europe Fall Detection Wearable Devices Revenue (million) Forecast, by Application 2020 & 2033
- Table 54: Rest of Europe Fall Detection Wearable Devices Volume (K) Forecast, by Application 2020 & 2033
- Table 55: Global Fall Detection Wearable Devices Revenue million Forecast, by Application 2020 & 2033
- Table 56: Global Fall Detection Wearable Devices Volume K Forecast, by Application 2020 & 2033
- Table 57: Global Fall Detection Wearable Devices Revenue million Forecast, by Types 2020 & 2033
- Table 58: Global Fall Detection Wearable Devices Volume K Forecast, by Types 2020 & 2033
- Table 59: Global Fall Detection Wearable Devices Revenue million Forecast, by Country 2020 & 2033
- Table 60: Global Fall Detection Wearable Devices Volume K Forecast, by Country 2020 & 2033
- Table 61: Turkey Fall Detection Wearable Devices Revenue (million) Forecast, by Application 2020 & 2033
- Table 62: Turkey Fall Detection Wearable Devices Volume (K) Forecast, by Application 2020 & 2033
- Table 63: Israel Fall Detection Wearable Devices Revenue (million) Forecast, by Application 2020 & 2033
- Table 64: Israel Fall Detection Wearable Devices Volume (K) Forecast, by Application 2020 & 2033
- Table 65: GCC Fall Detection Wearable Devices Revenue (million) Forecast, by Application 2020 & 2033
- Table 66: GCC Fall Detection Wearable Devices Volume (K) Forecast, by Application 2020 & 2033
- Table 67: North Africa Fall Detection Wearable Devices Revenue (million) Forecast, by Application 2020 & 2033
- Table 68: North Africa Fall Detection Wearable Devices Volume (K) Forecast, by Application 2020 & 2033
- Table 69: South Africa Fall Detection Wearable Devices Revenue (million) Forecast, by Application 2020 & 2033
- Table 70: South Africa Fall Detection Wearable Devices Volume (K) Forecast, by Application 2020 & 2033
- Table 71: Rest of Middle East & Africa Fall Detection Wearable Devices Revenue (million) Forecast, by Application 2020 & 2033
- Table 72: Rest of Middle East & Africa Fall Detection Wearable Devices Volume (K) Forecast, by Application 2020 & 2033
- Table 73: Global Fall Detection Wearable Devices Revenue million Forecast, by Application 2020 & 2033
- Table 74: Global Fall Detection Wearable Devices Volume K Forecast, by Application 2020 & 2033
- Table 75: Global Fall Detection Wearable Devices Revenue million Forecast, by Types 2020 & 2033
- Table 76: Global Fall Detection Wearable Devices Volume K Forecast, by Types 2020 & 2033
- Table 77: Global Fall Detection Wearable Devices Revenue million Forecast, by Country 2020 & 2033
- Table 78: Global Fall Detection Wearable Devices Volume K Forecast, by Country 2020 & 2033
- Table 79: China Fall Detection Wearable Devices Revenue (million) Forecast, by Application 2020 & 2033
- Table 80: China Fall Detection Wearable Devices Volume (K) Forecast, by Application 2020 & 2033
- Table 81: India Fall Detection Wearable Devices Revenue (million) Forecast, by Application 2020 & 2033
- Table 82: India Fall Detection Wearable Devices Volume (K) Forecast, by Application 2020 & 2033
- Table 83: Japan Fall Detection Wearable Devices Revenue (million) Forecast, by Application 2020 & 2033
- Table 84: Japan Fall Detection Wearable Devices Volume (K) Forecast, by Application 2020 & 2033
- Table 85: South Korea Fall Detection Wearable Devices Revenue (million) Forecast, by Application 2020 & 2033
- Table 86: South Korea Fall Detection Wearable Devices Volume (K) Forecast, by Application 2020 & 2033
- Table 87: ASEAN Fall Detection Wearable Devices Revenue (million) Forecast, by Application 2020 & 2033
- Table 88: ASEAN Fall Detection Wearable Devices Volume (K) Forecast, by Application 2020 & 2033
- Table 89: Oceania Fall Detection Wearable Devices Revenue (million) Forecast, by Application 2020 & 2033
- Table 90: Oceania Fall Detection Wearable Devices Volume (K) Forecast, by Application 2020 & 2033
- Table 91: Rest of Asia Pacific Fall Detection Wearable Devices Revenue (million) Forecast, by Application 2020 & 2033
- Table 92: Rest of Asia Pacific Fall Detection Wearable Devices Volume (K) Forecast, by Application 2020 & 2033
Frequently Asked Questions
1. What is the projected Compound Annual Growth Rate (CAGR) of the Fall Detection Wearable Devices?
The projected CAGR is approximately XX%.
2. Which companies are prominent players in the Fall Detection Wearable Devices?
Key companies in the market include Medical Guardian, Lively, Bay Alarm Medical, MobileHelp, MedicalAlert, Aloe Care Health, Tunstall Healthcare, SureSafe, GetSafe, Philips Lifeline.
3. What are the main segments of the Fall Detection Wearable Devices?
The market segments include Application, Types.
4. Can you provide details about the market size?
The market size is estimated to be USD XXX million as of 2022.
5. What are some drivers contributing to market growth?
N/A
6. What are the notable trends driving market growth?
N/A
7. Are there any restraints impacting market growth?
N/A
8. Can you provide examples of recent developments in the market?
N/A
9. What pricing options are available for accessing the report?
Pricing options include single-user, multi-user, and enterprise licenses priced at USD 3350.00, USD 5025.00, and USD 6700.00 respectively.
10. Is the market size provided in terms of value or volume?
The market size is provided in terms of value, measured in million and volume, measured in K.
11. Are there any specific market keywords associated with the report?
Yes, the market keyword associated with the report is "Fall Detection Wearable Devices," which aids in identifying and referencing the specific market segment covered.
12. How do I determine which pricing option suits my needs best?
The pricing options vary based on user requirements and access needs. Individual users may opt for single-user licenses, while businesses requiring broader access may choose multi-user or enterprise licenses for cost-effective access to the report.
13. Are there any additional resources or data provided in the Fall Detection Wearable Devices report?
While the report offers comprehensive insights, it's advisable to review the specific contents or supplementary materials provided to ascertain if additional resources or data are available.
14. How can I stay updated on further developments or reports in the Fall Detection Wearable Devices?
To stay informed about further developments, trends, and reports in the Fall Detection Wearable Devices, consider subscribing to industry newsletters, following relevant companies and organizations, or regularly checking reputable industry news sources and publications.
Methodology
Step 1 - Identification of Relevant Samples Size from Population Database


Step 2 - Approaches for Defining Global Market Size (Value, Volume* & Price*)

Note*: In applicable scenarios
Step 3 - Data Sources
Primary Research
- Web Analytics
- Survey Reports
- Research Institute
- Latest Research Reports
- Opinion Leaders
Secondary Research
- Annual Reports
- White Paper
- Latest Press Release
- Industry Association
- Paid Database
- Investor Presentations

Step 4 - Data Triangulation
Involves using different sources of information in order to increase the validity of a study
These sources are likely to be stakeholders in a program - participants, other researchers, program staff, other community members, and so on.
Then we put all data in single framework & apply various statistical tools to find out the dynamic on the market.
During the analysis stage, feedback from the stakeholder groups would be compared to determine areas of agreement as well as areas of divergence