

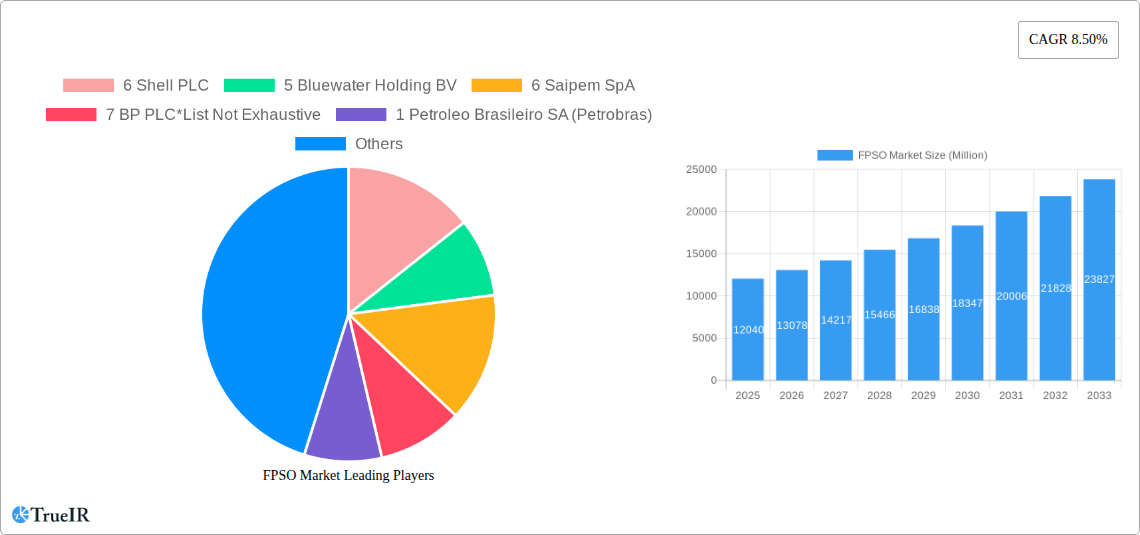
Key Insights
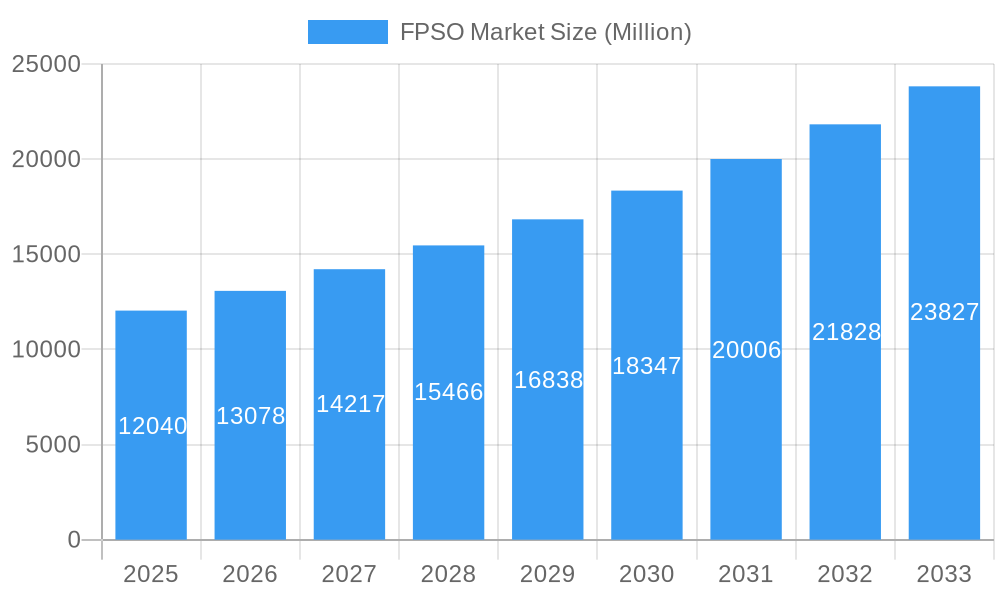
The global Floating Production Storage and Offloading (FPSO) market is experiencing robust growth, projected to reach an estimated USD 12.04 billion in 2025, with a Compound Annual Growth Rate (CAGR) of 8.50% through 2033. This expansion is primarily driven by the increasing demand for offshore oil and gas production, particularly in deep and ultra-deep water environments where FPSOs offer a cost-effective and flexible solution for hydrocarbon extraction. The ongoing exploration and development of new reserves, coupled with the need to revitalize mature fields, are significant tailwinds for the FPSO sector. Technological advancements, such as the development of more efficient and environmentally friendly FPSO designs, along with increasing investments in renewable energy integration onto FPSO units, are also shaping the market landscape. Furthermore, the strategic importance of energy security globally is prompting significant capital expenditure in offshore E&P projects, directly benefiting the FPSO market.
FPSO Market Market Size (In Billion)
Several key trends are influencing the trajectory of the FPSO market. The rise of mega-projects and the increasing complexity of offshore fields necessitate sophisticated FPSO solutions capable of handling higher production volumes and more challenging operating conditions. The growing emphasis on environmental regulations and sustainability is driving innovation in FPSO technologies, including solutions for emissions reduction and waste management. Geographically, regions like North America and Europe, with their established offshore infrastructure and ongoing exploration activities, are expected to remain key markets. Asia Pacific, with its burgeoning energy demand and expanding offshore exploration, presents significant growth opportunities. The market segmentation indicates a balanced demand across operator-owned and contractor-owned FPSOs, while the increasing focus on deep and ultra-deep water exploration suggests a growing preference for advanced FPSO capabilities in these challenging environments. Major players like Shell PLC, BP PLC, Saipem SpA, and SBM Offshore NV are actively involved in project execution and technological development, further shaping market dynamics.
FPSO Market Company Market Share
FPSO Market: Comprehensive Analysis and Future Outlook (2019-2033)
Report Description:
Unlock the full potential of the global Floating Production, Storage, and Offloading (FPSO) market with this in-depth analytical report. Spanning from 2019 to 2033, with a base year of 2025, this study provides critical insights into market dynamics, growth drivers, and emerging opportunities. Our comprehensive analysis covers the historical period (2019-2024) and extends through the forecast period (2025-2033), offering a detailed view of FPSO market size, trends, and competitive landscape. Essential for industry stakeholders including FPSO operators, FPSO contractors, and offshore E&P companies, this report leverages high-volume keywords such as "offshore oil and gas," "deepwater exploration," "FPSO technology," "floating production systems," and "subsea infrastructure" to optimize search rankings and attract industry professionals.
Explore market segmentation by Ownership (Operator-owned, Contractor-owned) and Water Depth (Shallow Water, Deep Water, Ultra-deep Water). Dive deep into industry developments, key players, and future projections, making informed strategic decisions in this vital sector of the energy industry.
FPSO Market Market Structure & Competitive Landscape
The FPSO market is characterized by a moderate to high level of concentration, primarily driven by the significant capital expenditure and technological expertise required for project execution. A few dominant FPSO contractors and major oil and gas operators command a substantial market share. Innovation drivers are largely focused on enhancing operational efficiency, increasing production capacity, and addressing environmental concerns, particularly in deepwater and ultra-deepwater environments. Regulatory impacts play a crucial role, with evolving environmental standards and safety regulations influencing design and operational requirements. Product substitutes are limited in deepwater applications where FPSOs offer unique economic and operational advantages. End-user segmentation reveals a strong reliance on major oil and gas companies, alongside national oil companies. Merger and acquisition (M&A) trends indicate strategic consolidation aimed at expanding technological capabilities, geographic reach, and project portfolios. For instance, an estimated 5-7 significant M&A activities have been recorded within the broader offshore E&P services sector annually over the historical period, impacting FPSO contractor consolidation. Concentration ratios, particularly among the top three FPSO contractors, are estimated to be around 60-70% of the global market value.
FPSO Market Market Trends & Opportunities
The global FPSO market is poised for robust growth, projected to achieve a Compound Annual Growth Rate (CAGR) of approximately 5-7% during the forecast period (2025-2033). This expansion is fueled by a confluence of factors, including increasing global energy demand, a strategic shift towards mature oil and gas fields requiring enhanced recovery, and the development of increasingly complex offshore reserves in deepwater and ultra-deepwater regions. Technological advancements are at the forefront, with a growing emphasis on digitalization, automation, and the integration of artificial intelligence for improved operational monitoring and predictive maintenance. This not only enhances safety and efficiency but also reduces operational costs, a critical factor for profitability. Consumer preferences are leaning towards more sustainable and environmentally friendly solutions, driving innovation in emissions reduction technologies and the adoption of cleaner energy sources alongside hydrocarbon production.
Competitive dynamics are evolving, with established players differentiating themselves through specialized technical expertise, integrated service offerings, and strategic partnerships. The increasing number of floating LNG (FLNG) and floating storage and regasification unit (FSRU) projects presents a significant diversification opportunity for FPSO providers, expanding their market penetration beyond traditional oil and gas production. The average market penetration rate for FPSOs in newly sanctioned deepwater projects is estimated to be over 75%. Opportunities also lie in the retrofitting and upgrading of existing FPSO units to extend their lifespan and improve their performance, thereby capitalizing on the extensive existing infrastructure. The development of smaller, modular FPSOs for marginal field developments is another emerging trend, catering to a broader range of project sizes and investment profiles. Market size growth is projected to reach an estimated USD 100,000 Million by 2033, up from approximately USD 50,000 Million in 2025.
Dominant Markets & Segments in FPSO Market
The Deep Water and Ultra-deep Water segments represent the dominant markets within the FPSO industry, driven by the increasing discovery and development of hydrocarbon reserves in these challenging offshore environments. Regions such as the Gulf of Mexico, West Africa, Brazil, and Southeast Asia are leading this expansion due to their substantial deepwater potential.
Deep Water: This segment continues to be a primary focus for FPSO deployment. Key growth drivers include:
- Technological Advancements: Innovations in subsea technology and drilling capabilities make deepwater exploration more feasible and cost-effective.
- Mature Onshore Reserves: Depleting onshore reserves are pushing exploration activities further offshore into deeper waters.
- Government Policies & Incentives: Favorable fiscal regimes and licensing rounds in deepwater provinces encourage investment.
- Infrastructure Development: Continued investment in subsea pipelines and infrastructure supports deepwater production.
Ultra-deep Water: While representing a smaller, more specialized segment, ultra-deep water development is crucial for unlocking some of the world's largest untapped reserves. Growth drivers include:
- High-Value Hydrocarbons: Discoveries in ultra-deep water often contain high-value crude oil and natural gas.
- Strategic Resource Acquisition: National and international oil companies are increasingly focusing on securing long-term resource bases.
- Technological Prowess: Companies with advanced technological capabilities are well-positioned to capitalize on ultra-deepwater projects.
Ownership Segmentation:
- Operator-owned FPSOs: Major oil and gas operators often opt for ownership to maintain greater control over their assets and production profiles. This segment is significant in large-scale, long-term projects.
- Contractor-owned FPSOs: FPSO contractors offer leased units, providing flexible and capital-efficient solutions for E&P companies. This model is prevalent for smaller to medium-sized projects and for companies seeking to reduce upfront investment.
The dominance of deepwater and ultra-deepwater applications is directly linked to the economic viability of extracting hydrocarbons from increasingly remote and challenging subsea reservoirs. The technical expertise and specialized infrastructure required for these depths make FPSOs the preferred solution. Market share for deepwater FPSO projects is estimated to be around 65%, with ultra-deepwater accounting for 25%, and shallow water the remaining 10%.
FPSO Market Product Analysis
FPSO units are sophisticated floating vessels designed for the production, storage, and offloading of hydrocarbons. Key product innovations focus on modularity, improved efficiency, and environmental performance, enabling operations in increasingly challenging water depths and remote locations. Their competitive advantage lies in their flexibility, reduced infrastructure requirements compared to fixed platforms, and suitability for marginal fields and deepwater exploration. Technological advancements include enhanced turret systems for turret-moored FPSOs, advanced topside processing modules, and integrated digital solutions for real-time monitoring and control. Applications span from early production systems to full-field development, including oil, gas, and condensate production.
Key Drivers, Barriers & Challenges in FPSO Market
Key Drivers:
- Growing Global Energy Demand: The persistent need for oil and gas fuels exploration and production activities, necessitating advanced offshore solutions like FPSOs.
- Deepwater and Ultra-Deepwater Discoveries: The increasing identification of hydrocarbon reserves in challenging offshore environments drives demand for FPSO technology.
- Technological Advancements: Innovations in FPSO design, subsea technology, and digital solutions enhance efficiency, safety, and cost-effectiveness.
- Extended Field Life and Enhanced Oil Recovery (EOR): FPSOs are crucial for monetizing mature fields and implementing EOR strategies.
- Favorable Government Policies and Incentives: Licensing rounds and fiscal regimes in key offshore regions encourage investment in FPSO projects.
Barriers & Challenges:
- High Capital Expenditure: The significant upfront investment required for FPSO projects can be a barrier, especially for smaller E&P companies.
- Volatile Oil and Gas Prices: Fluctuations in commodity prices can impact project economics and investment decisions, leading to project delays or cancellations.
- Complex Regulatory Environment: Stringent environmental, health, and safety regulations, along with varying national requirements, can add complexity and cost.
- Supply Chain Constraints: The global nature of FPSO projects can lead to challenges in securing specialized equipment and skilled labor.
- Environmental Concerns and Public Perception: Increasing scrutiny over offshore activities and potential environmental impacts necessitate robust mitigation strategies and public engagement. The cost impact of stringent environmental regulations is estimated to add 5-10% to project costs.
Growth Drivers in the FPSO Market Market
The FPSO market's growth is predominantly propelled by the relentless global demand for energy, coupled with the strategic necessity to tap into vast, yet challenging, deepwater and ultra-deepwater hydrocarbon reserves. Technological innovations are playing a pivotal role, with advancements in subsea technologies, digitalization, and automation significantly enhancing operational efficiency and reducing costs. Furthermore, government initiatives, including favorable licensing rounds and fiscal incentives in key offshore basins, are spurring significant investment in new FPSO projects. The drive for enhanced oil recovery (EOR) from mature offshore fields also presents a substantial growth avenue, as FPSOs offer a flexible and efficient solution for extended production.
Challenges Impacting FPSO Market Growth
The FPSO market faces several critical challenges that can impede its growth trajectory. The substantial capital intensity inherent in FPSO projects presents a significant barrier, particularly in periods of volatile oil prices that can affect project economics and investment decisions. Navigating the complex and often country-specific regulatory landscapes, especially concerning environmental and safety standards, adds layers of complexity and cost to project execution. Furthermore, the globalized nature of FPSO supply chains can lead to potential bottlenecks, impacting project timelines and the availability of specialized equipment and skilled personnel. Intense competition among FPSO contractors can also pressure profit margins, necessitating a constant focus on cost optimization and service differentiation. The estimated cost impact of supply chain disruptions can range from 3-8% on project budgets.
Key Players Shaping the FPSO Market Market
- SBM Offshore NV
- Modec Inc
- BW Offshore Limited
- Teekay Offshore Partners LP
- Bluewater Holding BV
- Saipem SpA
- Petrofac Limited
- Shell PLC
- BP PLC
- Chevron Corporation
- ExxonMobil Corp
- TotalEnergies SE
- Petroleo Brasileiro SA (Petrobras)
- CNOOC Ltd
Significant FPSO Market Industry Milestones
- May 2023: SBM Offshore and Esso Exploration & Production Guyana entered a 10-year Operations and Maintenance Enabling Agreement, solidifying SBM Offshore's role in operating and maintaining four key FPSOs: Liza Destiny, Liza Unity, Prosperity, and ONE GUYANA, demonstrating long-term commitment and operational expertise.
- April 2023: Shell resumed operations at the Pierce field in the United Kingdom Central North Sea following a major upgrade to enable gas production, highlighting the adaptability and modernization of FPSO units like the Haewene Brim vessel for dual production capabilities and integration with existing pipeline infrastructure.
- April 2023: KBR secured an engineering contract for Equinor's Bay du Nord project, valued at USD 9.4 billion, emphasizing the significant project pipeline and the extensive engineering and procurement services required for the development of new FPSO units in complex offshore regions like Eastern Canada.
Future Outlook for FPSO Market Market
The future outlook for the FPSO market remains exceptionally positive, driven by sustained global energy demand and the ongoing exploration and development of deepwater and ultra-deepwater resources. Strategic opportunities lie in the increasing demand for floating LNG (FLNG) and floating storage and regasification unit (FSRU) solutions, offering diversification for FPSO providers. Continued technological innovation, particularly in areas of digitalization, automation, and environmental sustainability, will be crucial for maintaining competitive advantage and meeting evolving industry standards. Collaboration and partnerships between FPSO contractors and oil and gas operators will be key to unlocking complex projects and navigating the challenging offshore landscape. The market is expected to witness sustained investment in new builds, alongside a growing trend in the life extension and upgrading of existing FPSO assets.
FPSO Market Segmentation
-
1. Ownership
- 1.1. Operator-owned
- 1.2. Contractor-owned
-
2. Water Depth
- 2.1. Shallow Water
- 2.2. Deep Water
- 2.3. Ultra-deep Water
FPSO Market Segmentation By Geography
-
1. North America
- 1.1. United States
- 1.2. Canada
- 1.3. Mexico
- 1.4. Rest of North America
-
2. Europe
- 2.1. Norway
- 2.2. United Kingdom
- 2.3. Russia
- 2.4. Netherland
- 2.5. France
- 2.6. Italy
- 2.7. NORDIC
- 2.8. Germany
- 2.9. Spain
- 2.10. Rest of Europe
-
3. Asia Pacific
- 3.1. China
- 3.2. India
- 3.3. Australia
- 3.4. Indonesia
- 3.5. Malaysia
- 3.6. Thailand
- 3.7. Japan
- 3.8. Vietnam
- 3.9. Rest of Asia Pacific
-
4. South America
- 4.1. Brazil
- 4.2. Argentina
- 4.3. Venezuela
- 4.4. Colombia
- 4.5. Rest of South America
-
5. Middle East and Africa
- 5.1. Saudi Arabia
- 5.2. United Arab Emirates
- 5.3. Nigeria
- 5.4. Algeria
- 5.5. Qatar
- 5.6. South Africa
- 5.7. Egypt
- 5.8. Rest of Middle East and Africa
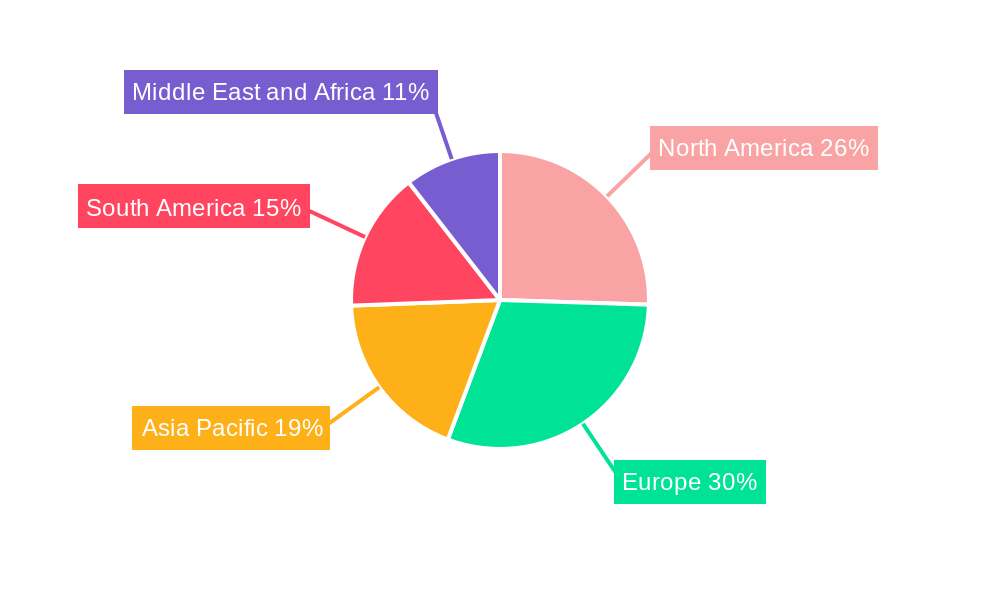
FPSO Market Regional Market Share
Geographic Coverage of FPSO Market
FPSO Market REPORT HIGHLIGHTS
| Aspects | Details |
|---|---|
| Study Period | 2020-2034 |
| Base Year | 2025 |
| Estimated Year | 2026 |
| Forecast Period | 2026-2034 |
| Historical Period | 2020-2025 |
| Growth Rate | CAGR of 8.50% from 2020-2034 |
| Segmentation |
|
Table of Contents
- 1. Introduction
- 1.1. Research Scope
- 1.2. Market Segmentation
- 1.3. Research Objective
- 1.4. Definitions and Assumptions
- 2. Executive Summary
- 2.1. Market Snapshot
- 3. Market Dynamics
- 3.1. Market Drivers
- 3.2. Market Restrains
- 3.3. Market Trends
- 3.4. Market Opportunities
- 4. Market Factor Analysis
- 4.1. Porters Five Forces
- 4.1.1. Bargaining Power of Suppliers
- 4.1.2. Bargaining Power of Buyers
- 4.1.3. Threat of New Entrants
- 4.1.4. Threat of Substitutes
- 4.1.5. Competitive Rivalry
- 4.2. PESTEL analysis
- 4.3. BCG Analysis
- 4.3.1. Stars (High Growth, High Market Share)
- 4.3.2. Cash Cows (Low Growth, High Market Share)
- 4.3.3. Question Mark (High Growth, Low Market Share)
- 4.3.4. Dogs (Low Growth, Low Market Share)
- 4.4. Ansoff Matrix Analysis
- 4.5. Supply Chain Analysis
- 4.6. Regulatory Landscape
- 4.7. Current Market Potential and Opportunity Assessment (TAM–SAM–SOM Framework)
- 4.8. TIR Analyst Note
- 4.1. Porters Five Forces
- 5. Market Analysis, Insights and Forecast 2021-2033
- 5.1. Market Analysis, Insights and Forecast - by Ownership
- 5.1.1. Operator-owned
- 5.1.2. Contractor-owned
- 5.2. Market Analysis, Insights and Forecast - by Water Depth
- 5.2.1. Shallow Water
- 5.2.2. Deep Water
- 5.2.3. Ultra-deep Water
- 5.3. Market Analysis, Insights and Forecast - by Region
- 5.3.1. North America
- 5.3.2. Europe
- 5.3.3. Asia Pacific
- 5.3.4. South America
- 5.3.5. Middle East and Africa
- 5.1. Market Analysis, Insights and Forecast - by Ownership
- 6. Global FPSO Market Analysis, Insights and Forecast, 2021-2033
- 6.1. Market Analysis, Insights and Forecast - by Ownership
- 6.1.1. Operator-owned
- 6.1.2. Contractor-owned
- 6.2. Market Analysis, Insights and Forecast - by Water Depth
- 6.2.1. Shallow Water
- 6.2.2. Deep Water
- 6.2.3. Ultra-deep Water
- 6.1. Market Analysis, Insights and Forecast - by Ownership
- 7. North America FPSO Market Analysis, Insights and Forecast, 2020-2032
- 7.1. Market Analysis, Insights and Forecast - by Ownership
- 7.1.1. Operator-owned
- 7.1.2. Contractor-owned
- 7.2. Market Analysis, Insights and Forecast - by Water Depth
- 7.2.1. Shallow Water
- 7.2.2. Deep Water
- 7.2.3. Ultra-deep Water
- 7.1. Market Analysis, Insights and Forecast - by Ownership
- 8. Europe FPSO Market Analysis, Insights and Forecast, 2020-2032
- 8.1. Market Analysis, Insights and Forecast - by Ownership
- 8.1.1. Operator-owned
- 8.1.2. Contractor-owned
- 8.2. Market Analysis, Insights and Forecast - by Water Depth
- 8.2.1. Shallow Water
- 8.2.2. Deep Water
- 8.2.3. Ultra-deep Water
- 8.1. Market Analysis, Insights and Forecast - by Ownership
- 9. Asia Pacific FPSO Market Analysis, Insights and Forecast, 2020-2032
- 9.1. Market Analysis, Insights and Forecast - by Ownership
- 9.1.1. Operator-owned
- 9.1.2. Contractor-owned
- 9.2. Market Analysis, Insights and Forecast - by Water Depth
- 9.2.1. Shallow Water
- 9.2.2. Deep Water
- 9.2.3. Ultra-deep Water
- 9.1. Market Analysis, Insights and Forecast - by Ownership
- 10. South America FPSO Market Analysis, Insights and Forecast, 2020-2032
- 10.1. Market Analysis, Insights and Forecast - by Ownership
- 10.1.1. Operator-owned
- 10.1.2. Contractor-owned
- 10.2. Market Analysis, Insights and Forecast - by Water Depth
- 10.2.1. Shallow Water
- 10.2.2. Deep Water
- 10.2.3. Ultra-deep Water
- 10.1. Market Analysis, Insights and Forecast - by Ownership
- 11. Middle East and Africa FPSO Market Analysis, Insights and Forecast, 2020-2032
- 11.1. Market Analysis, Insights and Forecast - by Ownership
- 11.1.1. Operator-owned
- 11.1.2. Contractor-owned
- 11.2. Market Analysis, Insights and Forecast - by Water Depth
- 11.2.1. Shallow Water
- 11.2.2. Deep Water
- 11.2.3. Ultra-deep Water
- 11.1. Market Analysis, Insights and Forecast - by Ownership
- 12. Competitive Analysis
- 12.1. Company Profiles
- 12.1.1 6 Shell PLC
- 12.1.1.1. Company Overview
- 12.1.1.2. Products
- 12.1.1.3. Company Financials
- 12.1.1.4. SWOT Analysis
- 12.1.2 5 Bluewater Holding BV
- 12.1.2.1. Company Overview
- 12.1.2.2. Products
- 12.1.2.3. Company Financials
- 12.1.2.4. SWOT Analysis
- 12.1.3 6 Saipem SpA
- 12.1.3.1. Company Overview
- 12.1.3.2. Products
- 12.1.3.3. Company Financials
- 12.1.3.4. SWOT Analysis
- 12.1.4 7 BP PLC*List Not Exhaustive
- 12.1.4.1. Company Overview
- 12.1.4.2. Products
- 12.1.4.3. Company Financials
- 12.1.4.4. SWOT Analysis
- 12.1.5 1 Petroleo Brasileiro SA (Petrobras)
- 12.1.5.1. Company Overview
- 12.1.5.2. Products
- 12.1.5.3. Company Financials
- 12.1.5.4. SWOT Analysis
- 12.1.6 4 Teekay Offshore Partners LP
- 12.1.6.1. Company Overview
- 12.1.6.2. Products
- 12.1.6.3. Company Financials
- 12.1.6.4. SWOT Analysis
- 12.1.7 5 Chevron Corporation
- 12.1.7.1. Company Overview
- 12.1.7.2. Products
- 12.1.7.3. Company Financials
- 12.1.7.4. SWOT Analysis
- 12.1.8 3 TotalEnergies SE
- 12.1.8.1. Company Overview
- 12.1.8.2. Products
- 12.1.8.3. Company Financials
- 12.1.8.4. SWOT Analysis
- 12.1.9 7 Petrofac Limited
- 12.1.9.1. Company Overview
- 12.1.9.2. Products
- 12.1.9.3. Company Financials
- 12.1.9.4. SWOT Analysis
- 12.1.10 4 ExxonMobil Corp
- 12.1.10.1. Company Overview
- 12.1.10.2. Products
- 12.1.10.3. Company Financials
- 12.1.10.4. SWOT Analysis
- 12.1.11 1 Modec Inc
- 12.1.11.1. Company Overview
- 12.1.11.2. Products
- 12.1.11.3. Company Financials
- 12.1.11.4. SWOT Analysis
- 12.1.12 3 BW Offshore Limited
- 12.1.12.1. Company Overview
- 12.1.12.2. Products
- 12.1.12.3. Company Financials
- 12.1.12.4. SWOT Analysis
- 12.1.13 FPSO Operators
- 12.1.13.1. Company Overview
- 12.1.13.2. Products
- 12.1.13.3. Company Financials
- 12.1.13.4. SWOT Analysis
- 12.1.14 2 SBM Offshore NV
- 12.1.14.1. Company Overview
- 12.1.14.2. Products
- 12.1.14.3. Company Financials
- 12.1.14.4. SWOT Analysis
- 12.1.15 2 CNOOC Ltd
- 12.1.15.1. Company Overview
- 12.1.15.2. Products
- 12.1.15.3. Company Financials
- 12.1.15.4. SWOT Analysis
- 12.1.16 FPSO Contractors
- 12.1.16.1. Company Overview
- 12.1.16.2. Products
- 12.1.16.3. Company Financials
- 12.1.16.4. SWOT Analysis
- 12.1.1 6 Shell PLC
- 12.2. Market Entropy
- 12.2.1 Company's Key Areas Served
- 12.2.2 Recent Developments
- 12.3. Company Market Share Analysis 2025
- 12.3.1 Top 5 Companies Market Share Analysis
- 12.3.2 Top 3 Companies Market Share Analysis
- 12.4. List of Potential Customers
- 13. Research Methodology
List of Figures
- Figure 1: Global FPSO Market Revenue Breakdown (Million, %) by Region 2025 & 2033
- Figure 2: North America FPSO Market Revenue (Million), by Ownership 2025 & 2033
- Figure 3: North America FPSO Market Revenue Share (%), by Ownership 2025 & 2033
- Figure 4: North America FPSO Market Revenue (Million), by Water Depth 2025 & 2033
- Figure 5: North America FPSO Market Revenue Share (%), by Water Depth 2025 & 2033
- Figure 6: North America FPSO Market Revenue (Million), by Country 2025 & 2033
- Figure 7: North America FPSO Market Revenue Share (%), by Country 2025 & 2033
- Figure 8: Europe FPSO Market Revenue (Million), by Ownership 2025 & 2033
- Figure 9: Europe FPSO Market Revenue Share (%), by Ownership 2025 & 2033
- Figure 10: Europe FPSO Market Revenue (Million), by Water Depth 2025 & 2033
- Figure 11: Europe FPSO Market Revenue Share (%), by Water Depth 2025 & 2033
- Figure 12: Europe FPSO Market Revenue (Million), by Country 2025 & 2033
- Figure 13: Europe FPSO Market Revenue Share (%), by Country 2025 & 2033
- Figure 14: Asia Pacific FPSO Market Revenue (Million), by Ownership 2025 & 2033
- Figure 15: Asia Pacific FPSO Market Revenue Share (%), by Ownership 2025 & 2033
- Figure 16: Asia Pacific FPSO Market Revenue (Million), by Water Depth 2025 & 2033
- Figure 17: Asia Pacific FPSO Market Revenue Share (%), by Water Depth 2025 & 2033
- Figure 18: Asia Pacific FPSO Market Revenue (Million), by Country 2025 & 2033
- Figure 19: Asia Pacific FPSO Market Revenue Share (%), by Country 2025 & 2033
- Figure 20: South America FPSO Market Revenue (Million), by Ownership 2025 & 2033
- Figure 21: South America FPSO Market Revenue Share (%), by Ownership 2025 & 2033
- Figure 22: South America FPSO Market Revenue (Million), by Water Depth 2025 & 2033
- Figure 23: South America FPSO Market Revenue Share (%), by Water Depth 2025 & 2033
- Figure 24: South America FPSO Market Revenue (Million), by Country 2025 & 2033
- Figure 25: South America FPSO Market Revenue Share (%), by Country 2025 & 2033
- Figure 26: Middle East and Africa FPSO Market Revenue (Million), by Ownership 2025 & 2033
- Figure 27: Middle East and Africa FPSO Market Revenue Share (%), by Ownership 2025 & 2033
- Figure 28: Middle East and Africa FPSO Market Revenue (Million), by Water Depth 2025 & 2033
- Figure 29: Middle East and Africa FPSO Market Revenue Share (%), by Water Depth 2025 & 2033
- Figure 30: Middle East and Africa FPSO Market Revenue (Million), by Country 2025 & 2033
- Figure 31: Middle East and Africa FPSO Market Revenue Share (%), by Country 2025 & 2033
List of Tables
- Table 1: Global FPSO Market Revenue Million Forecast, by Ownership 2020 & 2033
- Table 2: Global FPSO Market Revenue Million Forecast, by Water Depth 2020 & 2033
- Table 3: Global FPSO Market Revenue Million Forecast, by Region 2020 & 2033
- Table 4: Global FPSO Market Revenue Million Forecast, by Ownership 2020 & 2033
- Table 5: Global FPSO Market Revenue Million Forecast, by Water Depth 2020 & 2033
- Table 6: Global FPSO Market Revenue Million Forecast, by Country 2020 & 2033
- Table 7: United States FPSO Market Revenue (Million) Forecast, by Application 2020 & 2033
- Table 8: Canada FPSO Market Revenue (Million) Forecast, by Application 2020 & 2033
- Table 9: Mexico FPSO Market Revenue (Million) Forecast, by Application 2020 & 2033
- Table 10: Rest of North America FPSO Market Revenue (Million) Forecast, by Application 2020 & 2033
- Table 11: Global FPSO Market Revenue Million Forecast, by Ownership 2020 & 2033
- Table 12: Global FPSO Market Revenue Million Forecast, by Water Depth 2020 & 2033
- Table 13: Global FPSO Market Revenue Million Forecast, by Country 2020 & 2033
- Table 14: Norway FPSO Market Revenue (Million) Forecast, by Application 2020 & 2033
- Table 15: United Kingdom FPSO Market Revenue (Million) Forecast, by Application 2020 & 2033
- Table 16: Russia FPSO Market Revenue (Million) Forecast, by Application 2020 & 2033
- Table 17: Netherland FPSO Market Revenue (Million) Forecast, by Application 2020 & 2033
- Table 18: France FPSO Market Revenue (Million) Forecast, by Application 2020 & 2033
- Table 19: Italy FPSO Market Revenue (Million) Forecast, by Application 2020 & 2033
- Table 20: NORDIC FPSO Market Revenue (Million) Forecast, by Application 2020 & 2033
- Table 21: Germany FPSO Market Revenue (Million) Forecast, by Application 2020 & 2033
- Table 22: Spain FPSO Market Revenue (Million) Forecast, by Application 2020 & 2033
- Table 23: Rest of Europe FPSO Market Revenue (Million) Forecast, by Application 2020 & 2033
- Table 24: Global FPSO Market Revenue Million Forecast, by Ownership 2020 & 2033
- Table 25: Global FPSO Market Revenue Million Forecast, by Water Depth 2020 & 2033
- Table 26: Global FPSO Market Revenue Million Forecast, by Country 2020 & 2033
- Table 27: China FPSO Market Revenue (Million) Forecast, by Application 2020 & 2033
- Table 28: India FPSO Market Revenue (Million) Forecast, by Application 2020 & 2033
- Table 29: Australia FPSO Market Revenue (Million) Forecast, by Application 2020 & 2033
- Table 30: Indonesia FPSO Market Revenue (Million) Forecast, by Application 2020 & 2033
- Table 31: Malaysia FPSO Market Revenue (Million) Forecast, by Application 2020 & 2033
- Table 32: Thailand FPSO Market Revenue (Million) Forecast, by Application 2020 & 2033
- Table 33: Japan FPSO Market Revenue (Million) Forecast, by Application 2020 & 2033
- Table 34: Vietnam FPSO Market Revenue (Million) Forecast, by Application 2020 & 2033
- Table 35: Rest of Asia Pacific FPSO Market Revenue (Million) Forecast, by Application 2020 & 2033
- Table 36: Global FPSO Market Revenue Million Forecast, by Ownership 2020 & 2033
- Table 37: Global FPSO Market Revenue Million Forecast, by Water Depth 2020 & 2033
- Table 38: Global FPSO Market Revenue Million Forecast, by Country 2020 & 2033
- Table 39: Brazil FPSO Market Revenue (Million) Forecast, by Application 2020 & 2033
- Table 40: Argentina FPSO Market Revenue (Million) Forecast, by Application 2020 & 2033
- Table 41: Venezuela FPSO Market Revenue (Million) Forecast, by Application 2020 & 2033
- Table 42: Colombia FPSO Market Revenue (Million) Forecast, by Application 2020 & 2033
- Table 43: Rest of South America FPSO Market Revenue (Million) Forecast, by Application 2020 & 2033
- Table 44: Global FPSO Market Revenue Million Forecast, by Ownership 2020 & 2033
- Table 45: Global FPSO Market Revenue Million Forecast, by Water Depth 2020 & 2033
- Table 46: Global FPSO Market Revenue Million Forecast, by Country 2020 & 2033
- Table 47: Saudi Arabia FPSO Market Revenue (Million) Forecast, by Application 2020 & 2033
- Table 48: United Arab Emirates FPSO Market Revenue (Million) Forecast, by Application 2020 & 2033
- Table 49: Nigeria FPSO Market Revenue (Million) Forecast, by Application 2020 & 2033
- Table 50: Algeria FPSO Market Revenue (Million) Forecast, by Application 2020 & 2033
- Table 51: Qatar FPSO Market Revenue (Million) Forecast, by Application 2020 & 2033
- Table 52: South Africa FPSO Market Revenue (Million) Forecast, by Application 2020 & 2033
- Table 53: Egypt FPSO Market Revenue (Million) Forecast, by Application 2020 & 2033
- Table 54: Rest of Middle East and Africa FPSO Market Revenue (Million) Forecast, by Application 2020 & 2033
Frequently Asked Questions
1. What is the projected Compound Annual Growth Rate (CAGR) of the FPSO Market?
The projected CAGR is approximately 8.50%.
2. Which companies are prominent players in the FPSO Market?
Key companies in the market include 6 Shell PLC, 5 Bluewater Holding BV, 6 Saipem SpA, 7 BP PLC*List Not Exhaustive, 1 Petroleo Brasileiro SA (Petrobras), 4 Teekay Offshore Partners LP, 5 Chevron Corporation, 3 TotalEnergies SE, 7 Petrofac Limited, 4 ExxonMobil Corp, 1 Modec Inc, 3 BW Offshore Limited, FPSO Operators, 2 SBM Offshore NV, 2 CNOOC Ltd, FPSO Contractors.
3. What are the main segments of the FPSO Market?
The market segments include Ownership, Water Depth.
4. Can you provide details about the market size?
The market size is estimated to be USD 12.04 Million as of 2022.
5. What are some drivers contributing to market growth?
4.; Increasing Offshore Oil and Gas Exploration and Production Activities4.; Growing Demand for Energy.
6. What are the notable trends driving market growth?
Contractor-owned FPSO Expected to Dominate the Market.
7. Are there any restraints impacting market growth?
4.; High Upfront Costs.
8. Can you provide examples of recent developments in the market?
May 2023: SBM Offshore and Esso Exploration & Production Guyana entered a 10-year Operations and Maintenance Enabling Agreement. The agreement entails SBM Offshore being responsible for the operations and maintenance of four FPSOs: Liza Destiny, Liza Unity, Prosperity, and ONE GUYANA.
9. What pricing options are available for accessing the report?
Pricing options include single-user, multi-user, and enterprise licenses priced at USD 4750, USD 5250, and USD 8750 respectively.
10. Is the market size provided in terms of value or volume?
The market size is provided in terms of value, measured in Million.
11. Are there any specific market keywords associated with the report?
Yes, the market keyword associated with the report is "FPSO Market," which aids in identifying and referencing the specific market segment covered.
12. How do I determine which pricing option suits my needs best?
The pricing options vary based on user requirements and access needs. Individual users may opt for single-user licenses, while businesses requiring broader access may choose multi-user or enterprise licenses for cost-effective access to the report.
13. Are there any additional resources or data provided in the FPSO Market report?
While the report offers comprehensive insights, it's advisable to review the specific contents or supplementary materials provided to ascertain if additional resources or data are available.
14. How can I stay updated on further developments or reports in the FPSO Market?
To stay informed about further developments, trends, and reports in the FPSO Market, consider subscribing to industry newsletters, following relevant companies and organizations, or regularly checking reputable industry news sources and publications.
Methodology
Step 1 - Identification of Relevant Samples Size from Population Database


Step 2 - Approaches for Defining Global Market Size (Value, Volume* & Price*)

Note*: In applicable scenarios
Step 3 - Data Sources
Primary Research
- Web Analytics
- Survey Reports
- Research Institute
- Latest Research Reports
- Opinion Leaders
Secondary Research
- Annual Reports
- White Paper
- Latest Press Release
- Industry Association
- Paid Database
- Investor Presentations

Step 4 - Data Triangulation
Involves using different sources of information in order to increase the validity of a study
These sources are likely to be stakeholders in a program - participants, other researchers, program staff, other community members, and so on.
Then we put all data in single framework & apply various statistical tools to find out the dynamic on the market.
During the analysis stage, feedback from the stakeholder groups would be compared to determine areas of agreement as well as areas of divergence