

Key Insights
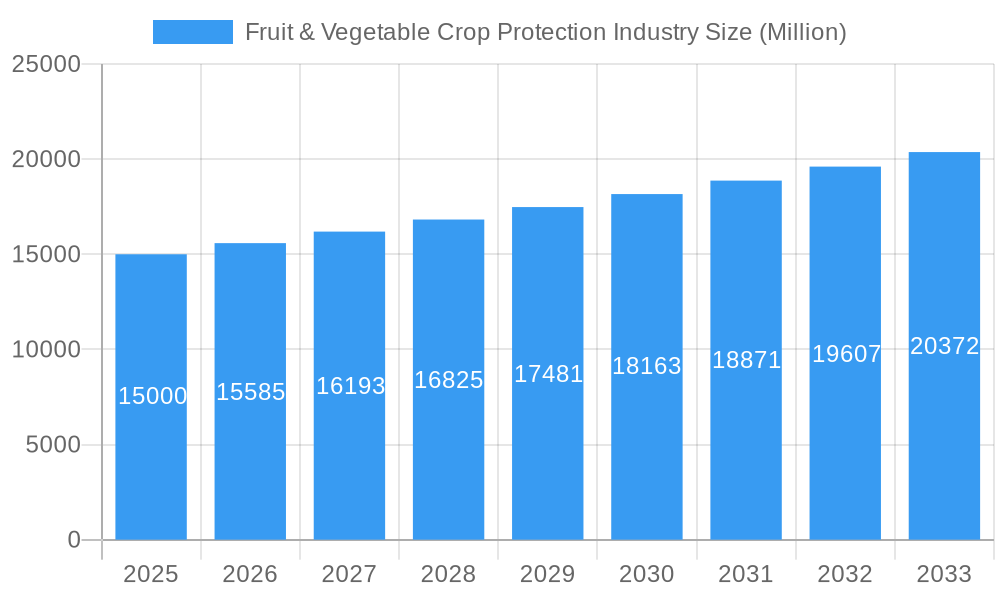
The global Fruit & Vegetable Crop Protection market, valued at approximately $13.28 billion in 2025, is projected for substantial growth. Driven by a Compound Annual Growth Rate (CAGR) of 15.15% from 2025 to 2033, this expansion is underpinned by several critical factors. Increasing global demand for fresh produce necessitates advanced crop protection methods to mitigate pest, disease, and weed impact, thereby optimizing yields and reducing losses. Concurrently, the heightened adoption of sustainable and bio-based crop protection solutions reflects a growing consumer preference for environmentally responsible agriculture, leading to an increased market share for bio-based products. Technological advancements in precision agriculture, such as targeted pesticide application and drone utilization, further contribute to market expansion by enhancing operational efficiency and minimizing ecological impact. However, market growth faces hurdles including stringent pesticide regulations, concerns over pesticide residues in food, and the emergence of pest resistance to current chemical treatments.
Fruit & Vegetable Crop Protection Industry Market Size (In Billion)
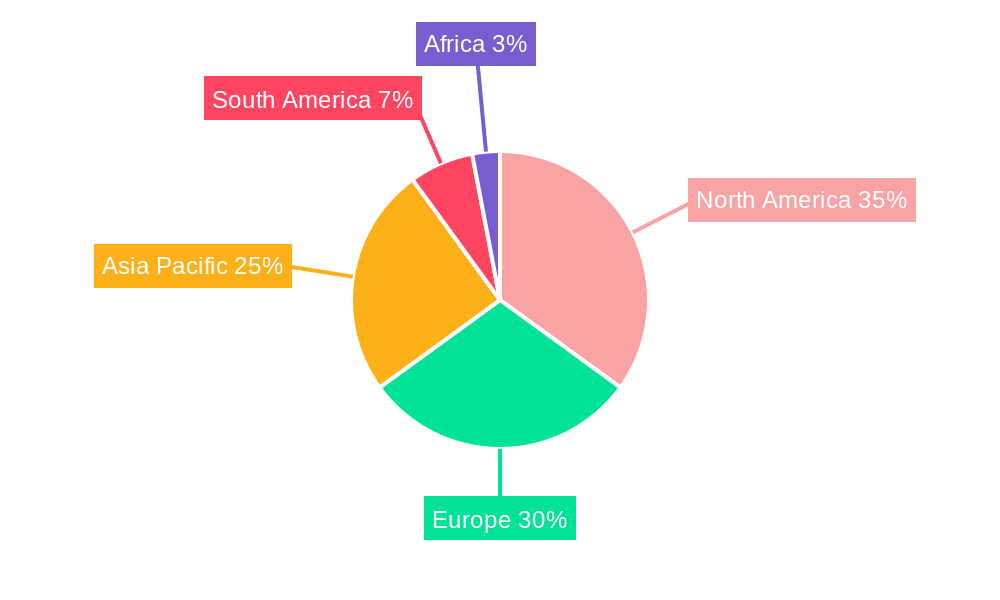
The market is segmented by origin (synthetic and bio-based) and product type (herbicides, fungicides, insecticides, and others). While the synthetic segment currently dominates, a discernible shift towards bio-based alternatives is underway, driven by environmental consciousness and consumer demand. Geographically, North America and Europe represent key markets, with the Asia-Pacific region anticipated to experience significant growth due to its expanding agricultural sector and rising food consumption.
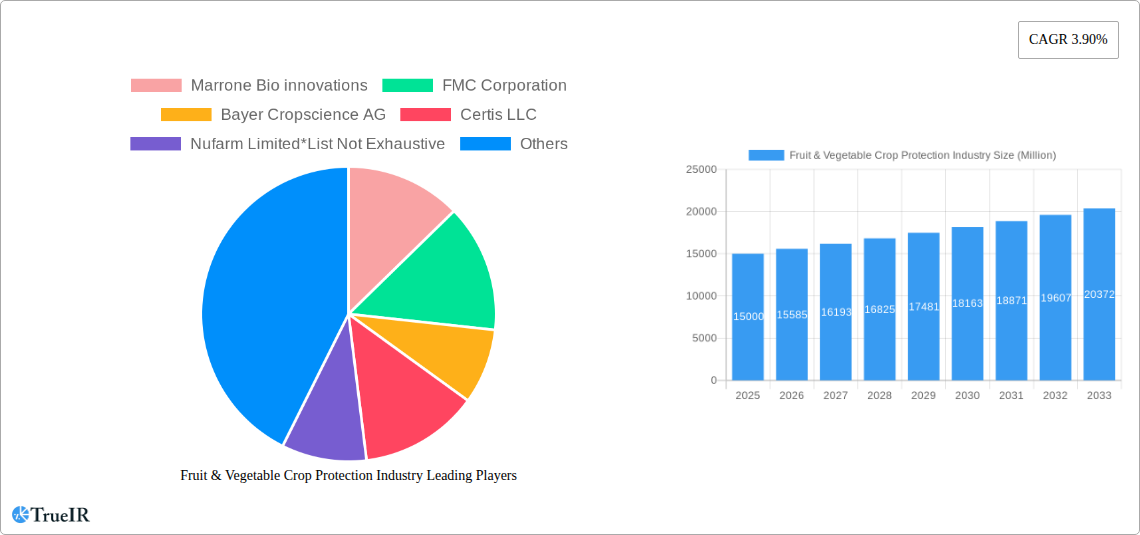
Fruit & Vegetable Crop Protection Industry Company Market Share
The competitive landscape features a blend of multinational corporations and niche providers. Prominent players such as Bayer Cropscience AG, Syngenta International AG, BASF SE, and FMC Corporation are heavily invested in research and development, creating innovative solutions tailored to industry evolution. Specialized companies, particularly those focused on bio-based solutions, are also gaining prominence. Market participants frequently employ strategic partnerships, mergers, and acquisitions to broaden product offerings and geographic presence. The 2025-2033 forecast period offers considerable growth opportunities, especially for companies delivering sustainable, effective, and eco-friendly crop protection solutions that satisfy both farmer needs and consumer expectations for safe, healthy food. Ongoing R&D efforts are expected to spur further innovation and market proliferation.
Fruit & Vegetable Crop Protection Industry Market Report: 2019-2033
This comprehensive report provides a detailed analysis of the Fruit & Vegetable Crop Protection industry, encompassing market size, growth projections, competitive landscape, and key trends from 2019 to 2033. The report leverages extensive market research and data analysis to deliver actionable insights for industry stakeholders, investors, and researchers. The study period covers 2019-2033, with 2025 serving as both the base and estimated year. The forecast period spans 2025-2033, and the historical period encompasses 2019-2024. The global market size is projected to reach xx Million by 2033.
Fruit & Vegetable Crop Protection Industry Market Structure & Competitive Landscape
The Fruit & Vegetable Crop Protection market is characterized by a moderately consolidated structure, with several multinational corporations holding significant market share. The industry's Herfindahl-Hirschman Index (HHI) is estimated at xx in 2025, indicating a moderately concentrated market. Innovation is a key driver, with companies continually developing new and improved products to meet evolving needs for sustainable and effective pest and disease control. Regulatory impacts vary significantly across regions, influencing the adoption of certain products and technologies. The increasing demand for organic and bio-based solutions presents a significant opportunity for product substitution. The end-user segmentation primarily comprises large-scale commercial farms, smallholder farms, and government agencies. Mergers and acquisitions (M&A) activity has been relatively high in recent years, with several large companies acquiring smaller players to expand their product portfolios and market reach. The total M&A volume in the period 2019-2024 was estimated at xx Million.
- Market Concentration: Moderately concentrated, with an HHI of xx (2025).
- Innovation Drivers: Demand for sustainable solutions, growing pest resistance, technological advancements.
- Regulatory Impacts: Vary significantly across regions, impacting product approvals and usage.
- Product Substitutes: Increasing demand for bio-based alternatives and integrated pest management (IPM) strategies.
- End-User Segmentation: Large-scale commercial farms, smallholder farms, government agencies.
- M&A Trends: Significant activity in recent years, driven by expansion and consolidation strategies.
Fruit & Vegetable Crop Protection Industry Market Trends & Opportunities
The Fruit & Vegetable Crop Protection market is experiencing robust growth, driven by factors such as increasing crop yields, expanding agricultural land, and rising consumer demand for fresh produce. The market size is projected to experience a Compound Annual Growth Rate (CAGR) of xx% during the forecast period (2025-2033), reaching xx Million by 2033. Technological advancements, particularly in precision agriculture and biopesticides, are revolutionizing crop protection strategies. Consumer preferences are shifting towards sustainably produced fruits and vegetables, increasing the demand for bio-based and environmentally friendly crop protection solutions. Intense competition is driving innovation and efficiency improvements throughout the value chain. Market penetration rates for bio-based products are steadily rising, with an estimated xx% market share in 2025. This growth is further fueled by increasing government support for sustainable agriculture and stricter regulations on synthetic pesticides.
Dominant Markets & Segments in Fruit & Vegetable Crop Protection Industry
The Asia-Pacific region is expected to dominate the fruit and vegetable crop protection market during the forecast period, driven by factors such as the large agricultural land area, increasing farming population, and rising food demand. North America and Europe also hold significant market shares. Within product types, the insecticides segment is currently the largest, followed by fungicides and herbicides. Bio-based products are experiencing the fastest growth rate, driven by increasing environmental concerns and consumer demand.
- Key Growth Drivers (Asia-Pacific): Expanding agricultural land, rising food demand, increasing government support for agriculture, growing adoption of modern farming techniques.
- Market Dominance: Asia-Pacific leads in terms of market size and growth rate, followed by North America and Europe.
- Segment Dominance: Insecticides represent the largest segment, followed by fungicides, herbicides, and other types. Bio-based products exhibit the fastest growth rate.
Fruit & Vegetable Crop Protection Industry Product Analysis
Significant advancements are observed in product formulation and delivery systems. Innovations focus on improved efficacy, reduced environmental impact, and enhanced target specificity. New generations of biopesticides are gaining market traction, offering effective pest and disease control with minimal environmental impact. The market's success depends upon technological advancements enabling precise application, mitigating risks to non-target organisms, and meeting stringent regulatory standards.
Key Drivers, Barriers & Challenges in Fruit & Vegetable Crop Protection Industry
Key Drivers: Rising global population and increasing demand for food, technological advancements in precision agriculture and biopesticides, increasing government support for sustainable agriculture, and stricter regulations on synthetic pesticides.
Challenges: Stringent regulatory approvals, supply chain disruptions impacting the availability of raw materials and active ingredients, and increasing competition from both established players and new entrants in the market. These challenges lead to increased costs and potentially limit market expansion.
Growth Drivers in the Fruit & Vegetable Crop Protection Industry Market
Technological advancements in biopesticides, precision agriculture, and drone technology are primary growth drivers. The increasing demand for organic and sustainable produce is also bolstering market growth. Government regulations and incentives towards sustainable farming practices contribute significantly.
Challenges Impacting Fruit & Vegetable Crop Protection Industry Growth
Regulatory hurdles associated with new product approvals and varying regulations across different geographies pose significant challenges. Supply chain vulnerabilities related to raw materials and active ingredients can cause production delays and price volatility. The increasing intensity of competition forces companies to invest heavily in R&D and marketing.
Key Players Shaping the Fruit & Vegetable Crop Protection Industry Market
- Marrone Bio Innovations
- FMC Corporation
- Bayer Cropscience AG
- Certis LLC
- Nufarm Limited
- Syngenta International AG
- AMVAC Chemical Corporation
- Isagro SpA
- UPL Limited
- Adama Agricultural Solutions
- Corteva Agriscience
- Koppert Biological Systems
- BASF SE
Significant Fruit & Vegetable Crop Protection Industry Industry Milestones
- 2020: Increased focus on biopesticide development by several key players.
- 2021: Launch of several new precision agriculture technologies.
- 2022: Significant M&A activity within the industry consolidating market share.
- 2023: Several new regulations related to pesticide usage introduced across various regions.
Future Outlook for Fruit & Vegetable Crop Protection Industry Market
The Fruit & Vegetable Crop Protection industry is poised for continued growth driven by several catalysts: a growing global population necessitating increased food production, ongoing technological advancements in crop protection strategies, and rising consumer demand for sustainably produced food. Strategic opportunities lie in expanding the biopesticide market segment and developing innovative precision agriculture solutions. The market's future hinges on navigating the complexities of environmental sustainability and meeting evolving regulatory standards.
Fruit & Vegetable Crop Protection Industry Segmentation
- 1. Production Analysis
- 2. Consumption Analysis
- 3. Import Market Analysis (Value & Volume)
- 4. Export Market Analysis (Value & Volume)
- 5. Price Trend Analysis
Fruit & Vegetable Crop Protection Industry Segmentation By Geography
-
1. North America
- 1.1. United States
- 1.2. Canada
- 1.3. Mexico
-
2. South America
- 2.1. Brazil
- 2.2. Argentina
- 2.3. Rest of South America
-
3. Europe
- 3.1. United Kingdom
- 3.2. Germany
- 3.3. France
- 3.4. Italy
- 3.5. Spain
- 3.6. Russia
- 3.7. Benelux
- 3.8. Nordics
- 3.9. Rest of Europe
-
4. Middle East & Africa
- 4.1. Turkey
- 4.2. Israel
- 4.3. GCC
- 4.4. North Africa
- 4.5. South Africa
- 4.6. Rest of Middle East & Africa
-
5. Asia Pacific
- 5.1. China
- 5.2. India
- 5.3. Japan
- 5.4. South Korea
- 5.5. ASEAN
- 5.6. Oceania
- 5.7. Rest of Asia Pacific
Fruit & Vegetable Crop Protection Industry Regional Market Share
Geographic Coverage of Fruit & Vegetable Crop Protection Industry
Fruit & Vegetable Crop Protection Industry REPORT HIGHLIGHTS
| Aspects | Details |
|---|---|
| Study Period | 2020-2034 |
| Base Year | 2025 |
| Estimated Year | 2026 |
| Forecast Period | 2026-2034 |
| Historical Period | 2020-2025 |
| Growth Rate | CAGR of 15.15% from 2020-2034 |
| Segmentation |
|
Table of Contents
- 1. Introduction
- 1.1. Research Scope
- 1.2. Market Segmentation
- 1.3. Research Objective
- 1.4. Definitions and Assumptions
- 2. Executive Summary
- 2.1. Market Snapshot
- 3. Market Dynamics
- 3.1. Market Drivers
- 3.2. Market Restrains
- 3.3. Market Trends
- 3.4. Market Opportunities
- 4. Market Factor Analysis
- 4.1. Porters Five Forces
- 4.1.1. Bargaining Power of Suppliers
- 4.1.2. Bargaining Power of Buyers
- 4.1.3. Threat of New Entrants
- 4.1.4. Threat of Substitutes
- 4.1.5. Competitive Rivalry
- 4.2. PESTEL analysis
- 4.3. BCG Analysis
- 4.3.1. Stars (High Growth, High Market Share)
- 4.3.2. Cash Cows (Low Growth, High Market Share)
- 4.3.3. Question Mark (High Growth, Low Market Share)
- 4.3.4. Dogs (Low Growth, Low Market Share)
- 4.4. Ansoff Matrix Analysis
- 4.5. Supply Chain Analysis
- 4.6. Regulatory Landscape
- 4.7. Current Market Potential and Opportunity Assessment (TAM–SAM–SOM Framework)
- 4.8. TIR Analyst Note
- 4.1. Porters Five Forces
- 5. Market Analysis, Insights and Forecast 2021-2033
- 5.1. Market Analysis, Insights and Forecast - by Production Analysis
- 5.2. Market Analysis, Insights and Forecast - by Consumption Analysis
- 5.3. Market Analysis, Insights and Forecast - by Import Market Analysis (Value & Volume)
- 5.4. Market Analysis, Insights and Forecast - by Export Market Analysis (Value & Volume)
- 5.5. Market Analysis, Insights and Forecast - by Price Trend Analysis
- 5.6. Market Analysis, Insights and Forecast - by Region
- 5.6.1. North America
- 5.6.2. South America
- 5.6.3. Europe
- 5.6.4. Middle East & Africa
- 5.6.5. Asia Pacific
- 6. Global Fruit & Vegetable Crop Protection Industry Analysis, Insights and Forecast, 2021-2033
- 6.1. Market Analysis, Insights and Forecast - by Production Analysis
- 6.2. Market Analysis, Insights and Forecast - by Consumption Analysis
- 6.3. Market Analysis, Insights and Forecast - by Import Market Analysis (Value & Volume)
- 6.4. Market Analysis, Insights and Forecast - by Export Market Analysis (Value & Volume)
- 6.5. Market Analysis, Insights and Forecast - by Price Trend Analysis
- 7. North America Fruit & Vegetable Crop Protection Industry Analysis, Insights and Forecast, 2020-2032
- 7.1. Market Analysis, Insights and Forecast - by Production Analysis
- 7.2. Market Analysis, Insights and Forecast - by Consumption Analysis
- 7.3. Market Analysis, Insights and Forecast - by Import Market Analysis (Value & Volume)
- 7.4. Market Analysis, Insights and Forecast - by Export Market Analysis (Value & Volume)
- 7.5. Market Analysis, Insights and Forecast - by Price Trend Analysis
- 8. South America Fruit & Vegetable Crop Protection Industry Analysis, Insights and Forecast, 2020-2032
- 8.1. Market Analysis, Insights and Forecast - by Production Analysis
- 8.2. Market Analysis, Insights and Forecast - by Consumption Analysis
- 8.3. Market Analysis, Insights and Forecast - by Import Market Analysis (Value & Volume)
- 8.4. Market Analysis, Insights and Forecast - by Export Market Analysis (Value & Volume)
- 8.5. Market Analysis, Insights and Forecast - by Price Trend Analysis
- 9. Europe Fruit & Vegetable Crop Protection Industry Analysis, Insights and Forecast, 2020-2032
- 9.1. Market Analysis, Insights and Forecast - by Production Analysis
- 9.2. Market Analysis, Insights and Forecast - by Consumption Analysis
- 9.3. Market Analysis, Insights and Forecast - by Import Market Analysis (Value & Volume)
- 9.4. Market Analysis, Insights and Forecast - by Export Market Analysis (Value & Volume)
- 9.5. Market Analysis, Insights and Forecast - by Price Trend Analysis
- 10. Middle East & Africa Fruit & Vegetable Crop Protection Industry Analysis, Insights and Forecast, 2020-2032
- 10.1. Market Analysis, Insights and Forecast - by Production Analysis
- 10.2. Market Analysis, Insights and Forecast - by Consumption Analysis
- 10.3. Market Analysis, Insights and Forecast - by Import Market Analysis (Value & Volume)
- 10.4. Market Analysis, Insights and Forecast - by Export Market Analysis (Value & Volume)
- 10.5. Market Analysis, Insights and Forecast - by Price Trend Analysis
- 11. Asia Pacific Fruit & Vegetable Crop Protection Industry Analysis, Insights and Forecast, 2020-2032
- 11.1. Market Analysis, Insights and Forecast - by Production Analysis
- 11.2. Market Analysis, Insights and Forecast - by Consumption Analysis
- 11.3. Market Analysis, Insights and Forecast - by Import Market Analysis (Value & Volume)
- 11.4. Market Analysis, Insights and Forecast - by Export Market Analysis (Value & Volume)
- 11.5. Market Analysis, Insights and Forecast - by Price Trend Analysis
- 12. Competitive Analysis
- 12.1. Company Profiles
- 12.1.1 Marrone Bio innovations
- 12.1.1.1. Company Overview
- 12.1.1.2. Products
- 12.1.1.3. Company Financials
- 12.1.1.4. SWOT Analysis
- 12.1.2 FMC Corporation
- 12.1.2.1. Company Overview
- 12.1.2.2. Products
- 12.1.2.3. Company Financials
- 12.1.2.4. SWOT Analysis
- 12.1.3 Bayer Cropscience AG
- 12.1.3.1. Company Overview
- 12.1.3.2. Products
- 12.1.3.3. Company Financials
- 12.1.3.4. SWOT Analysis
- 12.1.4 Certis LLC
- 12.1.4.1. Company Overview
- 12.1.4.2. Products
- 12.1.4.3. Company Financials
- 12.1.4.4. SWOT Analysis
- 12.1.5 Nufarm Limited*List Not Exhaustive
- 12.1.5.1. Company Overview
- 12.1.5.2. Products
- 12.1.5.3. Company Financials
- 12.1.5.4. SWOT Analysis
- 12.1.6 Syngenta International AG
- 12.1.6.1. Company Overview
- 12.1.6.2. Products
- 12.1.6.3. Company Financials
- 12.1.6.4. SWOT Analysis
- 12.1.7 AMVAC Chemical Corporation
- 12.1.7.1. Company Overview
- 12.1.7.2. Products
- 12.1.7.3. Company Financials
- 12.1.7.4. SWOT Analysis
- 12.1.8 Isagro SpA
- 12.1.8.1. Company Overview
- 12.1.8.2. Products
- 12.1.8.3. Company Financials
- 12.1.8.4. SWOT Analysis
- 12.1.9 UPL Limted
- 12.1.9.1. Company Overview
- 12.1.9.2. Products
- 12.1.9.3. Company Financials
- 12.1.9.4. SWOT Analysis
- 12.1.10 Adama Agricultural Solutions
- 12.1.10.1. Company Overview
- 12.1.10.2. Products
- 12.1.10.3. Company Financials
- 12.1.10.4. SWOT Analysis
- 12.1.11 Corteva Agriscience
- 12.1.11.1. Company Overview
- 12.1.11.2. Products
- 12.1.11.3. Company Financials
- 12.1.11.4. SWOT Analysis
- 12.1.12 Koppert Biological Systems
- 12.1.12.1. Company Overview
- 12.1.12.2. Products
- 12.1.12.3. Company Financials
- 12.1.12.4. SWOT Analysis
- 12.1.13 BASF SE
- 12.1.13.1. Company Overview
- 12.1.13.2. Products
- 12.1.13.3. Company Financials
- 12.1.13.4. SWOT Analysis
- 12.1.1 Marrone Bio innovations
- 12.2. Market Entropy
- 12.2.1 Company's Key Areas Served
- 12.2.2 Recent Developments
- 12.3. Company Market Share Analysis 2025
- 12.3.1 Top 5 Companies Market Share Analysis
- 12.3.2 Top 3 Companies Market Share Analysis
- 12.4. List of Potential Customers
- 13. Research Methodology
List of Figures
- Figure 1: Global Fruit & Vegetable Crop Protection Industry Revenue Breakdown (billion, %) by Region 2025 & 2033
- Figure 2: North America Fruit & Vegetable Crop Protection Industry Revenue (billion), by Production Analysis 2025 & 2033
- Figure 3: North America Fruit & Vegetable Crop Protection Industry Revenue Share (%), by Production Analysis 2025 & 2033
- Figure 4: North America Fruit & Vegetable Crop Protection Industry Revenue (billion), by Consumption Analysis 2025 & 2033
- Figure 5: North America Fruit & Vegetable Crop Protection Industry Revenue Share (%), by Consumption Analysis 2025 & 2033
- Figure 6: North America Fruit & Vegetable Crop Protection Industry Revenue (billion), by Import Market Analysis (Value & Volume) 2025 & 2033
- Figure 7: North America Fruit & Vegetable Crop Protection Industry Revenue Share (%), by Import Market Analysis (Value & Volume) 2025 & 2033
- Figure 8: North America Fruit & Vegetable Crop Protection Industry Revenue (billion), by Export Market Analysis (Value & Volume) 2025 & 2033
- Figure 9: North America Fruit & Vegetable Crop Protection Industry Revenue Share (%), by Export Market Analysis (Value & Volume) 2025 & 2033
- Figure 10: North America Fruit & Vegetable Crop Protection Industry Revenue (billion), by Price Trend Analysis 2025 & 2033
- Figure 11: North America Fruit & Vegetable Crop Protection Industry Revenue Share (%), by Price Trend Analysis 2025 & 2033
- Figure 12: North America Fruit & Vegetable Crop Protection Industry Revenue (billion), by Country 2025 & 2033
- Figure 13: North America Fruit & Vegetable Crop Protection Industry Revenue Share (%), by Country 2025 & 2033
- Figure 14: South America Fruit & Vegetable Crop Protection Industry Revenue (billion), by Production Analysis 2025 & 2033
- Figure 15: South America Fruit & Vegetable Crop Protection Industry Revenue Share (%), by Production Analysis 2025 & 2033
- Figure 16: South America Fruit & Vegetable Crop Protection Industry Revenue (billion), by Consumption Analysis 2025 & 2033
- Figure 17: South America Fruit & Vegetable Crop Protection Industry Revenue Share (%), by Consumption Analysis 2025 & 2033
- Figure 18: South America Fruit & Vegetable Crop Protection Industry Revenue (billion), by Import Market Analysis (Value & Volume) 2025 & 2033
- Figure 19: South America Fruit & Vegetable Crop Protection Industry Revenue Share (%), by Import Market Analysis (Value & Volume) 2025 & 2033
- Figure 20: South America Fruit & Vegetable Crop Protection Industry Revenue (billion), by Export Market Analysis (Value & Volume) 2025 & 2033
- Figure 21: South America Fruit & Vegetable Crop Protection Industry Revenue Share (%), by Export Market Analysis (Value & Volume) 2025 & 2033
- Figure 22: South America Fruit & Vegetable Crop Protection Industry Revenue (billion), by Price Trend Analysis 2025 & 2033
- Figure 23: South America Fruit & Vegetable Crop Protection Industry Revenue Share (%), by Price Trend Analysis 2025 & 2033
- Figure 24: South America Fruit & Vegetable Crop Protection Industry Revenue (billion), by Country 2025 & 2033
- Figure 25: South America Fruit & Vegetable Crop Protection Industry Revenue Share (%), by Country 2025 & 2033
- Figure 26: Europe Fruit & Vegetable Crop Protection Industry Revenue (billion), by Production Analysis 2025 & 2033
- Figure 27: Europe Fruit & Vegetable Crop Protection Industry Revenue Share (%), by Production Analysis 2025 & 2033
- Figure 28: Europe Fruit & Vegetable Crop Protection Industry Revenue (billion), by Consumption Analysis 2025 & 2033
- Figure 29: Europe Fruit & Vegetable Crop Protection Industry Revenue Share (%), by Consumption Analysis 2025 & 2033
- Figure 30: Europe Fruit & Vegetable Crop Protection Industry Revenue (billion), by Import Market Analysis (Value & Volume) 2025 & 2033
- Figure 31: Europe Fruit & Vegetable Crop Protection Industry Revenue Share (%), by Import Market Analysis (Value & Volume) 2025 & 2033
- Figure 32: Europe Fruit & Vegetable Crop Protection Industry Revenue (billion), by Export Market Analysis (Value & Volume) 2025 & 2033
- Figure 33: Europe Fruit & Vegetable Crop Protection Industry Revenue Share (%), by Export Market Analysis (Value & Volume) 2025 & 2033
- Figure 34: Europe Fruit & Vegetable Crop Protection Industry Revenue (billion), by Price Trend Analysis 2025 & 2033
- Figure 35: Europe Fruit & Vegetable Crop Protection Industry Revenue Share (%), by Price Trend Analysis 2025 & 2033
- Figure 36: Europe Fruit & Vegetable Crop Protection Industry Revenue (billion), by Country 2025 & 2033
- Figure 37: Europe Fruit & Vegetable Crop Protection Industry Revenue Share (%), by Country 2025 & 2033
- Figure 38: Middle East & Africa Fruit & Vegetable Crop Protection Industry Revenue (billion), by Production Analysis 2025 & 2033
- Figure 39: Middle East & Africa Fruit & Vegetable Crop Protection Industry Revenue Share (%), by Production Analysis 2025 & 2033
- Figure 40: Middle East & Africa Fruit & Vegetable Crop Protection Industry Revenue (billion), by Consumption Analysis 2025 & 2033
- Figure 41: Middle East & Africa Fruit & Vegetable Crop Protection Industry Revenue Share (%), by Consumption Analysis 2025 & 2033
- Figure 42: Middle East & Africa Fruit & Vegetable Crop Protection Industry Revenue (billion), by Import Market Analysis (Value & Volume) 2025 & 2033
- Figure 43: Middle East & Africa Fruit & Vegetable Crop Protection Industry Revenue Share (%), by Import Market Analysis (Value & Volume) 2025 & 2033
- Figure 44: Middle East & Africa Fruit & Vegetable Crop Protection Industry Revenue (billion), by Export Market Analysis (Value & Volume) 2025 & 2033
- Figure 45: Middle East & Africa Fruit & Vegetable Crop Protection Industry Revenue Share (%), by Export Market Analysis (Value & Volume) 2025 & 2033
- Figure 46: Middle East & Africa Fruit & Vegetable Crop Protection Industry Revenue (billion), by Price Trend Analysis 2025 & 2033
- Figure 47: Middle East & Africa Fruit & Vegetable Crop Protection Industry Revenue Share (%), by Price Trend Analysis 2025 & 2033
- Figure 48: Middle East & Africa Fruit & Vegetable Crop Protection Industry Revenue (billion), by Country 2025 & 2033
- Figure 49: Middle East & Africa Fruit & Vegetable Crop Protection Industry Revenue Share (%), by Country 2025 & 2033
- Figure 50: Asia Pacific Fruit & Vegetable Crop Protection Industry Revenue (billion), by Production Analysis 2025 & 2033
- Figure 51: Asia Pacific Fruit & Vegetable Crop Protection Industry Revenue Share (%), by Production Analysis 2025 & 2033
- Figure 52: Asia Pacific Fruit & Vegetable Crop Protection Industry Revenue (billion), by Consumption Analysis 2025 & 2033
- Figure 53: Asia Pacific Fruit & Vegetable Crop Protection Industry Revenue Share (%), by Consumption Analysis 2025 & 2033
- Figure 54: Asia Pacific Fruit & Vegetable Crop Protection Industry Revenue (billion), by Import Market Analysis (Value & Volume) 2025 & 2033
- Figure 55: Asia Pacific Fruit & Vegetable Crop Protection Industry Revenue Share (%), by Import Market Analysis (Value & Volume) 2025 & 2033
- Figure 56: Asia Pacific Fruit & Vegetable Crop Protection Industry Revenue (billion), by Export Market Analysis (Value & Volume) 2025 & 2033
- Figure 57: Asia Pacific Fruit & Vegetable Crop Protection Industry Revenue Share (%), by Export Market Analysis (Value & Volume) 2025 & 2033
- Figure 58: Asia Pacific Fruit & Vegetable Crop Protection Industry Revenue (billion), by Price Trend Analysis 2025 & 2033
- Figure 59: Asia Pacific Fruit & Vegetable Crop Protection Industry Revenue Share (%), by Price Trend Analysis 2025 & 2033
- Figure 60: Asia Pacific Fruit & Vegetable Crop Protection Industry Revenue (billion), by Country 2025 & 2033
- Figure 61: Asia Pacific Fruit & Vegetable Crop Protection Industry Revenue Share (%), by Country 2025 & 2033
List of Tables
- Table 1: Global Fruit & Vegetable Crop Protection Industry Revenue billion Forecast, by Production Analysis 2020 & 2033
- Table 2: Global Fruit & Vegetable Crop Protection Industry Revenue billion Forecast, by Consumption Analysis 2020 & 2033
- Table 3: Global Fruit & Vegetable Crop Protection Industry Revenue billion Forecast, by Import Market Analysis (Value & Volume) 2020 & 2033
- Table 4: Global Fruit & Vegetable Crop Protection Industry Revenue billion Forecast, by Export Market Analysis (Value & Volume) 2020 & 2033
- Table 5: Global Fruit & Vegetable Crop Protection Industry Revenue billion Forecast, by Price Trend Analysis 2020 & 2033
- Table 6: Global Fruit & Vegetable Crop Protection Industry Revenue billion Forecast, by Region 2020 & 2033
- Table 7: Global Fruit & Vegetable Crop Protection Industry Revenue billion Forecast, by Production Analysis 2020 & 2033
- Table 8: Global Fruit & Vegetable Crop Protection Industry Revenue billion Forecast, by Consumption Analysis 2020 & 2033
- Table 9: Global Fruit & Vegetable Crop Protection Industry Revenue billion Forecast, by Import Market Analysis (Value & Volume) 2020 & 2033
- Table 10: Global Fruit & Vegetable Crop Protection Industry Revenue billion Forecast, by Export Market Analysis (Value & Volume) 2020 & 2033
- Table 11: Global Fruit & Vegetable Crop Protection Industry Revenue billion Forecast, by Price Trend Analysis 2020 & 2033
- Table 12: Global Fruit & Vegetable Crop Protection Industry Revenue billion Forecast, by Country 2020 & 2033
- Table 13: United States Fruit & Vegetable Crop Protection Industry Revenue (billion) Forecast, by Application 2020 & 2033
- Table 14: Canada Fruit & Vegetable Crop Protection Industry Revenue (billion) Forecast, by Application 2020 & 2033
- Table 15: Mexico Fruit & Vegetable Crop Protection Industry Revenue (billion) Forecast, by Application 2020 & 2033
- Table 16: Global Fruit & Vegetable Crop Protection Industry Revenue billion Forecast, by Production Analysis 2020 & 2033
- Table 17: Global Fruit & Vegetable Crop Protection Industry Revenue billion Forecast, by Consumption Analysis 2020 & 2033
- Table 18: Global Fruit & Vegetable Crop Protection Industry Revenue billion Forecast, by Import Market Analysis (Value & Volume) 2020 & 2033
- Table 19: Global Fruit & Vegetable Crop Protection Industry Revenue billion Forecast, by Export Market Analysis (Value & Volume) 2020 & 2033
- Table 20: Global Fruit & Vegetable Crop Protection Industry Revenue billion Forecast, by Price Trend Analysis 2020 & 2033
- Table 21: Global Fruit & Vegetable Crop Protection Industry Revenue billion Forecast, by Country 2020 & 2033
- Table 22: Brazil Fruit & Vegetable Crop Protection Industry Revenue (billion) Forecast, by Application 2020 & 2033
- Table 23: Argentina Fruit & Vegetable Crop Protection Industry Revenue (billion) Forecast, by Application 2020 & 2033
- Table 24: Rest of South America Fruit & Vegetable Crop Protection Industry Revenue (billion) Forecast, by Application 2020 & 2033
- Table 25: Global Fruit & Vegetable Crop Protection Industry Revenue billion Forecast, by Production Analysis 2020 & 2033
- Table 26: Global Fruit & Vegetable Crop Protection Industry Revenue billion Forecast, by Consumption Analysis 2020 & 2033
- Table 27: Global Fruit & Vegetable Crop Protection Industry Revenue billion Forecast, by Import Market Analysis (Value & Volume) 2020 & 2033
- Table 28: Global Fruit & Vegetable Crop Protection Industry Revenue billion Forecast, by Export Market Analysis (Value & Volume) 2020 & 2033
- Table 29: Global Fruit & Vegetable Crop Protection Industry Revenue billion Forecast, by Price Trend Analysis 2020 & 2033
- Table 30: Global Fruit & Vegetable Crop Protection Industry Revenue billion Forecast, by Country 2020 & 2033
- Table 31: United Kingdom Fruit & Vegetable Crop Protection Industry Revenue (billion) Forecast, by Application 2020 & 2033
- Table 32: Germany Fruit & Vegetable Crop Protection Industry Revenue (billion) Forecast, by Application 2020 & 2033
- Table 33: France Fruit & Vegetable Crop Protection Industry Revenue (billion) Forecast, by Application 2020 & 2033
- Table 34: Italy Fruit & Vegetable Crop Protection Industry Revenue (billion) Forecast, by Application 2020 & 2033
- Table 35: Spain Fruit & Vegetable Crop Protection Industry Revenue (billion) Forecast, by Application 2020 & 2033
- Table 36: Russia Fruit & Vegetable Crop Protection Industry Revenue (billion) Forecast, by Application 2020 & 2033
- Table 37: Benelux Fruit & Vegetable Crop Protection Industry Revenue (billion) Forecast, by Application 2020 & 2033
- Table 38: Nordics Fruit & Vegetable Crop Protection Industry Revenue (billion) Forecast, by Application 2020 & 2033
- Table 39: Rest of Europe Fruit & Vegetable Crop Protection Industry Revenue (billion) Forecast, by Application 2020 & 2033
- Table 40: Global Fruit & Vegetable Crop Protection Industry Revenue billion Forecast, by Production Analysis 2020 & 2033
- Table 41: Global Fruit & Vegetable Crop Protection Industry Revenue billion Forecast, by Consumption Analysis 2020 & 2033
- Table 42: Global Fruit & Vegetable Crop Protection Industry Revenue billion Forecast, by Import Market Analysis (Value & Volume) 2020 & 2033
- Table 43: Global Fruit & Vegetable Crop Protection Industry Revenue billion Forecast, by Export Market Analysis (Value & Volume) 2020 & 2033
- Table 44: Global Fruit & Vegetable Crop Protection Industry Revenue billion Forecast, by Price Trend Analysis 2020 & 2033
- Table 45: Global Fruit & Vegetable Crop Protection Industry Revenue billion Forecast, by Country 2020 & 2033
- Table 46: Turkey Fruit & Vegetable Crop Protection Industry Revenue (billion) Forecast, by Application 2020 & 2033
- Table 47: Israel Fruit & Vegetable Crop Protection Industry Revenue (billion) Forecast, by Application 2020 & 2033
- Table 48: GCC Fruit & Vegetable Crop Protection Industry Revenue (billion) Forecast, by Application 2020 & 2033
- Table 49: North Africa Fruit & Vegetable Crop Protection Industry Revenue (billion) Forecast, by Application 2020 & 2033
- Table 50: South Africa Fruit & Vegetable Crop Protection Industry Revenue (billion) Forecast, by Application 2020 & 2033
- Table 51: Rest of Middle East & Africa Fruit & Vegetable Crop Protection Industry Revenue (billion) Forecast, by Application 2020 & 2033
- Table 52: Global Fruit & Vegetable Crop Protection Industry Revenue billion Forecast, by Production Analysis 2020 & 2033
- Table 53: Global Fruit & Vegetable Crop Protection Industry Revenue billion Forecast, by Consumption Analysis 2020 & 2033
- Table 54: Global Fruit & Vegetable Crop Protection Industry Revenue billion Forecast, by Import Market Analysis (Value & Volume) 2020 & 2033
- Table 55: Global Fruit & Vegetable Crop Protection Industry Revenue billion Forecast, by Export Market Analysis (Value & Volume) 2020 & 2033
- Table 56: Global Fruit & Vegetable Crop Protection Industry Revenue billion Forecast, by Price Trend Analysis 2020 & 2033
- Table 57: Global Fruit & Vegetable Crop Protection Industry Revenue billion Forecast, by Country 2020 & 2033
- Table 58: China Fruit & Vegetable Crop Protection Industry Revenue (billion) Forecast, by Application 2020 & 2033
- Table 59: India Fruit & Vegetable Crop Protection Industry Revenue (billion) Forecast, by Application 2020 & 2033
- Table 60: Japan Fruit & Vegetable Crop Protection Industry Revenue (billion) Forecast, by Application 2020 & 2033
- Table 61: South Korea Fruit & Vegetable Crop Protection Industry Revenue (billion) Forecast, by Application 2020 & 2033
- Table 62: ASEAN Fruit & Vegetable Crop Protection Industry Revenue (billion) Forecast, by Application 2020 & 2033
- Table 63: Oceania Fruit & Vegetable Crop Protection Industry Revenue (billion) Forecast, by Application 2020 & 2033
- Table 64: Rest of Asia Pacific Fruit & Vegetable Crop Protection Industry Revenue (billion) Forecast, by Application 2020 & 2033
Frequently Asked Questions
1. What is the projected Compound Annual Growth Rate (CAGR) of the Fruit & Vegetable Crop Protection Industry?
The projected CAGR is approximately 15.15%.
2. Which companies are prominent players in the Fruit & Vegetable Crop Protection Industry?
Key companies in the market include Marrone Bio innovations, FMC Corporation, Bayer Cropscience AG, Certis LLC, Nufarm Limited*List Not Exhaustive, Syngenta International AG, AMVAC Chemical Corporation, Isagro SpA, UPL Limted, Adama Agricultural Solutions, Corteva Agriscience, Koppert Biological Systems, BASF SE.
3. What are the main segments of the Fruit & Vegetable Crop Protection Industry?
The market segments include Production Analysis, Consumption Analysis, Import Market Analysis (Value & Volume), Export Market Analysis (Value & Volume), Price Trend Analysis.
4. Can you provide details about the market size?
The market size is estimated to be USD 13.28 billion as of 2022.
5. What are some drivers contributing to market growth?
Adoption of Organic and Eco-friendly Farming Practices; Declining Area of Arable Land and Rising Food Security Concerns.
6. What are the notable trends driving market growth?
Growing Demand for Food Safety and Quality Driving the Market.
7. Are there any restraints impacting market growth?
High Demand for Conventional and Synthetic Products; Lack of Awareness and Other Factors Limiting the Adoption of Agricultural Inoculants.
8. Can you provide examples of recent developments in the market?
N/A
9. What pricing options are available for accessing the report?
Pricing options include single-user, multi-user, and enterprise licenses priced at USD 4750, USD 5250, and USD 8750 respectively.
10. Is the market size provided in terms of value or volume?
The market size is provided in terms of value, measured in billion.
11. Are there any specific market keywords associated with the report?
Yes, the market keyword associated with the report is "Fruit & Vegetable Crop Protection Industry," which aids in identifying and referencing the specific market segment covered.
12. How do I determine which pricing option suits my needs best?
The pricing options vary based on user requirements and access needs. Individual users may opt for single-user licenses, while businesses requiring broader access may choose multi-user or enterprise licenses for cost-effective access to the report.
13. Are there any additional resources or data provided in the Fruit & Vegetable Crop Protection Industry report?
While the report offers comprehensive insights, it's advisable to review the specific contents or supplementary materials provided to ascertain if additional resources or data are available.
14. How can I stay updated on further developments or reports in the Fruit & Vegetable Crop Protection Industry?
To stay informed about further developments, trends, and reports in the Fruit & Vegetable Crop Protection Industry, consider subscribing to industry newsletters, following relevant companies and organizations, or regularly checking reputable industry news sources and publications.
Methodology
Step 1 - Identification of Relevant Samples Size from Population Database


Step 2 - Approaches for Defining Global Market Size (Value, Volume* & Price*)

Note*: In applicable scenarios
Step 3 - Data Sources
Primary Research
- Web Analytics
- Survey Reports
- Research Institute
- Latest Research Reports
- Opinion Leaders
Secondary Research
- Annual Reports
- White Paper
- Latest Press Release
- Industry Association
- Paid Database
- Investor Presentations

Step 4 - Data Triangulation
Involves using different sources of information in order to increase the validity of a study
These sources are likely to be stakeholders in a program - participants, other researchers, program staff, other community members, and so on.
Then we put all data in single framework & apply various statistical tools to find out the dynamic on the market.
During the analysis stage, feedback from the stakeholder groups would be compared to determine areas of agreement as well as areas of divergence