

Key Insights
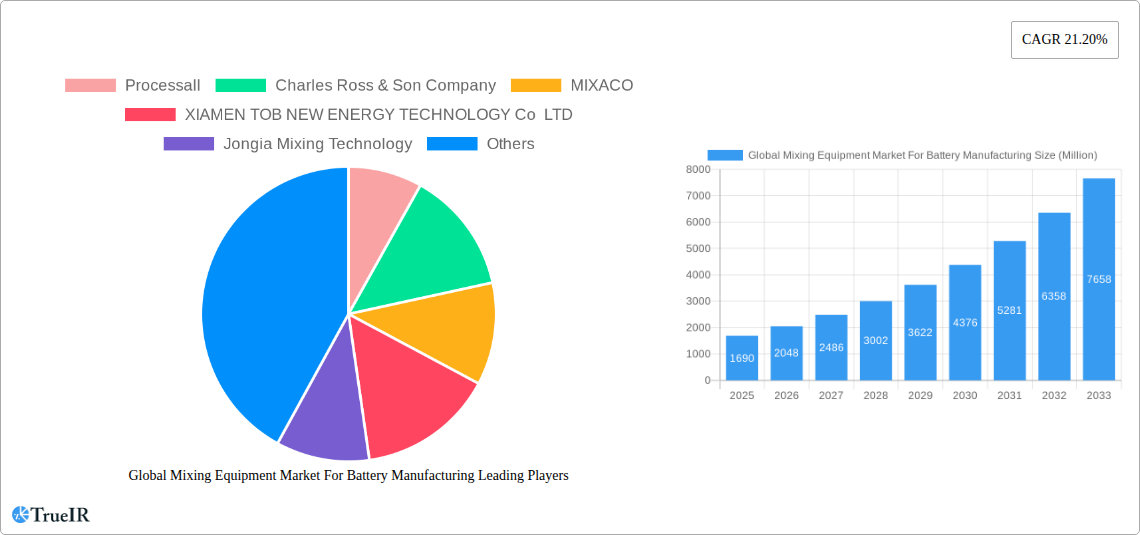
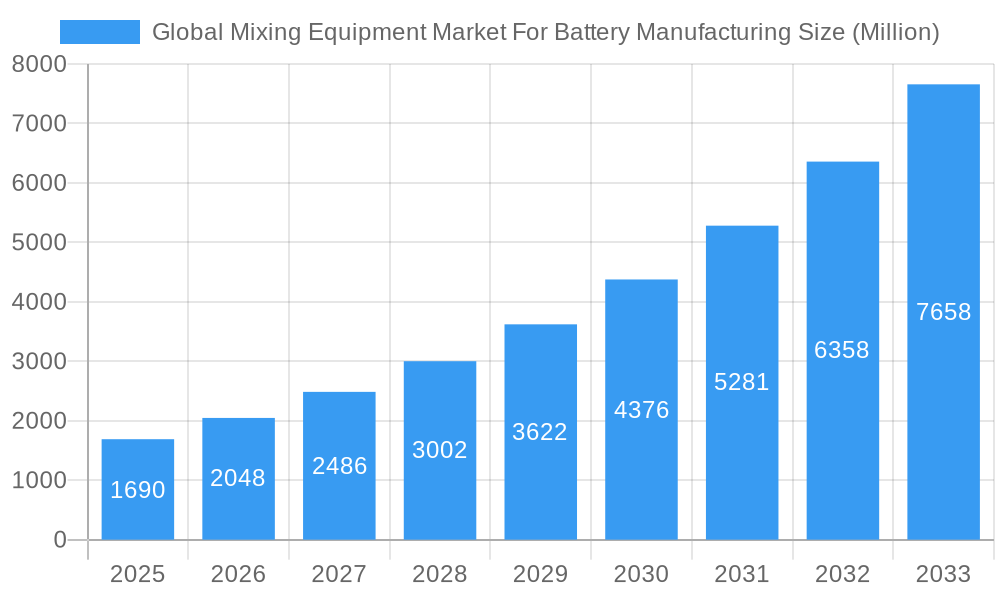
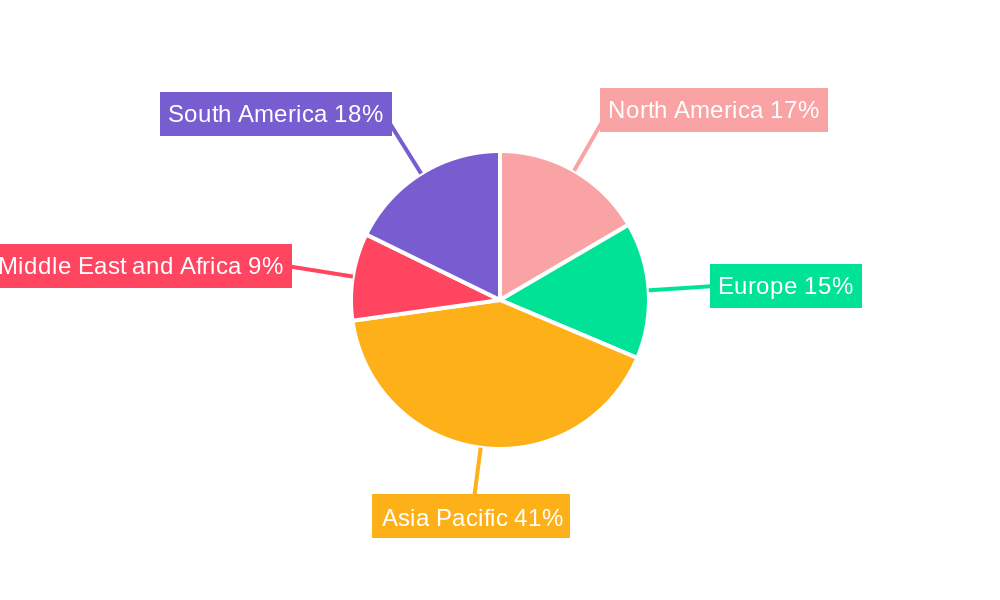
The global mixing equipment market for battery manufacturing is experiencing robust growth, projected to reach \$1.69 billion in 2025 and exhibiting a Compound Annual Growth Rate (CAGR) of 21.20% from 2025 to 2033. This expansion is primarily driven by the burgeoning demand for electric vehicles (EVs) and energy storage systems (ESS), necessitating high-volume production of lithium-ion and other advanced battery technologies. The increasing adoption of automation in battery manufacturing processes further fuels market growth, as efficient mixing is crucial for consistent battery performance and quality. Key trends include the rising demand for high-precision mixing equipment capable of handling diverse battery chemistries and the growing integration of Industry 4.0 technologies such as predictive maintenance and remote monitoring. However, the market faces restraints such as high initial investment costs for advanced mixing technologies and the complexity of integrating these systems into existing production lines. The market is segmented by mixer type, with wet mixers and dry mixers currently dominating. Major players such as Processall, Charles Ross & Son Company, and MIXACO are driving innovation and expanding their market share through strategic partnerships and technological advancements. The Asia-Pacific region, particularly China, is expected to be the leading market, driven by significant investments in battery manufacturing facilities. North America and Europe also hold substantial market share, reflecting the strong presence of major automotive manufacturers and battery technology developers in these regions.
Global Mixing Equipment Market For Battery Manufacturing Market Size (In Billion)
The forecast period (2025-2033) anticipates continued strong growth, fueled by government incentives for EV adoption, advancements in battery technology, and increasing research and development efforts within the battery sector. Geographic expansion into emerging markets will further contribute to market expansion. Competition is expected to intensify as existing players expand their product portfolios and new entrants enter the market, driving innovation and potentially lowering prices. The focus will likely shift towards sustainable and environmentally friendly mixing equipment to address the growing concerns about the environmental impact of battery manufacturing. This evolving landscape presents opportunities for companies that can provide innovative, cost-effective, and sustainable solutions.
Global Mixing Equipment Market For Battery Manufacturing Company Market Share
Global Mixing Equipment Market For Battery Manufacturing: A Comprehensive Report (2019-2033)
This dynamic report provides a comprehensive analysis of the Global Mixing Equipment Market for Battery Manufacturing, offering invaluable insights for industry stakeholders, investors, and researchers. With a detailed study period spanning 2019-2033 (base year 2025, forecast period 2025-2033), this report leverages extensive market research to deliver crucial data and projections, helping you navigate the complexities of this rapidly evolving sector. The market is projected to reach xx Million by 2033, exhibiting a robust CAGR of xx%.
Global Mixing Equipment Market For Battery Manufacturing Market Structure & Competitive Landscape
The global mixing equipment market for battery manufacturing is characterized by a moderately concentrated landscape, with several key players vying for market share. Market concentration ratios, while not readily available publicly, are estimated to indicate moderate to high concentration based on the observed dominance of established players like Charles Ross & Son Company and IKA India Private Limited, alongside emerging players like ONGOAL. Innovation is a crucial driver, with companies constantly developing advanced mixing technologies to improve efficiency, reduce costs, and enhance the quality of battery materials. Stringent regulatory frameworks related to battery production and environmental concerns significantly impact market dynamics, pushing for sustainable and environmentally friendly mixing equipment. Product substitution is limited, with specialized mixing equipment being necessary for battery production. The market is segmented based on end-users (e.g., battery cell manufacturers, materials suppliers). Mergers and acquisitions (M&A) activity within this market is currently at a moderate level; however, with increasing demand, we anticipate an upswing in M&A activity over the forecast period. While precise figures for M&A volumes are unavailable, projections indicate a xx% increase by 2030 driven by the strategic acquisition of companies with specialized technologies and geographical reach.
- Key Market Characteristics: Moderate Concentration, High Innovation, Stringent Regulations, Limited Substitutes
- End-User Segmentation: Battery Cell Manufacturers, Materials Suppliers
- M&A Outlook: Moderate Current Activity, Projected Increase
Global Mixing Equipment Market For Battery Manufacturing Market Trends & Opportunities
The global mixing equipment market for battery manufacturing is experiencing significant growth fueled by the booming electric vehicle (EV) industry and the increasing demand for energy storage solutions. Market size is expanding at a considerable rate, driven by technological advancements in battery chemistry and manufacturing processes. Technological shifts toward automation, improved mixing efficiency, and the adoption of advanced materials are shaping market dynamics. Consumer preferences for high-performance, longer-lasting batteries are driving demand for sophisticated mixing equipment capable of producing high-quality battery materials. The competitive landscape is dynamic, with established players and emerging companies constantly vying for market share through innovation, strategic partnerships, and expansion into new geographic regions. Market penetration rates are gradually increasing, particularly in regions with burgeoning EV industries. The CAGR for the forecast period is estimated at xx%, indicating strong growth potential. This expansion stems from technological developments, increasing adoption of Li-ion battery tech, and government support. Emerging economies are witnessing particularly high growth rates, though developed markets continue to drive significant volume.
Dominant Markets & Segments in Global Mixing Equipment Market For Battery Manufacturing
While precise market share data for individual countries and segments requires proprietary data, analysis suggests a strong concentration of market share in Asia, particularly in China, driven by substantial EV manufacturing and battery production capabilities. Europe and North America also represent significant markets. Within the type segment, Wet Mixers currently hold a larger market share due to the prevalent use of wet processes in battery slurry manufacturing. However, dry mixing techniques are gaining traction due to their potential for enhanced efficiency and reduced solvent use.
Key Growth Drivers:
- Asia (especially China): Strong domestic EV manufacturing base and government support.
- Europe & North America: Robust demand for electric vehicles and energy storage solutions.
- Wet Mixers: Established technology, suitability for various battery chemistries.
- Dry Mixers: Growing adoption due to efficiency and environmental advantages.
Market Dominance Analysis: China's significant role in global battery manufacturing significantly influences the market, driving innovation and demand for efficient mixing equipment. The region's extensive infrastructure and proactive government policies aimed at promoting the EV industry further propel market growth.
Global Mixing Equipment Market For Battery Manufacturing Product Analysis
The market offers a variety of mixing equipment tailored to different battery chemistries and production scales. Innovations focus on enhancing mixing efficiency, reducing energy consumption, and improving the homogeneity of battery slurries. High-shear mixers, planetary mixers, and specialized extruders are common, each offering distinct advantages based on the specific application and desired material properties. These advancements contribute to improvements in battery performance, longevity, and safety, fostering wider market acceptance. Competitive advantages are derived from factors like innovative designs, advanced process control systems, and robust after-sales service.
Key Drivers, Barriers & Challenges in Global Mixing Equipment Market For Battery Manufacturing
Key Drivers:
The escalating demand for electric vehicles and energy storage systems is the primary driver. Technological advancements in battery manufacturing processes, leading to more efficient and automated systems, are also crucial. Government policies and incentives aimed at fostering the growth of the renewable energy sector globally provide substantial support. Finally, rising investments in research and development are continually advancing the technology and expanding the market.
Key Challenges and Restraints:
Supply chain disruptions related to raw materials and components represent a major challenge. Stringent environmental regulations and safety standards can increase manufacturing costs and complexities. Intense competition among manufacturers leads to price pressures. The fluctuating prices of raw materials can also negatively affect profit margins. These challenges require strategic adaptation and innovative solutions from market participants.
Growth Drivers in the Global Mixing Equipment Market For Battery Manufacturing Market
The expansion of the EV market, coupled with advancements in battery technology and increasing government investment in renewable energy infrastructure, are significant growth drivers. The need for high-quality, high-throughput mixing equipment is continuously increasing, generating substantial demand for the market.
Challenges Impacting Global Mixing Equipment Market For Battery Manufacturing Growth
Supply chain disruptions, escalating raw material prices, and stringent regulatory requirements create considerable hurdles for market growth. These factors necessitate effective strategies for risk mitigation and efficient resource management.
Key Players Shaping the Global Mixing Equipment Market For Battery Manufacturing Market
- Processall
- Charles Ross & Son Company
- MIXACO
- XIAMEN TOB NEW ENERGY TECHNOLOGY Co LTD
- Jongia Mixing Technology
- ONGOAL
- IKA India Private Limited
- SIEHE GROUP
- SCM GROUP LIMITED HK
- Xiamen Tmax Battery Equipments Limited
Significant Global Mixing Equipment Market For Battery Manufacturing Industry Milestones
- September 2023: Fraunhofer Research Institution for Battery Cell Production utilized a 30-millimeter extruder at its new R&D site, showcasing advancements in electrode/battery slurry processing with a throughput of up to 1,200 liters per hour. This demonstrates ongoing innovation within battery production technology.
- May 2023: ONGOAL TECH's exhibition at The Battery Show Europe 2023 highlighted their cutting-edge battery slurry mixing and material production lines, emphasizing the growing focus on comprehensive solutions.
Future Outlook for Global Mixing Equipment Market For Battery Manufacturing Market
The market is poised for sustained growth, driven by the continued expansion of the electric vehicle and renewable energy sectors. Technological innovations, including automation and improved mixing efficiencies, will further enhance market potential. Strategic collaborations and acquisitions will also shape future market dynamics. The market is expected to witness steady growth, driven by increasing demand for high-quality batteries and technological advancements.
Global Mixing Equipment Market For Battery Manufacturing Segmentation
-
1. Type
- 1.1. Wet Mixers
- 1.2. Dry Mixers
Global Mixing Equipment Market For Battery Manufacturing Segmentation By Geography
-
1. North America
- 1.1. United States
- 1.2. Canada
- 1.3. Rest of North America
-
2. Europe
- 2.1. Germany
- 2.2. France
- 2.3. United Kingdom
- 2.4. Italy
- 2.5. Spain
- 2.6. NORDIC
- 2.7. Turkey
- 2.8. Russia
- 2.9. Rest of Europe
-
3. Asia Pacific
- 3.1. China
- 3.2. India
- 3.3. Australia
- 3.4. Japan
- 3.5. Malaysia
- 3.6. Thailand
- 3.7. Indonesia
- 3.8. Vietnam
- 3.9. Rest of Asia Pacific
-
4. Middle East and Africa
- 4.1. Saudi Arabia
- 4.2. United Arab Emirates
- 4.3. Qatar
- 4.4. Egypt
- 4.5. Nigeria
- 4.6. South Africa
- 4.7. Rest of Middle East and Africa
-
5. South America
- 5.1. Brazil
- 5.2. Argentina
- 5.3. Columbia
- 5.4. Rest of South America
Global Mixing Equipment Market For Battery Manufacturing Regional Market Share
Geographic Coverage of Global Mixing Equipment Market For Battery Manufacturing
Global Mixing Equipment Market For Battery Manufacturing REPORT HIGHLIGHTS
| Aspects | Details |
|---|---|
| Study Period | 2020-2034 |
| Base Year | 2025 |
| Estimated Year | 2026 |
| Forecast Period | 2026-2034 |
| Historical Period | 2020-2025 |
| Growth Rate | CAGR of 21.20% from 2020-2034 |
| Segmentation |
|
Table of Contents
- 1. Introduction
- 1.1. Research Scope
- 1.2. Market Segmentation
- 1.3. Research Objective
- 1.4. Definitions and Assumptions
- 2. Executive Summary
- 2.1. Market Snapshot
- 3. Market Dynamics
- 3.1. Market Drivers
- 3.2. Market Restrains
- 3.3. Market Trends
- 3.4. Market Opportunities
- 4. Market Factor Analysis
- 4.1. Porters Five Forces
- 4.1.1. Bargaining Power of Suppliers
- 4.1.2. Bargaining Power of Buyers
- 4.1.3. Threat of New Entrants
- 4.1.4. Threat of Substitutes
- 4.1.5. Competitive Rivalry
- 4.2. PESTEL analysis
- 4.3. BCG Analysis
- 4.3.1. Stars (High Growth, High Market Share)
- 4.3.2. Cash Cows (Low Growth, High Market Share)
- 4.3.3. Question Mark (High Growth, Low Market Share)
- 4.3.4. Dogs (Low Growth, Low Market Share)
- 4.4. Ansoff Matrix Analysis
- 4.5. Supply Chain Analysis
- 4.6. Regulatory Landscape
- 4.7. Current Market Potential and Opportunity Assessment (TAM–SAM–SOM Framework)
- 4.8. TIR Analyst Note
- 4.1. Porters Five Forces
- 5. Market Analysis, Insights and Forecast 2021-2033
- 5.1. Market Analysis, Insights and Forecast - by Type
- 5.1.1. Wet Mixers
- 5.1.2. Dry Mixers
- 5.2. Market Analysis, Insights and Forecast - by Region
- 5.2.1. North America
- 5.2.2. Europe
- 5.2.3. Asia Pacific
- 5.2.4. Middle East and Africa
- 5.2.5. South America
- 5.1. Market Analysis, Insights and Forecast - by Type
- 6. Global Mixing Equipment Market For Battery Manufacturing Analysis, Insights and Forecast, 2021-2033
- 6.1. Market Analysis, Insights and Forecast - by Type
- 6.1.1. Wet Mixers
- 6.1.2. Dry Mixers
- 6.1. Market Analysis, Insights and Forecast - by Type
- 7. North America Global Mixing Equipment Market For Battery Manufacturing Analysis, Insights and Forecast, 2020-2032
- 7.1. Market Analysis, Insights and Forecast - by Type
- 7.1.1. Wet Mixers
- 7.1.2. Dry Mixers
- 7.1. Market Analysis, Insights and Forecast - by Type
- 8. Europe Global Mixing Equipment Market For Battery Manufacturing Analysis, Insights and Forecast, 2020-2032
- 8.1. Market Analysis, Insights and Forecast - by Type
- 8.1.1. Wet Mixers
- 8.1.2. Dry Mixers
- 8.1. Market Analysis, Insights and Forecast - by Type
- 9. Asia Pacific Global Mixing Equipment Market For Battery Manufacturing Analysis, Insights and Forecast, 2020-2032
- 9.1. Market Analysis, Insights and Forecast - by Type
- 9.1.1. Wet Mixers
- 9.1.2. Dry Mixers
- 9.1. Market Analysis, Insights and Forecast - by Type
- 10. Middle East and Africa Global Mixing Equipment Market For Battery Manufacturing Analysis, Insights and Forecast, 2020-2032
- 10.1. Market Analysis, Insights and Forecast - by Type
- 10.1.1. Wet Mixers
- 10.1.2. Dry Mixers
- 10.1. Market Analysis, Insights and Forecast - by Type
- 11. South America Global Mixing Equipment Market For Battery Manufacturing Analysis, Insights and Forecast, 2020-2032
- 11.1. Market Analysis, Insights and Forecast - by Type
- 11.1.1. Wet Mixers
- 11.1.2. Dry Mixers
- 11.1. Market Analysis, Insights and Forecast - by Type
- 12. Competitive Analysis
- 12.1. Company Profiles
- 12.1.1 Processall
- 12.1.1.1. Company Overview
- 12.1.1.2. Products
- 12.1.1.3. Company Financials
- 12.1.1.4. SWOT Analysis
- 12.1.2 Charles Ross & Son Company
- 12.1.2.1. Company Overview
- 12.1.2.2. Products
- 12.1.2.3. Company Financials
- 12.1.2.4. SWOT Analysis
- 12.1.3 MIXACO
- 12.1.3.1. Company Overview
- 12.1.3.2. Products
- 12.1.3.3. Company Financials
- 12.1.3.4. SWOT Analysis
- 12.1.4 XIAMEN TOB NEW ENERGY TECHNOLOGY Co LTD
- 12.1.4.1. Company Overview
- 12.1.4.2. Products
- 12.1.4.3. Company Financials
- 12.1.4.4. SWOT Analysis
- 12.1.5 Jongia Mixing Technology
- 12.1.5.1. Company Overview
- 12.1.5.2. Products
- 12.1.5.3. Company Financials
- 12.1.5.4. SWOT Analysis
- 12.1.6 ONGOAL
- 12.1.6.1. Company Overview
- 12.1.6.2. Products
- 12.1.6.3. Company Financials
- 12.1.6.4. SWOT Analysis
- 12.1.7 IKA India Private Limited
- 12.1.7.1. Company Overview
- 12.1.7.2. Products
- 12.1.7.3. Company Financials
- 12.1.7.4. SWOT Analysis
- 12.1.8 SIEHE GROUP
- 12.1.8.1. Company Overview
- 12.1.8.2. Products
- 12.1.8.3. Company Financials
- 12.1.8.4. SWOT Analysis
- 12.1.9 SCM GROUP LIMITED HK
- 12.1.9.1. Company Overview
- 12.1.9.2. Products
- 12.1.9.3. Company Financials
- 12.1.9.4. SWOT Analysis
- 12.1.10 Xiamen Tmax Battery Equipments Limited
- 12.1.10.1. Company Overview
- 12.1.10.2. Products
- 12.1.10.3. Company Financials
- 12.1.10.4. SWOT Analysis
- 12.1.1 Processall
- 12.2. Market Entropy
- 12.2.1 Company's Key Areas Served
- 12.2.2 Recent Developments
- 12.3. Company Market Share Analysis 2025
- 12.3.1 Top 5 Companies Market Share Analysis
- 12.3.2 Top 3 Companies Market Share Analysis
- 12.4. List of Potential Customers
- 13. Research Methodology
List of Figures
- Figure 1: Global Global Mixing Equipment Market For Battery Manufacturing Revenue Breakdown (Million, %) by Region 2025 & 2033
- Figure 2: Global Global Mixing Equipment Market For Battery Manufacturing Volume Breakdown (K Unit, %) by Region 2025 & 2033
- Figure 3: North America Global Mixing Equipment Market For Battery Manufacturing Revenue (Million), by Type 2025 & 2033
- Figure 4: North America Global Mixing Equipment Market For Battery Manufacturing Volume (K Unit), by Type 2025 & 2033
- Figure 5: North America Global Mixing Equipment Market For Battery Manufacturing Revenue Share (%), by Type 2025 & 2033
- Figure 6: North America Global Mixing Equipment Market For Battery Manufacturing Volume Share (%), by Type 2025 & 2033
- Figure 7: North America Global Mixing Equipment Market For Battery Manufacturing Revenue (Million), by Country 2025 & 2033
- Figure 8: North America Global Mixing Equipment Market For Battery Manufacturing Volume (K Unit), by Country 2025 & 2033
- Figure 9: North America Global Mixing Equipment Market For Battery Manufacturing Revenue Share (%), by Country 2025 & 2033
- Figure 10: North America Global Mixing Equipment Market For Battery Manufacturing Volume Share (%), by Country 2025 & 2033
- Figure 11: Europe Global Mixing Equipment Market For Battery Manufacturing Revenue (Million), by Type 2025 & 2033
- Figure 12: Europe Global Mixing Equipment Market For Battery Manufacturing Volume (K Unit), by Type 2025 & 2033
- Figure 13: Europe Global Mixing Equipment Market For Battery Manufacturing Revenue Share (%), by Type 2025 & 2033
- Figure 14: Europe Global Mixing Equipment Market For Battery Manufacturing Volume Share (%), by Type 2025 & 2033
- Figure 15: Europe Global Mixing Equipment Market For Battery Manufacturing Revenue (Million), by Country 2025 & 2033
- Figure 16: Europe Global Mixing Equipment Market For Battery Manufacturing Volume (K Unit), by Country 2025 & 2033
- Figure 17: Europe Global Mixing Equipment Market For Battery Manufacturing Revenue Share (%), by Country 2025 & 2033
- Figure 18: Europe Global Mixing Equipment Market For Battery Manufacturing Volume Share (%), by Country 2025 & 2033
- Figure 19: Asia Pacific Global Mixing Equipment Market For Battery Manufacturing Revenue (Million), by Type 2025 & 2033
- Figure 20: Asia Pacific Global Mixing Equipment Market For Battery Manufacturing Volume (K Unit), by Type 2025 & 2033
- Figure 21: Asia Pacific Global Mixing Equipment Market For Battery Manufacturing Revenue Share (%), by Type 2025 & 2033
- Figure 22: Asia Pacific Global Mixing Equipment Market For Battery Manufacturing Volume Share (%), by Type 2025 & 2033
- Figure 23: Asia Pacific Global Mixing Equipment Market For Battery Manufacturing Revenue (Million), by Country 2025 & 2033
- Figure 24: Asia Pacific Global Mixing Equipment Market For Battery Manufacturing Volume (K Unit), by Country 2025 & 2033
- Figure 25: Asia Pacific Global Mixing Equipment Market For Battery Manufacturing Revenue Share (%), by Country 2025 & 2033
- Figure 26: Asia Pacific Global Mixing Equipment Market For Battery Manufacturing Volume Share (%), by Country 2025 & 2033
- Figure 27: Middle East and Africa Global Mixing Equipment Market For Battery Manufacturing Revenue (Million), by Type 2025 & 2033
- Figure 28: Middle East and Africa Global Mixing Equipment Market For Battery Manufacturing Volume (K Unit), by Type 2025 & 2033
- Figure 29: Middle East and Africa Global Mixing Equipment Market For Battery Manufacturing Revenue Share (%), by Type 2025 & 2033
- Figure 30: Middle East and Africa Global Mixing Equipment Market For Battery Manufacturing Volume Share (%), by Type 2025 & 2033
- Figure 31: Middle East and Africa Global Mixing Equipment Market For Battery Manufacturing Revenue (Million), by Country 2025 & 2033
- Figure 32: Middle East and Africa Global Mixing Equipment Market For Battery Manufacturing Volume (K Unit), by Country 2025 & 2033
- Figure 33: Middle East and Africa Global Mixing Equipment Market For Battery Manufacturing Revenue Share (%), by Country 2025 & 2033
- Figure 34: Middle East and Africa Global Mixing Equipment Market For Battery Manufacturing Volume Share (%), by Country 2025 & 2033
- Figure 35: South America Global Mixing Equipment Market For Battery Manufacturing Revenue (Million), by Type 2025 & 2033
- Figure 36: South America Global Mixing Equipment Market For Battery Manufacturing Volume (K Unit), by Type 2025 & 2033
- Figure 37: South America Global Mixing Equipment Market For Battery Manufacturing Revenue Share (%), by Type 2025 & 2033
- Figure 38: South America Global Mixing Equipment Market For Battery Manufacturing Volume Share (%), by Type 2025 & 2033
- Figure 39: South America Global Mixing Equipment Market For Battery Manufacturing Revenue (Million), by Country 2025 & 2033
- Figure 40: South America Global Mixing Equipment Market For Battery Manufacturing Volume (K Unit), by Country 2025 & 2033
- Figure 41: South America Global Mixing Equipment Market For Battery Manufacturing Revenue Share (%), by Country 2025 & 2033
- Figure 42: South America Global Mixing Equipment Market For Battery Manufacturing Volume Share (%), by Country 2025 & 2033
List of Tables
- Table 1: Global Mixing Equipment Market For Battery Manufacturing Revenue Million Forecast, by Type 2020 & 2033
- Table 2: Global Mixing Equipment Market For Battery Manufacturing Volume K Unit Forecast, by Type 2020 & 2033
- Table 3: Global Mixing Equipment Market For Battery Manufacturing Revenue Million Forecast, by Region 2020 & 2033
- Table 4: Global Mixing Equipment Market For Battery Manufacturing Volume K Unit Forecast, by Region 2020 & 2033
- Table 5: Global Mixing Equipment Market For Battery Manufacturing Revenue Million Forecast, by Type 2020 & 2033
- Table 6: Global Mixing Equipment Market For Battery Manufacturing Volume K Unit Forecast, by Type 2020 & 2033
- Table 7: Global Mixing Equipment Market For Battery Manufacturing Revenue Million Forecast, by Country 2020 & 2033
- Table 8: Global Mixing Equipment Market For Battery Manufacturing Volume K Unit Forecast, by Country 2020 & 2033
- Table 9: United States Global Mixing Equipment Market For Battery Manufacturing Revenue (Million) Forecast, by Application 2020 & 2033
- Table 10: United States Global Mixing Equipment Market For Battery Manufacturing Volume (K Unit) Forecast, by Application 2020 & 2033
- Table 11: Canada Global Mixing Equipment Market For Battery Manufacturing Revenue (Million) Forecast, by Application 2020 & 2033
- Table 12: Canada Global Mixing Equipment Market For Battery Manufacturing Volume (K Unit) Forecast, by Application 2020 & 2033
- Table 13: Rest of North America Global Mixing Equipment Market For Battery Manufacturing Revenue (Million) Forecast, by Application 2020 & 2033
- Table 14: Rest of North America Global Mixing Equipment Market For Battery Manufacturing Volume (K Unit) Forecast, by Application 2020 & 2033
- Table 15: Global Mixing Equipment Market For Battery Manufacturing Revenue Million Forecast, by Type 2020 & 2033
- Table 16: Global Mixing Equipment Market For Battery Manufacturing Volume K Unit Forecast, by Type 2020 & 2033
- Table 17: Global Mixing Equipment Market For Battery Manufacturing Revenue Million Forecast, by Country 2020 & 2033
- Table 18: Global Mixing Equipment Market For Battery Manufacturing Volume K Unit Forecast, by Country 2020 & 2033
- Table 19: Germany Global Mixing Equipment Market For Battery Manufacturing Revenue (Million) Forecast, by Application 2020 & 2033
- Table 20: Germany Global Mixing Equipment Market For Battery Manufacturing Volume (K Unit) Forecast, by Application 2020 & 2033
- Table 21: France Global Mixing Equipment Market For Battery Manufacturing Revenue (Million) Forecast, by Application 2020 & 2033
- Table 22: France Global Mixing Equipment Market For Battery Manufacturing Volume (K Unit) Forecast, by Application 2020 & 2033
- Table 23: United Kingdom Global Mixing Equipment Market For Battery Manufacturing Revenue (Million) Forecast, by Application 2020 & 2033
- Table 24: United Kingdom Global Mixing Equipment Market For Battery Manufacturing Volume (K Unit) Forecast, by Application 2020 & 2033
- Table 25: Italy Global Mixing Equipment Market For Battery Manufacturing Revenue (Million) Forecast, by Application 2020 & 2033
- Table 26: Italy Global Mixing Equipment Market For Battery Manufacturing Volume (K Unit) Forecast, by Application 2020 & 2033
- Table 27: Spain Global Mixing Equipment Market For Battery Manufacturing Revenue (Million) Forecast, by Application 2020 & 2033
- Table 28: Spain Global Mixing Equipment Market For Battery Manufacturing Volume (K Unit) Forecast, by Application 2020 & 2033
- Table 29: NORDIC Global Mixing Equipment Market For Battery Manufacturing Revenue (Million) Forecast, by Application 2020 & 2033
- Table 30: NORDIC Global Mixing Equipment Market For Battery Manufacturing Volume (K Unit) Forecast, by Application 2020 & 2033
- Table 31: Turkey Global Mixing Equipment Market For Battery Manufacturing Revenue (Million) Forecast, by Application 2020 & 2033
- Table 32: Turkey Global Mixing Equipment Market For Battery Manufacturing Volume (K Unit) Forecast, by Application 2020 & 2033
- Table 33: Russia Global Mixing Equipment Market For Battery Manufacturing Revenue (Million) Forecast, by Application 2020 & 2033
- Table 34: Russia Global Mixing Equipment Market For Battery Manufacturing Volume (K Unit) Forecast, by Application 2020 & 2033
- Table 35: Rest of Europe Global Mixing Equipment Market For Battery Manufacturing Revenue (Million) Forecast, by Application 2020 & 2033
- Table 36: Rest of Europe Global Mixing Equipment Market For Battery Manufacturing Volume (K Unit) Forecast, by Application 2020 & 2033
- Table 37: Global Mixing Equipment Market For Battery Manufacturing Revenue Million Forecast, by Type 2020 & 2033
- Table 38: Global Mixing Equipment Market For Battery Manufacturing Volume K Unit Forecast, by Type 2020 & 2033
- Table 39: Global Mixing Equipment Market For Battery Manufacturing Revenue Million Forecast, by Country 2020 & 2033
- Table 40: Global Mixing Equipment Market For Battery Manufacturing Volume K Unit Forecast, by Country 2020 & 2033
- Table 41: China Global Mixing Equipment Market For Battery Manufacturing Revenue (Million) Forecast, by Application 2020 & 2033
- Table 42: China Global Mixing Equipment Market For Battery Manufacturing Volume (K Unit) Forecast, by Application 2020 & 2033
- Table 43: India Global Mixing Equipment Market For Battery Manufacturing Revenue (Million) Forecast, by Application 2020 & 2033
- Table 44: India Global Mixing Equipment Market For Battery Manufacturing Volume (K Unit) Forecast, by Application 2020 & 2033
- Table 45: Australia Global Mixing Equipment Market For Battery Manufacturing Revenue (Million) Forecast, by Application 2020 & 2033
- Table 46: Australia Global Mixing Equipment Market For Battery Manufacturing Volume (K Unit) Forecast, by Application 2020 & 2033
- Table 47: Japan Global Mixing Equipment Market For Battery Manufacturing Revenue (Million) Forecast, by Application 2020 & 2033
- Table 48: Japan Global Mixing Equipment Market For Battery Manufacturing Volume (K Unit) Forecast, by Application 2020 & 2033
- Table 49: Malaysia Global Mixing Equipment Market For Battery Manufacturing Revenue (Million) Forecast, by Application 2020 & 2033
- Table 50: Malaysia Global Mixing Equipment Market For Battery Manufacturing Volume (K Unit) Forecast, by Application 2020 & 2033
- Table 51: Thailand Global Mixing Equipment Market For Battery Manufacturing Revenue (Million) Forecast, by Application 2020 & 2033
- Table 52: Thailand Global Mixing Equipment Market For Battery Manufacturing Volume (K Unit) Forecast, by Application 2020 & 2033
- Table 53: Indonesia Global Mixing Equipment Market For Battery Manufacturing Revenue (Million) Forecast, by Application 2020 & 2033
- Table 54: Indonesia Global Mixing Equipment Market For Battery Manufacturing Volume (K Unit) Forecast, by Application 2020 & 2033
- Table 55: Vietnam Global Mixing Equipment Market For Battery Manufacturing Revenue (Million) Forecast, by Application 2020 & 2033
- Table 56: Vietnam Global Mixing Equipment Market For Battery Manufacturing Volume (K Unit) Forecast, by Application 2020 & 2033
- Table 57: Rest of Asia Pacific Global Mixing Equipment Market For Battery Manufacturing Revenue (Million) Forecast, by Application 2020 & 2033
- Table 58: Rest of Asia Pacific Global Mixing Equipment Market For Battery Manufacturing Volume (K Unit) Forecast, by Application 2020 & 2033
- Table 59: Global Mixing Equipment Market For Battery Manufacturing Revenue Million Forecast, by Type 2020 & 2033
- Table 60: Global Mixing Equipment Market For Battery Manufacturing Volume K Unit Forecast, by Type 2020 & 2033
- Table 61: Global Mixing Equipment Market For Battery Manufacturing Revenue Million Forecast, by Country 2020 & 2033
- Table 62: Global Mixing Equipment Market For Battery Manufacturing Volume K Unit Forecast, by Country 2020 & 2033
- Table 63: Saudi Arabia Global Mixing Equipment Market For Battery Manufacturing Revenue (Million) Forecast, by Application 2020 & 2033
- Table 64: Saudi Arabia Global Mixing Equipment Market For Battery Manufacturing Volume (K Unit) Forecast, by Application 2020 & 2033
- Table 65: United Arab Emirates Global Mixing Equipment Market For Battery Manufacturing Revenue (Million) Forecast, by Application 2020 & 2033
- Table 66: United Arab Emirates Global Mixing Equipment Market For Battery Manufacturing Volume (K Unit) Forecast, by Application 2020 & 2033
- Table 67: Qatar Global Mixing Equipment Market For Battery Manufacturing Revenue (Million) Forecast, by Application 2020 & 2033
- Table 68: Qatar Global Mixing Equipment Market For Battery Manufacturing Volume (K Unit) Forecast, by Application 2020 & 2033
- Table 69: Egypt Global Mixing Equipment Market For Battery Manufacturing Revenue (Million) Forecast, by Application 2020 & 2033
- Table 70: Egypt Global Mixing Equipment Market For Battery Manufacturing Volume (K Unit) Forecast, by Application 2020 & 2033
- Table 71: Nigeria Global Mixing Equipment Market For Battery Manufacturing Revenue (Million) Forecast, by Application 2020 & 2033
- Table 72: Nigeria Global Mixing Equipment Market For Battery Manufacturing Volume (K Unit) Forecast, by Application 2020 & 2033
- Table 73: South Africa Global Mixing Equipment Market For Battery Manufacturing Revenue (Million) Forecast, by Application 2020 & 2033
- Table 74: South Africa Global Mixing Equipment Market For Battery Manufacturing Volume (K Unit) Forecast, by Application 2020 & 2033
- Table 75: Rest of Middle East and Africa Global Mixing Equipment Market For Battery Manufacturing Revenue (Million) Forecast, by Application 2020 & 2033
- Table 76: Rest of Middle East and Africa Global Mixing Equipment Market For Battery Manufacturing Volume (K Unit) Forecast, by Application 2020 & 2033
- Table 77: Global Mixing Equipment Market For Battery Manufacturing Revenue Million Forecast, by Type 2020 & 2033
- Table 78: Global Mixing Equipment Market For Battery Manufacturing Volume K Unit Forecast, by Type 2020 & 2033
- Table 79: Global Mixing Equipment Market For Battery Manufacturing Revenue Million Forecast, by Country 2020 & 2033
- Table 80: Global Mixing Equipment Market For Battery Manufacturing Volume K Unit Forecast, by Country 2020 & 2033
- Table 81: Brazil Global Mixing Equipment Market For Battery Manufacturing Revenue (Million) Forecast, by Application 2020 & 2033
- Table 82: Brazil Global Mixing Equipment Market For Battery Manufacturing Volume (K Unit) Forecast, by Application 2020 & 2033
- Table 83: Argentina Global Mixing Equipment Market For Battery Manufacturing Revenue (Million) Forecast, by Application 2020 & 2033
- Table 84: Argentina Global Mixing Equipment Market For Battery Manufacturing Volume (K Unit) Forecast, by Application 2020 & 2033
- Table 85: Columbia Global Mixing Equipment Market For Battery Manufacturing Revenue (Million) Forecast, by Application 2020 & 2033
- Table 86: Columbia Global Mixing Equipment Market For Battery Manufacturing Volume (K Unit) Forecast, by Application 2020 & 2033
- Table 87: Rest of South America Global Mixing Equipment Market For Battery Manufacturing Revenue (Million) Forecast, by Application 2020 & 2033
- Table 88: Rest of South America Global Mixing Equipment Market For Battery Manufacturing Volume (K Unit) Forecast, by Application 2020 & 2033
Frequently Asked Questions
1. What is the projected Compound Annual Growth Rate (CAGR) of the Global Mixing Equipment Market For Battery Manufacturing?
The projected CAGR is approximately 21.20%.
2. Which companies are prominent players in the Global Mixing Equipment Market For Battery Manufacturing?
Key companies in the market include Processall, Charles Ross & Son Company, MIXACO, XIAMEN TOB NEW ENERGY TECHNOLOGY Co LTD, Jongia Mixing Technology, ONGOAL, IKA India Private Limited, SIEHE GROUP, SCM GROUP LIMITED HK, Xiamen Tmax Battery Equipments Limited.
3. What are the main segments of the Global Mixing Equipment Market For Battery Manufacturing?
The market segments include Type.
4. Can you provide details about the market size?
The market size is estimated to be USD 1.69 Million as of 2022.
5. What are some drivers contributing to market growth?
4.; The Increase in Investments to Enhance the Battery Production Capacity4.; Rising Adoption of Electric Vehicles.
6. What are the notable trends driving market growth?
Investments To Enhance the Battery Production Capacity is expected to Drive the Market Growth.
7. Are there any restraints impacting market growth?
4.; The High Logistic Cost.
8. Can you provide examples of recent developments in the market?
September 2023: Fraunhofer Research Institution for Battery Cell Production used a 30-millimeter extruder at FFB’s new R&D site in Münster, Germany. Fraunhofer-Gesellschaft’s research organization is also building its FFB PreFab test facility, with a throughput of up to 1,200 liters of electrode/battery slurry per hour.
9. What pricing options are available for accessing the report?
Pricing options include single-user, multi-user, and enterprise licenses priced at USD 4750, USD 5250, and USD 8750 respectively.
10. Is the market size provided in terms of value or volume?
The market size is provided in terms of value, measured in Million and volume, measured in K Unit.
11. Are there any specific market keywords associated with the report?
Yes, the market keyword associated with the report is "Global Mixing Equipment Market For Battery Manufacturing," which aids in identifying and referencing the specific market segment covered.
12. How do I determine which pricing option suits my needs best?
The pricing options vary based on user requirements and access needs. Individual users may opt for single-user licenses, while businesses requiring broader access may choose multi-user or enterprise licenses for cost-effective access to the report.
13. Are there any additional resources or data provided in the Global Mixing Equipment Market For Battery Manufacturing report?
While the report offers comprehensive insights, it's advisable to review the specific contents or supplementary materials provided to ascertain if additional resources or data are available.
14. How can I stay updated on further developments or reports in the Global Mixing Equipment Market For Battery Manufacturing?
To stay informed about further developments, trends, and reports in the Global Mixing Equipment Market For Battery Manufacturing, consider subscribing to industry newsletters, following relevant companies and organizations, or regularly checking reputable industry news sources and publications.
Methodology
Step 1 - Identification of Relevant Samples Size from Population Database


Step 2 - Approaches for Defining Global Market Size (Value, Volume* & Price*)

Note*: In applicable scenarios
Step 3 - Data Sources
Primary Research
- Web Analytics
- Survey Reports
- Research Institute
- Latest Research Reports
- Opinion Leaders
Secondary Research
- Annual Reports
- White Paper
- Latest Press Release
- Industry Association
- Paid Database
- Investor Presentations

Step 4 - Data Triangulation
Involves using different sources of information in order to increase the validity of a study
These sources are likely to be stakeholders in a program - participants, other researchers, program staff, other community members, and so on.
Then we put all data in single framework & apply various statistical tools to find out the dynamic on the market.
During the analysis stage, feedback from the stakeholder groups would be compared to determine areas of agreement as well as areas of divergence