

Key Insights
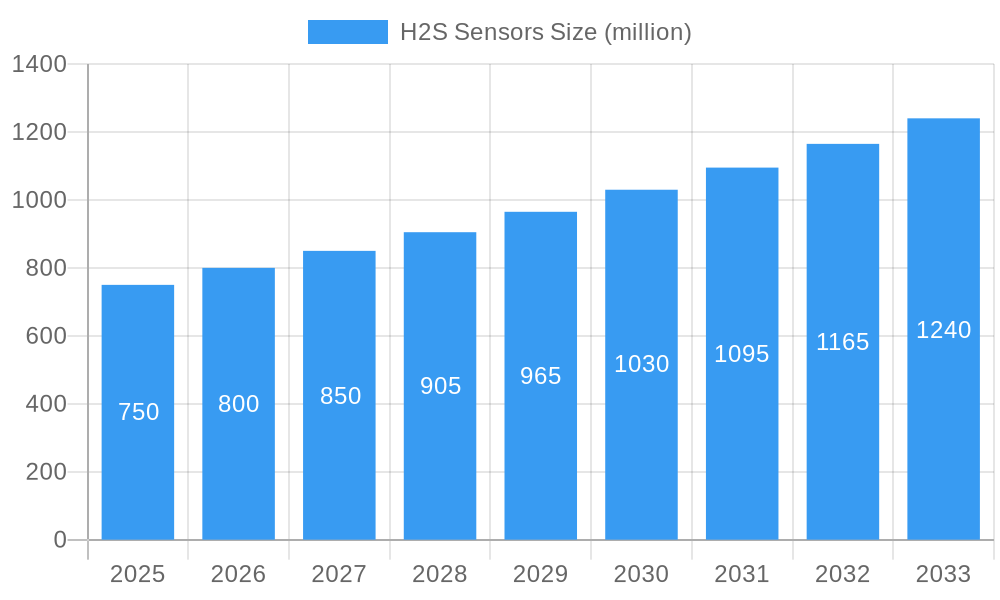
The global H2S sensor market is poised for significant expansion, projected to reach a market size of approximately $750 million by 2025, with a Compound Annual Growth Rate (CAGR) of roughly 6.5% expected throughout the forecast period of 2025-2033. This robust growth is primarily driven by the escalating need for stringent safety measures and environmental monitoring across various industries. The oil and gas sector, a cornerstone of H2S sensor applications due to the presence of hydrogen sulfide in crude oil and natural gas, will continue to be a major demand generator. Furthermore, the increasing focus on biogas production, wastewater treatment, and general industrial safety regulations worldwide is fueling the adoption of these critical detection devices. The market will likely see a substantial increase in demand for sensors with detection ranges up to 50ppm, catering to a broad spectrum of typical operational requirements, while higher detection ranges will remain vital for specialized, high-risk environments.
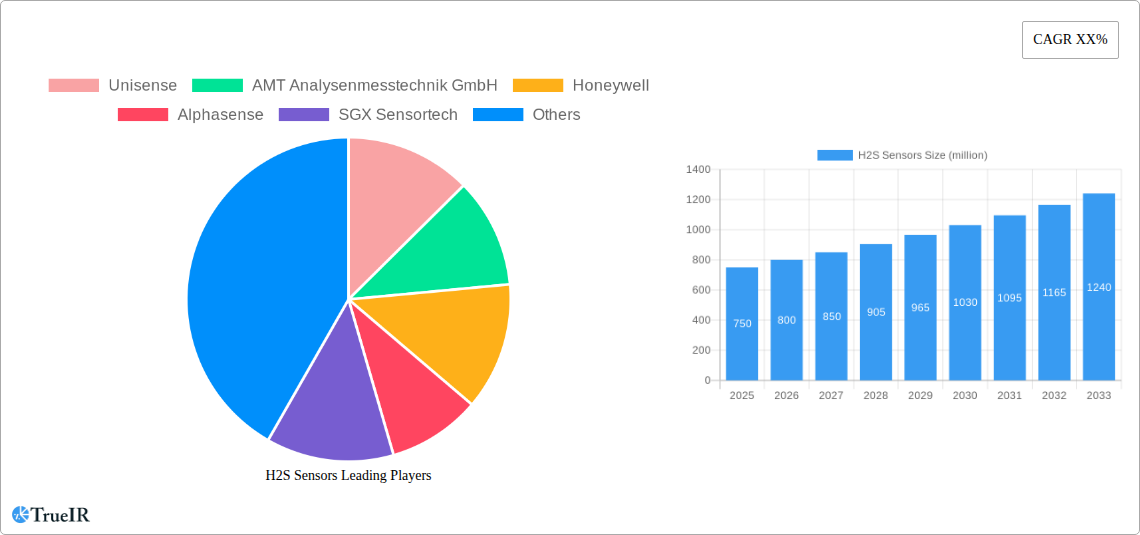
H2S Sensors Market Size (In Million)
Several key trends are shaping the H2S sensor market. Advancements in sensor technology, leading to improved accuracy, faster response times, and enhanced durability in harsh conditions, are a primary catalyst. The integration of IoT capabilities, enabling remote monitoring, data analytics, and predictive maintenance, is also gaining momentum. This shift towards smart sensor solutions allows for real-time alerts and proactive safety management, significantly reducing the risk of exposure to toxic H2S gas. However, the market faces some restraints, including the initial high cost of advanced sensor deployment and the need for regular calibration and maintenance, which can pose challenges for smaller enterprises. Despite these hurdles, the unwavering commitment to worker safety, environmental protection, and regulatory compliance ensures a consistently upward trajectory for the H2S sensor market. Key players such as Honeywell, MSA Safety Incorporated, and RKI Instruments are expected to lead innovation and market penetration.
H2S Sensors Company Market Share
This in-depth market research report provides a comprehensive analysis of the global H2S Sensors market, meticulously examining its structure, trends, opportunities, and competitive landscape. With a study period spanning from 2019 to 2033, and a base year of 2025, this report offers crucial insights for stakeholders navigating the evolving demands for hydrogen sulfide detection. Leveraging high-volume keywords and detailed segment analysis, this report is designed for optimal SEO performance and industry engagement.
H2S Sensors Market Structure & Competitive Landscape
The global H2S sensors market is characterized by a moderate level of concentration, with a few major players holding significant market share, alongside a substantial number of niche and regional manufacturers. Innovation is a key driver, fueled by the increasing demand for more sensitive, reliable, and cost-effective H2S detection solutions across various industries. Regulatory impacts are substantial, with stringent health and safety standards mandating the use of H2S sensors in environments where these toxic gases are present. This drives continuous product development and adoption. Product substitutes, while limited in direct high-performance applications, may include less precise or intermittent monitoring methods in some less critical scenarios. End-user segmentation reveals a diverse customer base, with key applications in Wastewater, Oil & Gas, and Biogas, among others. Merger and acquisition (M&A) trends are indicative of consolidation efforts, with an estimated XX M&A deals occurring within the historical period, aimed at expanding product portfolios and market reach. Key companies influencing this landscape include Unisense, AMT Analysenmesstechnik GmbH, Honeywell, Alphasense, SGX Sensortech, DD-Scientific, Nemoto Sensor Engineering Company Limited, RKI Instruments, Inc (Riken Keiki Co. Ltd), MEMBRAPOR, Gastec Corporation, City Technology Ltd, Franatech, MSA Safety Incorporated, Pem-Tech, Inc, PT Triguna Mandala, General Monitors, and Zhengzhou Winsen Electronics Technology Co., Ltd.
H2S Sensors Market Trends & Opportunities
The H2S sensors market is experiencing robust growth, projected to reach a market size of over XX million by 2033. This expansion is driven by a confluence of factors, including escalating industrialization, stringent environmental regulations, and an increased awareness of the severe health and safety risks associated with hydrogen sulfide exposure. The historical period (2019-2024) witnessed a steady CAGR of approximately XX%, with the base year of 2025 expected to see continued momentum. Technological advancements are at the forefront of market evolution, with a growing emphasis on electrochemical and semiconductor-based H2S sensors offering enhanced accuracy, faster response times, and extended operational lifespans. The development of smart sensors with IoT capabilities, enabling remote monitoring, data analytics, and predictive maintenance, presents a significant opportunity for market players. Consumer preferences are leaning towards integrated solutions that offer seamless deployment and user-friendly interfaces, coupled with the need for sensors capable of operating in extreme environmental conditions, such as high temperatures and corrosive atmospheres. Competitive dynamics are intensifying, with companies investing heavily in R&D to differentiate their offerings. The forecast period (2025-2033) is anticipated to see a CAGR of around XX%, fueled by emerging applications in areas like renewable energy infrastructure and advanced industrial safety systems. The increasing penetration rate of H2S sensors in emerging economies, driven by the adoption of stricter industrial safety norms, further bolsters the market's upward trajectory. Opportunities abound for companies that can deliver innovative, reliable, and scalable H2S sensing solutions that address the evolving needs of critical industries.
Dominant Markets & Segments in H2S Sensors
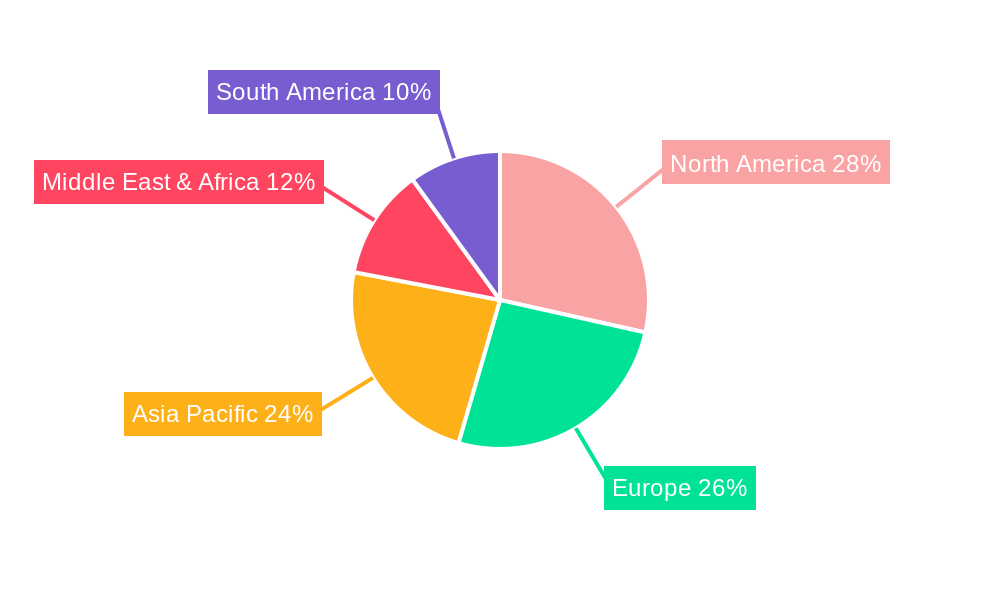
The global H2S sensors market exhibits distinct regional and application dominance. North America is currently the leading region, driven by its mature Oil & Gas industry, stringent environmental regulations, and significant investments in infrastructure development and safety upgrades. Within North America, the United States spearheads market demand, supported by advanced technological adoption and a high density of industrial facilities requiring robust H2S monitoring.
In terms of Application, the Oil & Gas segment is the largest and most influential, encompassing exploration, extraction, refining, and transportation processes where H2S is a prevalent and hazardous byproduct. The continuous need for safety and operational efficiency in this sector fuels substantial demand for H2S sensors. The Wastewater segment follows closely, driven by the increasing focus on environmental protection and public health, as H2S is commonly generated during the anaerobic decomposition of organic matter in sewage treatment plants. The Biogas sector is also a rapidly growing application, with the increasing production of biogas for renewable energy purposes, where H2S removal and monitoring are crucial for system integrity and efficiency.
Analyzing Types based on Detection Range, the 0-50ppm range is currently the most dominant. This range adequately covers the majority of common occupational exposure limits and safety thresholds encountered in industries like Oil & Gas and Wastewater treatment. However, there is a discernible and growing demand for sensors in the 0-100ppm range, particularly for applications involving higher concentrations or emergency response scenarios. The 0-20ppm range is crucial for highly sensitive applications and continuous low-level monitoring to ensure compliance with the most stringent safety standards.
Key growth drivers in dominant segments include:
- Oil & Gas: Infrastructure expansion, enhanced safety regulations (e.g., OSHA, EPA), and the need to prevent costly downtime and environmental incidents.
- Wastewater: Growing investments in municipal and industrial wastewater treatment facilities, stringent discharge limits, and public health concerns.
- Biogas: Rise in renewable energy initiatives, government subsidies for biogas production, and the need for process optimization and safety in anaerobic digestion.
- Detection Range 0-50ppm: Widespread adoption in standard industrial safety protocols and compliance monitoring.
- Detection Range 0-100ppm: Increasing use in high-risk environments and emergency preparedness.
H2S Sensors Product Analysis
Product innovation in the H2S sensors market is centered on enhancing sensor performance, durability, and connectivity. Advancements in electrochemical sensor technology are yielding improved accuracy, reduced cross-sensitivity to other gases, and longer sensor life, often exceeding XX years. The development of multi-gas sensors capable of detecting H2S alongside other hazardous compounds like CO, LEL, and O2 streamlines safety monitoring. Furthermore, the integration of IoT capabilities, wireless communication protocols (e.g., Bluetooth, LoRaWAN), and cloud-based data platforms allows for real-time remote monitoring, data logging, and predictive analytics, enhancing operational efficiency and proactive safety management. These innovations provide a competitive advantage by offering superior reliability and comprehensive safety solutions.
Key Drivers, Barriers & Challenges in H2S Sensors
Key Drivers: The H2S sensors market is propelled by stringent regulatory mandates for worker safety and environmental protection in industries such as Oil & Gas and Wastewater. Technological advancements, leading to more accurate, sensitive, and durable sensors, are critical. The increasing global focus on renewable energy sources like biogas further drives demand. Economic growth in developing nations leads to increased industrialization and adoption of safety standards. The demand for continuous monitoring solutions and the integration of IoT for remote data access are also significant growth catalysts.
Barriers & Challenges: Supply chain disruptions, particularly for critical raw materials and electronic components, can impact production and pricing. High initial investment costs for advanced H2S sensing systems can be a barrier for smaller enterprises. Intense competition among numerous global and regional players can lead to price pressures. Evolving and sometimes fragmented regulatory landscapes across different regions can pose compliance challenges. The need for specialized training for installation, calibration, and maintenance of complex sensing equipment also presents a challenge.
Growth Drivers in the H2S Sensors Market
The H2S sensors market is significantly driven by an increasing global emphasis on worker safety and stringent environmental regulations in critical sectors like Oil & Gas, mining, and wastewater treatment. Technological innovation, particularly in developing more sensitive, accurate, and long-lasting electrochemical and semiconductor-based sensors, is a primary growth catalyst. The expanding biogas industry, fueled by renewable energy initiatives, necessitates reliable H2S monitoring for process optimization and safety. Furthermore, the growing adoption of IoT and smart sensor technologies for remote monitoring and predictive maintenance is opening new avenues for market expansion.
Challenges Impacting H2S Sensors Growth
Several challenges can impact the growth trajectory of the H2S sensors market. Supply chain vulnerabilities, especially concerning the availability of key components and materials, can lead to production delays and increased costs. The fragmented nature of regulatory frameworks across different countries can create complexities in compliance and market entry. While demand is growing, the initial capital expenditure for advanced H2S sensing systems can be a deterrent for some small to medium-sized enterprises. Intense competition among established and emerging players also exerts downward pressure on pricing, potentially affecting profitability.
Key Players Shaping the H2S Sensors Market
- Unisense
- AMT Analysenmesstechnik GmbH
- Honeywell
- Alphasense
- SGX Sensortech
- DD-Scientific
- Nemoto Sensor Engineering Company Limited
- RKI Instruments, Inc (Riken Keiki Co. Ltd)
- MEMBRAPOR
- Gastec Corporation
- City Technology Ltd
- Franatech
- MSA Safety Incorporated
- Pem-Tech, Inc
- PT Triguna Mandala
- General Monitors
- Zhengzhou Winsen Electronics Technology Co., Ltd
Significant H2S Sensors Industry Milestones
- 2019: Introduction of advanced electrochemical H2S sensors with extended lifespan and improved accuracy by major manufacturers.
- 2020: Increased adoption of IoT-enabled H2S sensors for remote monitoring in the Oil & Gas sector, following a major industrial incident.
- 2021: Release of compact and portable multi-gas detectors featuring enhanced H2S sensing capabilities.
- 2022: Significant M&A activity as larger companies acquire smaller innovators to strengthen their product portfolios.
- 2023: Development of H2S sensors with enhanced resistance to challenging environmental conditions like high humidity and extreme temperatures.
- 2024: Growing emphasis on cloud-based data analytics platforms for H2S sensor networks to enable predictive maintenance and early warning systems.
Future Outlook for H2S Sensors Market
The future outlook for the H2S sensors market is exceptionally bright, poised for continued robust growth driven by escalating safety and environmental concerns globally. The increasing adoption of renewable energy sources, such as biogas, will present significant new opportunities. Furthermore, advancements in miniaturization, smart connectivity, and AI-driven analytics will lead to more integrated and proactive safety solutions. Strategic opportunities lie in developing application-specific sensors for emerging industries and expanding market reach into developing economies with rapidly evolving industrial safety standards. The market is expected to witness sustained innovation and consolidation, shaping a more efficient and safer industrial landscape.
H2S Sensors Segmentation
-
1. Application
- 1.1. Wastewater
- 1.2. Oil & Gas
- 1.3. Biogas
- 1.4. Others
-
2. Types
- 2.1. Detection Range: 0-20ppm
- 2.2. Detection Range: 0-50ppm
- 2.3. Detection Range: 0-100ppm
H2S Sensors Segmentation By Geography
-
1. North America
- 1.1. United States
- 1.2. Canada
- 1.3. Mexico
-
2. South America
- 2.1. Brazil
- 2.2. Argentina
- 2.3. Rest of South America
-
3. Europe
- 3.1. United Kingdom
- 3.2. Germany
- 3.3. France
- 3.4. Italy
- 3.5. Spain
- 3.6. Russia
- 3.7. Benelux
- 3.8. Nordics
- 3.9. Rest of Europe
-
4. Middle East & Africa
- 4.1. Turkey
- 4.2. Israel
- 4.3. GCC
- 4.4. North Africa
- 4.5. South Africa
- 4.6. Rest of Middle East & Africa
-
5. Asia Pacific
- 5.1. China
- 5.2. India
- 5.3. Japan
- 5.4. South Korea
- 5.5. ASEAN
- 5.6. Oceania
- 5.7. Rest of Asia Pacific
H2S Sensors Regional Market Share
Geographic Coverage of H2S Sensors
H2S Sensors REPORT HIGHLIGHTS
| Aspects | Details |
|---|---|
| Study Period | 2020-2034 |
| Base Year | 2025 |
| Estimated Year | 2026 |
| Forecast Period | 2026-2034 |
| Historical Period | 2020-2025 |
| Growth Rate | CAGR of 6.7% from 2020-2034 |
| Segmentation |
|
Table of Contents
- 1. Introduction
- 1.1. Research Scope
- 1.2. Market Segmentation
- 1.3. Research Objective
- 1.4. Definitions and Assumptions
- 2. Executive Summary
- 2.1. Market Snapshot
- 3. Market Dynamics
- 3.1. Market Drivers
- 3.2. Market Restrains
- 3.3. Market Trends
- 3.4. Market Opportunities
- 4. Market Factor Analysis
- 4.1. Porters Five Forces
- 4.1.1. Bargaining Power of Suppliers
- 4.1.2. Bargaining Power of Buyers
- 4.1.3. Threat of New Entrants
- 4.1.4. Threat of Substitutes
- 4.1.5. Competitive Rivalry
- 4.2. PESTEL analysis
- 4.3. BCG Analysis
- 4.3.1. Stars (High Growth, High Market Share)
- 4.3.2. Cash Cows (Low Growth, High Market Share)
- 4.3.3. Question Mark (High Growth, Low Market Share)
- 4.3.4. Dogs (Low Growth, Low Market Share)
- 4.4. Ansoff Matrix Analysis
- 4.5. Supply Chain Analysis
- 4.6. Regulatory Landscape
- 4.7. Current Market Potential and Opportunity Assessment (TAM–SAM–SOM Framework)
- 4.8. TIR Analyst Note
- 4.1. Porters Five Forces
- 5. Market Analysis, Insights and Forecast 2021-2033
- 5.1. Market Analysis, Insights and Forecast - by Application
- 5.1.1. Wastewater
- 5.1.2. Oil & Gas
- 5.1.3. Biogas
- 5.1.4. Others
- 5.2. Market Analysis, Insights and Forecast - by Types
- 5.2.1. Detection Range: 0-20ppm
- 5.2.2. Detection Range: 0-50ppm
- 5.2.3. Detection Range: 0-100ppm
- 5.3. Market Analysis, Insights and Forecast - by Region
- 5.3.1. North America
- 5.3.2. South America
- 5.3.3. Europe
- 5.3.4. Middle East & Africa
- 5.3.5. Asia Pacific
- 5.1. Market Analysis, Insights and Forecast - by Application
- 6. Global H2S Sensors Analysis, Insights and Forecast, 2021-2033
- 6.1. Market Analysis, Insights and Forecast - by Application
- 6.1.1. Wastewater
- 6.1.2. Oil & Gas
- 6.1.3. Biogas
- 6.1.4. Others
- 6.2. Market Analysis, Insights and Forecast - by Types
- 6.2.1. Detection Range: 0-20ppm
- 6.2.2. Detection Range: 0-50ppm
- 6.2.3. Detection Range: 0-100ppm
- 6.1. Market Analysis, Insights and Forecast - by Application
- 7. North America H2S Sensors Analysis, Insights and Forecast, 2020-2032
- 7.1. Market Analysis, Insights and Forecast - by Application
- 7.1.1. Wastewater
- 7.1.2. Oil & Gas
- 7.1.3. Biogas
- 7.1.4. Others
- 7.2. Market Analysis, Insights and Forecast - by Types
- 7.2.1. Detection Range: 0-20ppm
- 7.2.2. Detection Range: 0-50ppm
- 7.2.3. Detection Range: 0-100ppm
- 7.1. Market Analysis, Insights and Forecast - by Application
- 8. South America H2S Sensors Analysis, Insights and Forecast, 2020-2032
- 8.1. Market Analysis, Insights and Forecast - by Application
- 8.1.1. Wastewater
- 8.1.2. Oil & Gas
- 8.1.3. Biogas
- 8.1.4. Others
- 8.2. Market Analysis, Insights and Forecast - by Types
- 8.2.1. Detection Range: 0-20ppm
- 8.2.2. Detection Range: 0-50ppm
- 8.2.3. Detection Range: 0-100ppm
- 8.1. Market Analysis, Insights and Forecast - by Application
- 9. Europe H2S Sensors Analysis, Insights and Forecast, 2020-2032
- 9.1. Market Analysis, Insights and Forecast - by Application
- 9.1.1. Wastewater
- 9.1.2. Oil & Gas
- 9.1.3. Biogas
- 9.1.4. Others
- 9.2. Market Analysis, Insights and Forecast - by Types
- 9.2.1. Detection Range: 0-20ppm
- 9.2.2. Detection Range: 0-50ppm
- 9.2.3. Detection Range: 0-100ppm
- 9.1. Market Analysis, Insights and Forecast - by Application
- 10. Middle East & Africa H2S Sensors Analysis, Insights and Forecast, 2020-2032
- 10.1. Market Analysis, Insights and Forecast - by Application
- 10.1.1. Wastewater
- 10.1.2. Oil & Gas
- 10.1.3. Biogas
- 10.1.4. Others
- 10.2. Market Analysis, Insights and Forecast - by Types
- 10.2.1. Detection Range: 0-20ppm
- 10.2.2. Detection Range: 0-50ppm
- 10.2.3. Detection Range: 0-100ppm
- 10.1. Market Analysis, Insights and Forecast - by Application
- 11. Asia Pacific H2S Sensors Analysis, Insights and Forecast, 2020-2032
- 11.1. Market Analysis, Insights and Forecast - by Application
- 11.1.1. Wastewater
- 11.1.2. Oil & Gas
- 11.1.3. Biogas
- 11.1.4. Others
- 11.2. Market Analysis, Insights and Forecast - by Types
- 11.2.1. Detection Range: 0-20ppm
- 11.2.2. Detection Range: 0-50ppm
- 11.2.3. Detection Range: 0-100ppm
- 11.1. Market Analysis, Insights and Forecast - by Application
- 12. Competitive Analysis
- 12.1. Company Profiles
- 12.1.1 Unisense
- 12.1.1.1. Company Overview
- 12.1.1.2. Products
- 12.1.1.3. Company Financials
- 12.1.1.4. SWOT Analysis
- 12.1.2 AMT Analysenmesstechnik GmbH
- 12.1.2.1. Company Overview
- 12.1.2.2. Products
- 12.1.2.3. Company Financials
- 12.1.2.4. SWOT Analysis
- 12.1.3 Honeywell
- 12.1.3.1. Company Overview
- 12.1.3.2. Products
- 12.1.3.3. Company Financials
- 12.1.3.4. SWOT Analysis
- 12.1.4 Alphasense
- 12.1.4.1. Company Overview
- 12.1.4.2. Products
- 12.1.4.3. Company Financials
- 12.1.4.4. SWOT Analysis
- 12.1.5 SGX Sensortech
- 12.1.5.1. Company Overview
- 12.1.5.2. Products
- 12.1.5.3. Company Financials
- 12.1.5.4. SWOT Analysis
- 12.1.6 DD-Scientific
- 12.1.6.1. Company Overview
- 12.1.6.2. Products
- 12.1.6.3. Company Financials
- 12.1.6.4. SWOT Analysis
- 12.1.7 Nemoto Sensor Engineering Company Limited
- 12.1.7.1. Company Overview
- 12.1.7.2. Products
- 12.1.7.3. Company Financials
- 12.1.7.4. SWOT Analysis
- 12.1.8 RKI Instruments
- 12.1.8.1. Company Overview
- 12.1.8.2. Products
- 12.1.8.3. Company Financials
- 12.1.8.4. SWOT Analysis
- 12.1.9 Inc (Riken Keiki Co. Ltd)
- 12.1.9.1. Company Overview
- 12.1.9.2. Products
- 12.1.9.3. Company Financials
- 12.1.9.4. SWOT Analysis
- 12.1.10 MEMBRAPOR
- 12.1.10.1. Company Overview
- 12.1.10.2. Products
- 12.1.10.3. Company Financials
- 12.1.10.4. SWOT Analysis
- 12.1.11 Gastec Corporation
- 12.1.11.1. Company Overview
- 12.1.11.2. Products
- 12.1.11.3. Company Financials
- 12.1.11.4. SWOT Analysis
- 12.1.12 City Technology Ltd
- 12.1.12.1. Company Overview
- 12.1.12.2. Products
- 12.1.12.3. Company Financials
- 12.1.12.4. SWOT Analysis
- 12.1.13 Franatech
- 12.1.13.1. Company Overview
- 12.1.13.2. Products
- 12.1.13.3. Company Financials
- 12.1.13.4. SWOT Analysis
- 12.1.14 MSA Safety Incorporated
- 12.1.14.1. Company Overview
- 12.1.14.2. Products
- 12.1.14.3. Company Financials
- 12.1.14.4. SWOT Analysis
- 12.1.15 Pem-Tech
- 12.1.15.1. Company Overview
- 12.1.15.2. Products
- 12.1.15.3. Company Financials
- 12.1.15.4. SWOT Analysis
- 12.1.16 Inc
- 12.1.16.1. Company Overview
- 12.1.16.2. Products
- 12.1.16.3. Company Financials
- 12.1.16.4. SWOT Analysis
- 12.1.17 PT Triguna Mandala
- 12.1.17.1. Company Overview
- 12.1.17.2. Products
- 12.1.17.3. Company Financials
- 12.1.17.4. SWOT Analysis
- 12.1.18 General Monitors
- 12.1.18.1. Company Overview
- 12.1.18.2. Products
- 12.1.18.3. Company Financials
- 12.1.18.4. SWOT Analysis
- 12.1.19 Zhengzhou Winsen Electronics Technology Co.
- 12.1.19.1. Company Overview
- 12.1.19.2. Products
- 12.1.19.3. Company Financials
- 12.1.19.4. SWOT Analysis
- 12.1.20 Ltd
- 12.1.20.1. Company Overview
- 12.1.20.2. Products
- 12.1.20.3. Company Financials
- 12.1.20.4. SWOT Analysis
- 12.1.1 Unisense
- 12.2. Market Entropy
- 12.2.1 Company's Key Areas Served
- 12.2.2 Recent Developments
- 12.3. Company Market Share Analysis 2025
- 12.3.1 Top 5 Companies Market Share Analysis
- 12.3.2 Top 3 Companies Market Share Analysis
- 12.4. List of Potential Customers
- 13. Research Methodology
List of Figures
- Figure 1: Global H2S Sensors Revenue Breakdown (undefined, %) by Region 2025 & 2033
- Figure 2: North America H2S Sensors Revenue (undefined), by Application 2025 & 2033
- Figure 3: North America H2S Sensors Revenue Share (%), by Application 2025 & 2033
- Figure 4: North America H2S Sensors Revenue (undefined), by Types 2025 & 2033
- Figure 5: North America H2S Sensors Revenue Share (%), by Types 2025 & 2033
- Figure 6: North America H2S Sensors Revenue (undefined), by Country 2025 & 2033
- Figure 7: North America H2S Sensors Revenue Share (%), by Country 2025 & 2033
- Figure 8: South America H2S Sensors Revenue (undefined), by Application 2025 & 2033
- Figure 9: South America H2S Sensors Revenue Share (%), by Application 2025 & 2033
- Figure 10: South America H2S Sensors Revenue (undefined), by Types 2025 & 2033
- Figure 11: South America H2S Sensors Revenue Share (%), by Types 2025 & 2033
- Figure 12: South America H2S Sensors Revenue (undefined), by Country 2025 & 2033
- Figure 13: South America H2S Sensors Revenue Share (%), by Country 2025 & 2033
- Figure 14: Europe H2S Sensors Revenue (undefined), by Application 2025 & 2033
- Figure 15: Europe H2S Sensors Revenue Share (%), by Application 2025 & 2033
- Figure 16: Europe H2S Sensors Revenue (undefined), by Types 2025 & 2033
- Figure 17: Europe H2S Sensors Revenue Share (%), by Types 2025 & 2033
- Figure 18: Europe H2S Sensors Revenue (undefined), by Country 2025 & 2033
- Figure 19: Europe H2S Sensors Revenue Share (%), by Country 2025 & 2033
- Figure 20: Middle East & Africa H2S Sensors Revenue (undefined), by Application 2025 & 2033
- Figure 21: Middle East & Africa H2S Sensors Revenue Share (%), by Application 2025 & 2033
- Figure 22: Middle East & Africa H2S Sensors Revenue (undefined), by Types 2025 & 2033
- Figure 23: Middle East & Africa H2S Sensors Revenue Share (%), by Types 2025 & 2033
- Figure 24: Middle East & Africa H2S Sensors Revenue (undefined), by Country 2025 & 2033
- Figure 25: Middle East & Africa H2S Sensors Revenue Share (%), by Country 2025 & 2033
- Figure 26: Asia Pacific H2S Sensors Revenue (undefined), by Application 2025 & 2033
- Figure 27: Asia Pacific H2S Sensors Revenue Share (%), by Application 2025 & 2033
- Figure 28: Asia Pacific H2S Sensors Revenue (undefined), by Types 2025 & 2033
- Figure 29: Asia Pacific H2S Sensors Revenue Share (%), by Types 2025 & 2033
- Figure 30: Asia Pacific H2S Sensors Revenue (undefined), by Country 2025 & 2033
- Figure 31: Asia Pacific H2S Sensors Revenue Share (%), by Country 2025 & 2033
List of Tables
- Table 1: Global H2S Sensors Revenue undefined Forecast, by Application 2020 & 2033
- Table 2: Global H2S Sensors Revenue undefined Forecast, by Types 2020 & 2033
- Table 3: Global H2S Sensors Revenue undefined Forecast, by Region 2020 & 2033
- Table 4: Global H2S Sensors Revenue undefined Forecast, by Application 2020 & 2033
- Table 5: Global H2S Sensors Revenue undefined Forecast, by Types 2020 & 2033
- Table 6: Global H2S Sensors Revenue undefined Forecast, by Country 2020 & 2033
- Table 7: United States H2S Sensors Revenue (undefined) Forecast, by Application 2020 & 2033
- Table 8: Canada H2S Sensors Revenue (undefined) Forecast, by Application 2020 & 2033
- Table 9: Mexico H2S Sensors Revenue (undefined) Forecast, by Application 2020 & 2033
- Table 10: Global H2S Sensors Revenue undefined Forecast, by Application 2020 & 2033
- Table 11: Global H2S Sensors Revenue undefined Forecast, by Types 2020 & 2033
- Table 12: Global H2S Sensors Revenue undefined Forecast, by Country 2020 & 2033
- Table 13: Brazil H2S Sensors Revenue (undefined) Forecast, by Application 2020 & 2033
- Table 14: Argentina H2S Sensors Revenue (undefined) Forecast, by Application 2020 & 2033
- Table 15: Rest of South America H2S Sensors Revenue (undefined) Forecast, by Application 2020 & 2033
- Table 16: Global H2S Sensors Revenue undefined Forecast, by Application 2020 & 2033
- Table 17: Global H2S Sensors Revenue undefined Forecast, by Types 2020 & 2033
- Table 18: Global H2S Sensors Revenue undefined Forecast, by Country 2020 & 2033
- Table 19: United Kingdom H2S Sensors Revenue (undefined) Forecast, by Application 2020 & 2033
- Table 20: Germany H2S Sensors Revenue (undefined) Forecast, by Application 2020 & 2033
- Table 21: France H2S Sensors Revenue (undefined) Forecast, by Application 2020 & 2033
- Table 22: Italy H2S Sensors Revenue (undefined) Forecast, by Application 2020 & 2033
- Table 23: Spain H2S Sensors Revenue (undefined) Forecast, by Application 2020 & 2033
- Table 24: Russia H2S Sensors Revenue (undefined) Forecast, by Application 2020 & 2033
- Table 25: Benelux H2S Sensors Revenue (undefined) Forecast, by Application 2020 & 2033
- Table 26: Nordics H2S Sensors Revenue (undefined) Forecast, by Application 2020 & 2033
- Table 27: Rest of Europe H2S Sensors Revenue (undefined) Forecast, by Application 2020 & 2033
- Table 28: Global H2S Sensors Revenue undefined Forecast, by Application 2020 & 2033
- Table 29: Global H2S Sensors Revenue undefined Forecast, by Types 2020 & 2033
- Table 30: Global H2S Sensors Revenue undefined Forecast, by Country 2020 & 2033
- Table 31: Turkey H2S Sensors Revenue (undefined) Forecast, by Application 2020 & 2033
- Table 32: Israel H2S Sensors Revenue (undefined) Forecast, by Application 2020 & 2033
- Table 33: GCC H2S Sensors Revenue (undefined) Forecast, by Application 2020 & 2033
- Table 34: North Africa H2S Sensors Revenue (undefined) Forecast, by Application 2020 & 2033
- Table 35: South Africa H2S Sensors Revenue (undefined) Forecast, by Application 2020 & 2033
- Table 36: Rest of Middle East & Africa H2S Sensors Revenue (undefined) Forecast, by Application 2020 & 2033
- Table 37: Global H2S Sensors Revenue undefined Forecast, by Application 2020 & 2033
- Table 38: Global H2S Sensors Revenue undefined Forecast, by Types 2020 & 2033
- Table 39: Global H2S Sensors Revenue undefined Forecast, by Country 2020 & 2033
- Table 40: China H2S Sensors Revenue (undefined) Forecast, by Application 2020 & 2033
- Table 41: India H2S Sensors Revenue (undefined) Forecast, by Application 2020 & 2033
- Table 42: Japan H2S Sensors Revenue (undefined) Forecast, by Application 2020 & 2033
- Table 43: South Korea H2S Sensors Revenue (undefined) Forecast, by Application 2020 & 2033
- Table 44: ASEAN H2S Sensors Revenue (undefined) Forecast, by Application 2020 & 2033
- Table 45: Oceania H2S Sensors Revenue (undefined) Forecast, by Application 2020 & 2033
- Table 46: Rest of Asia Pacific H2S Sensors Revenue (undefined) Forecast, by Application 2020 & 2033
Frequently Asked Questions
1. What is the projected Compound Annual Growth Rate (CAGR) of the H2S Sensors?
The projected CAGR is approximately 6.7%.
2. Which companies are prominent players in the H2S Sensors?
Key companies in the market include Unisense, AMT Analysenmesstechnik GmbH, Honeywell, Alphasense, SGX Sensortech, DD-Scientific, Nemoto Sensor Engineering Company Limited, RKI Instruments, Inc (Riken Keiki Co. Ltd), MEMBRAPOR, Gastec Corporation, City Technology Ltd, Franatech, MSA Safety Incorporated, Pem-Tech, Inc, PT Triguna Mandala, General Monitors, Zhengzhou Winsen Electronics Technology Co., Ltd.
3. What are the main segments of the H2S Sensors?
The market segments include Application, Types.
4. Can you provide details about the market size?
The market size is estimated to be USD XXX N/A as of 2022.
5. What are some drivers contributing to market growth?
N/A
6. What are the notable trends driving market growth?
N/A
7. Are there any restraints impacting market growth?
N/A
8. Can you provide examples of recent developments in the market?
N/A
9. What pricing options are available for accessing the report?
Pricing options include single-user, multi-user, and enterprise licenses priced at USD 2900.00, USD 4350.00, and USD 5800.00 respectively.
10. Is the market size provided in terms of value or volume?
The market size is provided in terms of value, measured in N/A.
11. Are there any specific market keywords associated with the report?
Yes, the market keyword associated with the report is "H2S Sensors," which aids in identifying and referencing the specific market segment covered.
12. How do I determine which pricing option suits my needs best?
The pricing options vary based on user requirements and access needs. Individual users may opt for single-user licenses, while businesses requiring broader access may choose multi-user or enterprise licenses for cost-effective access to the report.
13. Are there any additional resources or data provided in the H2S Sensors report?
While the report offers comprehensive insights, it's advisable to review the specific contents or supplementary materials provided to ascertain if additional resources or data are available.
14. How can I stay updated on further developments or reports in the H2S Sensors?
To stay informed about further developments, trends, and reports in the H2S Sensors, consider subscribing to industry newsletters, following relevant companies and organizations, or regularly checking reputable industry news sources and publications.
Methodology
Step 1 - Identification of Relevant Samples Size from Population Database


Step 2 - Approaches for Defining Global Market Size (Value, Volume* & Price*)

Note*: In applicable scenarios
Step 3 - Data Sources
Primary Research
- Web Analytics
- Survey Reports
- Research Institute
- Latest Research Reports
- Opinion Leaders
Secondary Research
- Annual Reports
- White Paper
- Latest Press Release
- Industry Association
- Paid Database
- Investor Presentations

Step 4 - Data Triangulation
Involves using different sources of information in order to increase the validity of a study
These sources are likely to be stakeholders in a program - participants, other researchers, program staff, other community members, and so on.
Then we put all data in single framework & apply various statistical tools to find out the dynamic on the market.
During the analysis stage, feedback from the stakeholder groups would be compared to determine areas of agreement as well as areas of divergence