

Key Insights
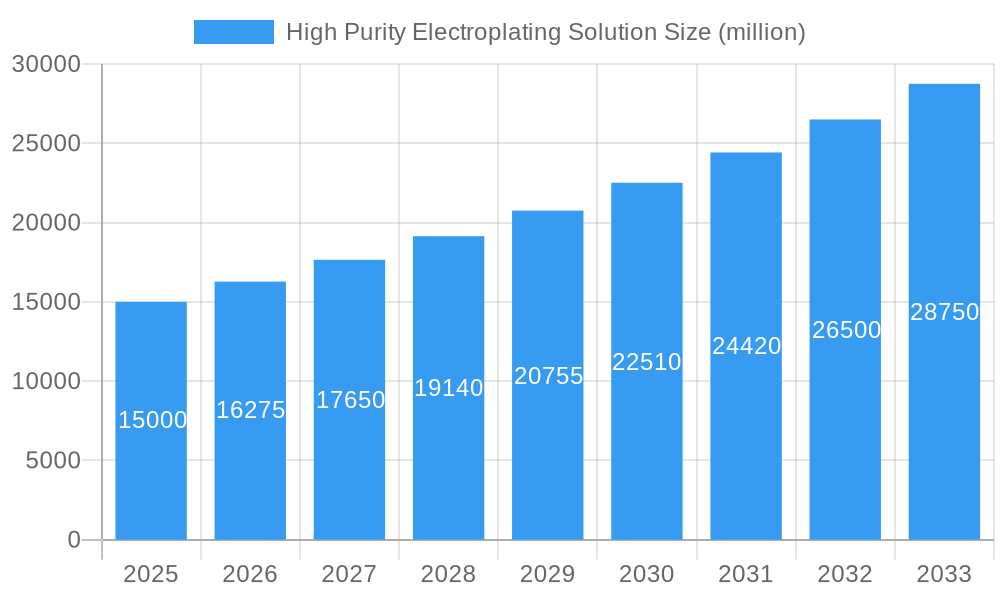
The High Purity Electroplating Solution market is poised for significant expansion, projected to reach a substantial market size of approximately USD 15,000 million by 2025, with an estimated Compound Annual Growth Rate (CAGR) of around 8.5% during the forecast period of 2025-2033. This robust growth is primarily fueled by the escalating demand from the semiconductor industry, which relies heavily on high-purity electroplating solutions for intricate wafer fabrication and advanced packaging processes. The increasing miniaturization of electronic components and the proliferation of sophisticated integrated circuits in consumer electronics, automotive, and telecommunications sectors are key drivers behind this demand. Furthermore, the burgeoning solar cell grid market, seeking efficient and durable conductive layers, also contributes to the market's upward trajectory. The increasing need for specialized solutions in various applications, including printed circuit boards (PCBs) and connectors, further solidifies the market's growth potential.
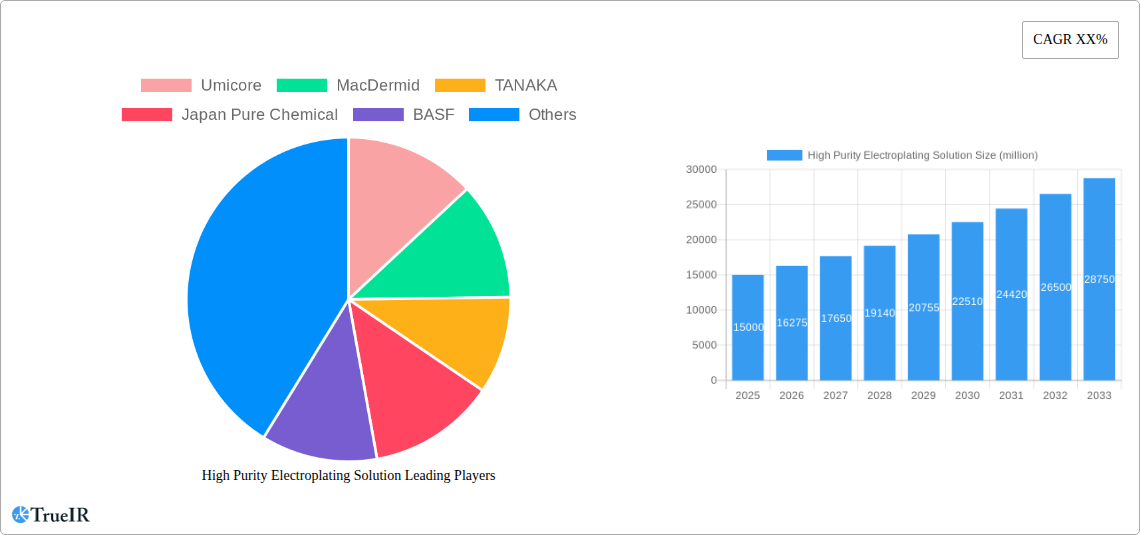
High Purity Electroplating Solution Market Size (In Billion)
The market is characterized by a dynamic competitive landscape with leading companies like Umicore, MacDermid, TANAKA, and BASF actively investing in research and development to innovate advanced electroplating formulations. Trends such as the development of eco-friendly and sustainable electroplating solutions, driven by increasing environmental regulations and corporate sustainability initiatives, are shaping the market. The emphasis on achieving ultra-high purity levels to meet the stringent requirements of advanced semiconductor manufacturing is another prominent trend. However, the market faces certain restraints, including the high cost of raw materials, particularly noble metals like gold, and the complex manufacturing processes involved in producing these high-purity solutions. Nevertheless, the strong underlying demand from the rapidly evolving electronics and renewable energy sectors, coupled with continuous technological advancements, is expected to overcome these challenges, ensuring sustained market growth and opportunities for key players.
High Purity Electroplating Solution Company Market Share
High Purity Electroplating Solution Market Structure & Competitive Landscape
The high purity electroplating solution market is characterized by a moderately concentrated competitive landscape, driven by intense innovation and stringent regulatory requirements for critical applications like semiconductor manufacturing and solar energy. Key players, including Umicore, MacDermid, TANAKA, Japan Pure Chemical, BASF, Technic, and Mitsubishi Materials Corporation, exert significant influence. Market concentration is evident in the substantial market share held by these leading entities, estimated to be around 65% by the base year of 2025. Innovation drivers revolve around enhancing plating uniformity, reducing defect rates, and developing environmentally friendly formulations. Regulatory impacts are substantial, with strict adherence to REACH and RoHS directives influencing product development and market entry. Product substitutes, while limited in high-end semiconductor applications, exist in less demanding sectors. End-user segmentation reveals the semiconductor industry as the dominant segment, followed by solar cell grids and other industrial applications. Mergers and acquisitions (M&A) trends, with an estimated XX million in M&A volumes between 2019 and 2024, reflect a strategic consolidation to gain market share and technological expertise.
High Purity Electroplating Solution Market Trends & Opportunities
The global high purity electroplating solution market is poised for robust growth, projected to expand at a Compound Annual Growth Rate (CAGR) of approximately 8.5% from 2025 to 2033, reaching an estimated market size of over one million million dollars by 2033. This significant market expansion is fueled by an insatiable demand from the semiconductor industry, which requires increasingly sophisticated electroplating solutions for advanced chip fabrication. Technological shifts are paramount, with a growing emphasis on developing ultra-high purity plating chemistries that minimize metallic impurities to parts-per-trillion (ppt) levels, crucial for enabling smaller feature sizes and improved device performance. Advancements in additive technologies and bath monitoring systems are also driving efficiency and reliability. Consumer preferences, particularly within the electronics sector, are dictating a higher demand for performance-driven solutions that contribute to enhanced device longevity and reduced failure rates. The competitive dynamics are intensifying, with companies continuously investing in R&D to differentiate their offerings and secure a competitive edge. Emerging opportunities lie in the development of novel electroplating solutions for next-generation semiconductor nodes, as well as for advanced packaging technologies. Furthermore, the growing adoption of renewable energy sources, particularly solar photovoltaic (PV) cells, is creating a substantial demand for specialized electroplating solutions for solar cell grids, offering another significant growth avenue. The market penetration rate for high purity electroplating solutions in the semiconductor segment is already high, estimated at over 90%, while its penetration in the solar cell grid segment is rapidly increasing, projected to reach 60% by 2033. The "Other" application segment, encompassing aerospace, automotive, and medical devices, is also witnessing steady growth due to the increasing need for corrosion resistance, wear resistance, and decorative finishes in these industries.
Dominant Markets & Segments in High Purity Electroplating Solution
The Semiconductor Industry stands as the undisputed dominant application segment within the high purity electroplating solution market, accounting for an estimated 70% of the total market share by 2025. This dominance is driven by the relentless pursuit of miniaturization and enhanced functionality in microelectronics. Key growth drivers within this segment include the escalating demand for advanced logic chips, memory devices, and integrated circuits in consumer electronics, artificial intelligence, 5G technology, and high-performance computing. Government initiatives and substantial investments in semiconductor manufacturing facilities worldwide, particularly in regions like the United States, Europe, and Asia-Pacific, further propel this growth.
Within the Types of solutions, Copper Electroplating Solution commands a significant share, estimated at over 50% of the market by 2025, owing to its critical role in forming conductive interconnects within integrated circuits. Gold Electroplating Solution follows, essential for its superior conductivity and corrosion resistance in high-reliability applications, capturing an estimated 20% of the market. Tin Electroplating Solution holds a substantial position, particularly in lead-free solder applications and for corrosion protection, estimated at 15% of the market share. The "Other" types, encompassing specialized solutions for precious metal plating and other niche applications, contribute the remaining portion.
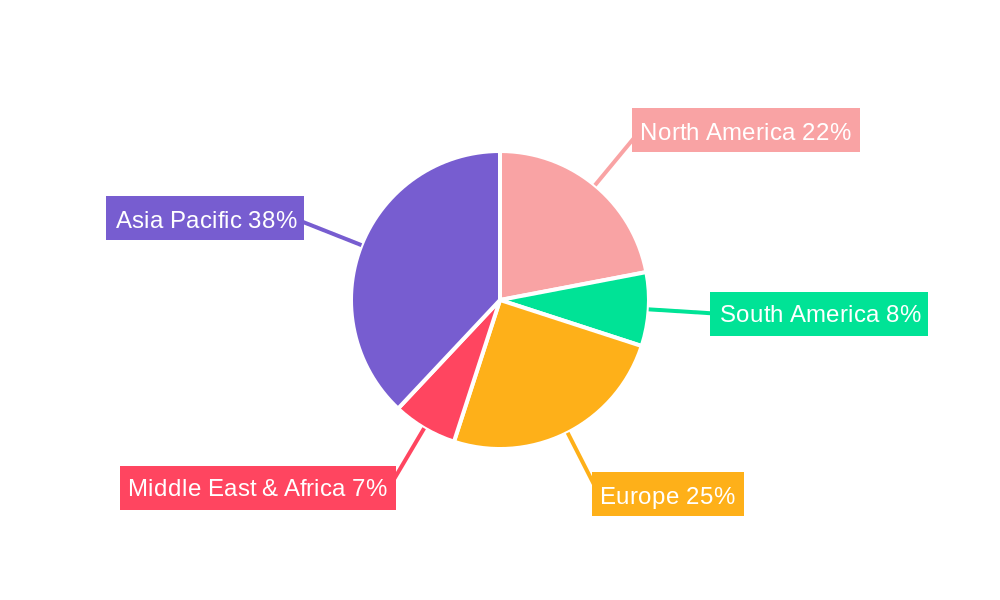
Geographically, Asia-Pacific is the dominant region, driven by its established leadership in semiconductor manufacturing and the burgeoning solar energy sector, accounting for over 60% of the global market by 2025. Countries like Taiwan, South Korea, China, and Japan are major consumers and producers of high purity electroplating solutions. North America and Europe are also significant markets, driven by their advanced research and development capabilities and the presence of major semiconductor fabrication plants. Key growth drivers in these regions include supportive government policies, increased R&D investments, and the growing demand for advanced electronic components.
High Purity Electroplating Solution Product Analysis
High purity electroplating solutions are continuously evolving with a focus on ultra-low impurity levels, enhanced bath stability, and environmentally sustainable formulations. Innovations in additive packages are crucial for achieving superior deposit properties, such as excellent throwing power, uniform thickness, and minimized void formation in intricate semiconductor structures. These solutions find critical applications in the semiconductor industry for creating conductive vias, interconnects, and damascene structures, as well as in the solar cell industry for fabricating efficient grid lines. Competitive advantages are derived from the ability to meet stringent ppb (parts per billion) and ppt (parts per trillion) purity standards, offering superior performance in demanding fabrication processes and contributing to improved device yield and reliability.
Key Drivers, Barriers & Challenges in High Purity Electroplating Solution
Key Drivers:
- Rapid Advancement in Semiconductor Technology: The continuous push for smaller, more powerful, and energy-efficient microchips necessitates ultra-high purity electroplating solutions to enable finer feature sizes and advanced interconnects.
- Growth of the Renewable Energy Sector: The expanding solar photovoltaic (PV) market requires advanced electroplating solutions for efficient and durable solar cell grids, driving demand for copper and silver plating chemistries.
- Technological Innovation in Plating Processes: Development of new additive technologies, plating chemistries, and real-time bath monitoring systems enhances deposition quality and process efficiency.
- Increasing Demand for High-Reliability Components: Sectors like automotive, aerospace, and medical devices require electroplated components with superior corrosion resistance, wear resistance, and conductivity.
Challenges Impacting High Purity Electroplating Solution Growth:
- Stringent Purity Requirements: Achieving and maintaining the extremely high purity levels demanded by the semiconductor industry is technically challenging and increases manufacturing costs.
- Environmental Regulations and Compliance: Growing environmental concerns and regulations regarding the use of certain chemicals and waste disposal necessitate the development of eco-friendly alternatives, adding R&D complexities.
- Supply Chain Disruptions and Raw Material Volatility: Global supply chain vulnerabilities and price fluctuations of key raw materials like precious metals can impact production costs and availability.
- High Capital Investment for R&D and Manufacturing: Developing and producing high purity electroplating solutions requires significant investment in specialized equipment, facilities, and skilled personnel.
Growth Drivers in the High Purity Electroplating Solution Market
The high purity electroplating solution market is propelled by several key drivers. Technologically, the relentless miniaturization in the semiconductor industry, requiring increasingly complex interconnects and advanced packaging, is a primary catalyst. Economically, the massive global investments in semiconductor fabrication facilities and the burgeoning renewable energy sector, particularly solar power, create sustained demand. Regulatory factors, such as government support for advanced manufacturing and energy independence initiatives, also play a crucial role in stimulating market growth and innovation in this sector.
Challenges Impacting High Purity Electroplating Solution Growth
Several challenges can impact the growth trajectory of the high purity electroplating solution market. Regulatory complexities surrounding hazardous materials and waste disposal continue to pose hurdles, requiring constant adaptation and investment in greener alternatives. Supply chain issues, especially concerning the availability and price volatility of critical raw materials, can disrupt production and impact cost-effectiveness. Furthermore, intense competitive pressures among established players and emerging niche manufacturers can lead to price erosion and a need for continuous innovation to maintain market share.
Key Players Shaping the High Purity Electroplating Solution Market
- Umicore
- MacDermid
- TANAKA
- Japan Pure Chemical
- BASF
- Technic
- Mitsubishi Materials Corporation
- Shanghai Sinyang Semiconductor Materials
- DuPont
- ADEKA
- Jiangsu Aisen Semiconductor Material
- Resound Technology
- PhiChem Corporation
- Anji Microelectronics Technology (Shanghai)
- Daiwa Fine Chemicals
- NB Technologies
- Krohn Industries
- Transene
Significant High Purity Electroplating Solution Industry Milestones
- 2019: Increased adoption of advanced plating chemistries for EUV lithography enabling smaller semiconductor nodes.
- 2020: Significant growth in demand for high purity copper electroplating solutions for advanced solar cell technologies.
- 2021: Major players report substantial R&D investments in next-generation plating materials to meet evolving semiconductor requirements.
- 2022: Several mergers and acquisitions observed as companies seek to consolidate market share and expand technological portfolios.
- 2023 (H1): Focus on developing more sustainable and environmentally friendly electroplating solutions intensifies.
- 2023 (H2): Emergence of novel plating formulations for advanced packaging solutions in the electronics industry.
- 2024 (Q1-Q4): Continued robust demand from the semiconductor sector, driving innovation in ultra-high purity materials.
Future Outlook for High Purity Electroplating Solution Market
The future outlook for the high purity electroplating solution market is exceptionally promising, driven by continued technological advancements in semiconductors and the global push towards renewable energy. Strategic opportunities lie in developing solutions for advanced 3D chip architectures, heterogeneous integration, and next-generation solar technologies. The market is expected to witness sustained growth in demand for ultra-high purity materials, with a strong emphasis on environmental sustainability and process efficiency. Companies that can innovate rapidly and align their product development with the evolving needs of these critical industries are well-positioned for significant success.
High Purity Electroplating Solution Segmentation
-
1. Application
- 1.1. Semiconductor Industry
- 1.2. Solar Cell Grid
- 1.3. Other
-
2. Types
- 2.1. Copper Electroplating Solution
- 2.2. Gold Electroplating Solution
- 2.3. Tin Electroplating Solution
- 2.4. Other
High Purity Electroplating Solution Segmentation By Geography
-
1. North America
- 1.1. United States
- 1.2. Canada
- 1.3. Mexico
-
2. South America
- 2.1. Brazil
- 2.2. Argentina
- 2.3. Rest of South America
-
3. Europe
- 3.1. United Kingdom
- 3.2. Germany
- 3.3. France
- 3.4. Italy
- 3.5. Spain
- 3.6. Russia
- 3.7. Benelux
- 3.8. Nordics
- 3.9. Rest of Europe
-
4. Middle East & Africa
- 4.1. Turkey
- 4.2. Israel
- 4.3. GCC
- 4.4. North Africa
- 4.5. South Africa
- 4.6. Rest of Middle East & Africa
-
5. Asia Pacific
- 5.1. China
- 5.2. India
- 5.3. Japan
- 5.4. South Korea
- 5.5. ASEAN
- 5.6. Oceania
- 5.7. Rest of Asia Pacific
High Purity Electroplating Solution Regional Market Share
Geographic Coverage of High Purity Electroplating Solution
High Purity Electroplating Solution REPORT HIGHLIGHTS
| Aspects | Details |
|---|---|
| Study Period | 2020-2034 |
| Base Year | 2025 |
| Estimated Year | 2026 |
| Forecast Period | 2026-2034 |
| Historical Period | 2020-2025 |
| Growth Rate | CAGR of 9% from 2020-2034 |
| Segmentation |
|
Table of Contents
- 1. Introduction
- 1.1. Research Scope
- 1.2. Market Segmentation
- 1.3. Research Objective
- 1.4. Definitions and Assumptions
- 2. Executive Summary
- 2.1. Market Snapshot
- 3. Market Dynamics
- 3.1. Market Drivers
- 3.2. Market Restrains
- 3.3. Market Trends
- 3.4. Market Opportunities
- 4. Market Factor Analysis
- 4.1. Porters Five Forces
- 4.1.1. Bargaining Power of Suppliers
- 4.1.2. Bargaining Power of Buyers
- 4.1.3. Threat of New Entrants
- 4.1.4. Threat of Substitutes
- 4.1.5. Competitive Rivalry
- 4.2. PESTEL analysis
- 4.3. BCG Analysis
- 4.3.1. Stars (High Growth, High Market Share)
- 4.3.2. Cash Cows (Low Growth, High Market Share)
- 4.3.3. Question Mark (High Growth, Low Market Share)
- 4.3.4. Dogs (Low Growth, Low Market Share)
- 4.4. Ansoff Matrix Analysis
- 4.5. Supply Chain Analysis
- 4.6. Regulatory Landscape
- 4.7. Current Market Potential and Opportunity Assessment (TAM–SAM–SOM Framework)
- 4.8. TIR Analyst Note
- 4.1. Porters Five Forces
- 5. Market Analysis, Insights and Forecast 2021-2033
- 5.1. Market Analysis, Insights and Forecast - by Application
- 5.1.1. Semiconductor Industry
- 5.1.2. Solar Cell Grid
- 5.1.3. Other
- 5.2. Market Analysis, Insights and Forecast - by Types
- 5.2.1. Copper Electroplating Solution
- 5.2.2. Gold Electroplating Solution
- 5.2.3. Tin Electroplating Solution
- 5.2.4. Other
- 5.3. Market Analysis, Insights and Forecast - by Region
- 5.3.1. North America
- 5.3.2. South America
- 5.3.3. Europe
- 5.3.4. Middle East & Africa
- 5.3.5. Asia Pacific
- 5.1. Market Analysis, Insights and Forecast - by Application
- 6. Global High Purity Electroplating Solution Analysis, Insights and Forecast, 2021-2033
- 6.1. Market Analysis, Insights and Forecast - by Application
- 6.1.1. Semiconductor Industry
- 6.1.2. Solar Cell Grid
- 6.1.3. Other
- 6.2. Market Analysis, Insights and Forecast - by Types
- 6.2.1. Copper Electroplating Solution
- 6.2.2. Gold Electroplating Solution
- 6.2.3. Tin Electroplating Solution
- 6.2.4. Other
- 6.1. Market Analysis, Insights and Forecast - by Application
- 7. North America High Purity Electroplating Solution Analysis, Insights and Forecast, 2020-2032
- 7.1. Market Analysis, Insights and Forecast - by Application
- 7.1.1. Semiconductor Industry
- 7.1.2. Solar Cell Grid
- 7.1.3. Other
- 7.2. Market Analysis, Insights and Forecast - by Types
- 7.2.1. Copper Electroplating Solution
- 7.2.2. Gold Electroplating Solution
- 7.2.3. Tin Electroplating Solution
- 7.2.4. Other
- 7.1. Market Analysis, Insights and Forecast - by Application
- 8. South America High Purity Electroplating Solution Analysis, Insights and Forecast, 2020-2032
- 8.1. Market Analysis, Insights and Forecast - by Application
- 8.1.1. Semiconductor Industry
- 8.1.2. Solar Cell Grid
- 8.1.3. Other
- 8.2. Market Analysis, Insights and Forecast - by Types
- 8.2.1. Copper Electroplating Solution
- 8.2.2. Gold Electroplating Solution
- 8.2.3. Tin Electroplating Solution
- 8.2.4. Other
- 8.1. Market Analysis, Insights and Forecast - by Application
- 9. Europe High Purity Electroplating Solution Analysis, Insights and Forecast, 2020-2032
- 9.1. Market Analysis, Insights and Forecast - by Application
- 9.1.1. Semiconductor Industry
- 9.1.2. Solar Cell Grid
- 9.1.3. Other
- 9.2. Market Analysis, Insights and Forecast - by Types
- 9.2.1. Copper Electroplating Solution
- 9.2.2. Gold Electroplating Solution
- 9.2.3. Tin Electroplating Solution
- 9.2.4. Other
- 9.1. Market Analysis, Insights and Forecast - by Application
- 10. Middle East & Africa High Purity Electroplating Solution Analysis, Insights and Forecast, 2020-2032
- 10.1. Market Analysis, Insights and Forecast - by Application
- 10.1.1. Semiconductor Industry
- 10.1.2. Solar Cell Grid
- 10.1.3. Other
- 10.2. Market Analysis, Insights and Forecast - by Types
- 10.2.1. Copper Electroplating Solution
- 10.2.2. Gold Electroplating Solution
- 10.2.3. Tin Electroplating Solution
- 10.2.4. Other
- 10.1. Market Analysis, Insights and Forecast - by Application
- 11. Asia Pacific High Purity Electroplating Solution Analysis, Insights and Forecast, 2020-2032
- 11.1. Market Analysis, Insights and Forecast - by Application
- 11.1.1. Semiconductor Industry
- 11.1.2. Solar Cell Grid
- 11.1.3. Other
- 11.2. Market Analysis, Insights and Forecast - by Types
- 11.2.1. Copper Electroplating Solution
- 11.2.2. Gold Electroplating Solution
- 11.2.3. Tin Electroplating Solution
- 11.2.4. Other
- 11.1. Market Analysis, Insights and Forecast - by Application
- 12. Competitive Analysis
- 12.1. Company Profiles
- 12.1.1 Umicore
- 12.1.1.1. Company Overview
- 12.1.1.2. Products
- 12.1.1.3. Company Financials
- 12.1.1.4. SWOT Analysis
- 12.1.2 MacDermid
- 12.1.2.1. Company Overview
- 12.1.2.2. Products
- 12.1.2.3. Company Financials
- 12.1.2.4. SWOT Analysis
- 12.1.3 TANAKA
- 12.1.3.1. Company Overview
- 12.1.3.2. Products
- 12.1.3.3. Company Financials
- 12.1.3.4. SWOT Analysis
- 12.1.4 Japan Pure Chemical
- 12.1.4.1. Company Overview
- 12.1.4.2. Products
- 12.1.4.3. Company Financials
- 12.1.4.4. SWOT Analysis
- 12.1.5 BASF
- 12.1.5.1. Company Overview
- 12.1.5.2. Products
- 12.1.5.3. Company Financials
- 12.1.5.4. SWOT Analysis
- 12.1.6 Technic
- 12.1.6.1. Company Overview
- 12.1.6.2. Products
- 12.1.6.3. Company Financials
- 12.1.6.4. SWOT Analysis
- 12.1.7 Mitsubishi Materials Corporation
- 12.1.7.1. Company Overview
- 12.1.7.2. Products
- 12.1.7.3. Company Financials
- 12.1.7.4. SWOT Analysis
- 12.1.8 Shanghai Sinyang Semiconductor Materials
- 12.1.8.1. Company Overview
- 12.1.8.2. Products
- 12.1.8.3. Company Financials
- 12.1.8.4. SWOT Analysis
- 12.1.9 DuPont
- 12.1.9.1. Company Overview
- 12.1.9.2. Products
- 12.1.9.3. Company Financials
- 12.1.9.4. SWOT Analysis
- 12.1.10 ADEKA
- 12.1.10.1. Company Overview
- 12.1.10.2. Products
- 12.1.10.3. Company Financials
- 12.1.10.4. SWOT Analysis
- 12.1.11 Jiangsu Aisen Semiconductor Material
- 12.1.11.1. Company Overview
- 12.1.11.2. Products
- 12.1.11.3. Company Financials
- 12.1.11.4. SWOT Analysis
- 12.1.12 Resound Technology
- 12.1.12.1. Company Overview
- 12.1.12.2. Products
- 12.1.12.3. Company Financials
- 12.1.12.4. SWOT Analysis
- 12.1.13 PhiChem Corporation
- 12.1.13.1. Company Overview
- 12.1.13.2. Products
- 12.1.13.3. Company Financials
- 12.1.13.4. SWOT Analysis
- 12.1.14 Anji Microelectronics Technology (Shanghai)
- 12.1.14.1. Company Overview
- 12.1.14.2. Products
- 12.1.14.3. Company Financials
- 12.1.14.4. SWOT Analysis
- 12.1.15 Daiwa Fine Chemicals
- 12.1.15.1. Company Overview
- 12.1.15.2. Products
- 12.1.15.3. Company Financials
- 12.1.15.4. SWOT Analysis
- 12.1.16 NB Technologies
- 12.1.16.1. Company Overview
- 12.1.16.2. Products
- 12.1.16.3. Company Financials
- 12.1.16.4. SWOT Analysis
- 12.1.17 Krohn Industries
- 12.1.17.1. Company Overview
- 12.1.17.2. Products
- 12.1.17.3. Company Financials
- 12.1.17.4. SWOT Analysis
- 12.1.18 Transene
- 12.1.18.1. Company Overview
- 12.1.18.2. Products
- 12.1.18.3. Company Financials
- 12.1.18.4. SWOT Analysis
- 12.1.1 Umicore
- 12.2. Market Entropy
- 12.2.1 Company's Key Areas Served
- 12.2.2 Recent Developments
- 12.3. Company Market Share Analysis 2025
- 12.3.1 Top 5 Companies Market Share Analysis
- 12.3.2 Top 3 Companies Market Share Analysis
- 12.4. List of Potential Customers
- 13. Research Methodology
List of Figures
- Figure 1: Global High Purity Electroplating Solution Revenue Breakdown (undefined, %) by Region 2025 & 2033
- Figure 2: Global High Purity Electroplating Solution Volume Breakdown (K, %) by Region 2025 & 2033
- Figure 3: North America High Purity Electroplating Solution Revenue (undefined), by Application 2025 & 2033
- Figure 4: North America High Purity Electroplating Solution Volume (K), by Application 2025 & 2033
- Figure 5: North America High Purity Electroplating Solution Revenue Share (%), by Application 2025 & 2033
- Figure 6: North America High Purity Electroplating Solution Volume Share (%), by Application 2025 & 2033
- Figure 7: North America High Purity Electroplating Solution Revenue (undefined), by Types 2025 & 2033
- Figure 8: North America High Purity Electroplating Solution Volume (K), by Types 2025 & 2033
- Figure 9: North America High Purity Electroplating Solution Revenue Share (%), by Types 2025 & 2033
- Figure 10: North America High Purity Electroplating Solution Volume Share (%), by Types 2025 & 2033
- Figure 11: North America High Purity Electroplating Solution Revenue (undefined), by Country 2025 & 2033
- Figure 12: North America High Purity Electroplating Solution Volume (K), by Country 2025 & 2033
- Figure 13: North America High Purity Electroplating Solution Revenue Share (%), by Country 2025 & 2033
- Figure 14: North America High Purity Electroplating Solution Volume Share (%), by Country 2025 & 2033
- Figure 15: South America High Purity Electroplating Solution Revenue (undefined), by Application 2025 & 2033
- Figure 16: South America High Purity Electroplating Solution Volume (K), by Application 2025 & 2033
- Figure 17: South America High Purity Electroplating Solution Revenue Share (%), by Application 2025 & 2033
- Figure 18: South America High Purity Electroplating Solution Volume Share (%), by Application 2025 & 2033
- Figure 19: South America High Purity Electroplating Solution Revenue (undefined), by Types 2025 & 2033
- Figure 20: South America High Purity Electroplating Solution Volume (K), by Types 2025 & 2033
- Figure 21: South America High Purity Electroplating Solution Revenue Share (%), by Types 2025 & 2033
- Figure 22: South America High Purity Electroplating Solution Volume Share (%), by Types 2025 & 2033
- Figure 23: South America High Purity Electroplating Solution Revenue (undefined), by Country 2025 & 2033
- Figure 24: South America High Purity Electroplating Solution Volume (K), by Country 2025 & 2033
- Figure 25: South America High Purity Electroplating Solution Revenue Share (%), by Country 2025 & 2033
- Figure 26: South America High Purity Electroplating Solution Volume Share (%), by Country 2025 & 2033
- Figure 27: Europe High Purity Electroplating Solution Revenue (undefined), by Application 2025 & 2033
- Figure 28: Europe High Purity Electroplating Solution Volume (K), by Application 2025 & 2033
- Figure 29: Europe High Purity Electroplating Solution Revenue Share (%), by Application 2025 & 2033
- Figure 30: Europe High Purity Electroplating Solution Volume Share (%), by Application 2025 & 2033
- Figure 31: Europe High Purity Electroplating Solution Revenue (undefined), by Types 2025 & 2033
- Figure 32: Europe High Purity Electroplating Solution Volume (K), by Types 2025 & 2033
- Figure 33: Europe High Purity Electroplating Solution Revenue Share (%), by Types 2025 & 2033
- Figure 34: Europe High Purity Electroplating Solution Volume Share (%), by Types 2025 & 2033
- Figure 35: Europe High Purity Electroplating Solution Revenue (undefined), by Country 2025 & 2033
- Figure 36: Europe High Purity Electroplating Solution Volume (K), by Country 2025 & 2033
- Figure 37: Europe High Purity Electroplating Solution Revenue Share (%), by Country 2025 & 2033
- Figure 38: Europe High Purity Electroplating Solution Volume Share (%), by Country 2025 & 2033
- Figure 39: Middle East & Africa High Purity Electroplating Solution Revenue (undefined), by Application 2025 & 2033
- Figure 40: Middle East & Africa High Purity Electroplating Solution Volume (K), by Application 2025 & 2033
- Figure 41: Middle East & Africa High Purity Electroplating Solution Revenue Share (%), by Application 2025 & 2033
- Figure 42: Middle East & Africa High Purity Electroplating Solution Volume Share (%), by Application 2025 & 2033
- Figure 43: Middle East & Africa High Purity Electroplating Solution Revenue (undefined), by Types 2025 & 2033
- Figure 44: Middle East & Africa High Purity Electroplating Solution Volume (K), by Types 2025 & 2033
- Figure 45: Middle East & Africa High Purity Electroplating Solution Revenue Share (%), by Types 2025 & 2033
- Figure 46: Middle East & Africa High Purity Electroplating Solution Volume Share (%), by Types 2025 & 2033
- Figure 47: Middle East & Africa High Purity Electroplating Solution Revenue (undefined), by Country 2025 & 2033
- Figure 48: Middle East & Africa High Purity Electroplating Solution Volume (K), by Country 2025 & 2033
- Figure 49: Middle East & Africa High Purity Electroplating Solution Revenue Share (%), by Country 2025 & 2033
- Figure 50: Middle East & Africa High Purity Electroplating Solution Volume Share (%), by Country 2025 & 2033
- Figure 51: Asia Pacific High Purity Electroplating Solution Revenue (undefined), by Application 2025 & 2033
- Figure 52: Asia Pacific High Purity Electroplating Solution Volume (K), by Application 2025 & 2033
- Figure 53: Asia Pacific High Purity Electroplating Solution Revenue Share (%), by Application 2025 & 2033
- Figure 54: Asia Pacific High Purity Electroplating Solution Volume Share (%), by Application 2025 & 2033
- Figure 55: Asia Pacific High Purity Electroplating Solution Revenue (undefined), by Types 2025 & 2033
- Figure 56: Asia Pacific High Purity Electroplating Solution Volume (K), by Types 2025 & 2033
- Figure 57: Asia Pacific High Purity Electroplating Solution Revenue Share (%), by Types 2025 & 2033
- Figure 58: Asia Pacific High Purity Electroplating Solution Volume Share (%), by Types 2025 & 2033
- Figure 59: Asia Pacific High Purity Electroplating Solution Revenue (undefined), by Country 2025 & 2033
- Figure 60: Asia Pacific High Purity Electroplating Solution Volume (K), by Country 2025 & 2033
- Figure 61: Asia Pacific High Purity Electroplating Solution Revenue Share (%), by Country 2025 & 2033
- Figure 62: Asia Pacific High Purity Electroplating Solution Volume Share (%), by Country 2025 & 2033
List of Tables
- Table 1: Global High Purity Electroplating Solution Revenue undefined Forecast, by Application 2020 & 2033
- Table 2: Global High Purity Electroplating Solution Volume K Forecast, by Application 2020 & 2033
- Table 3: Global High Purity Electroplating Solution Revenue undefined Forecast, by Types 2020 & 2033
- Table 4: Global High Purity Electroplating Solution Volume K Forecast, by Types 2020 & 2033
- Table 5: Global High Purity Electroplating Solution Revenue undefined Forecast, by Region 2020 & 2033
- Table 6: Global High Purity Electroplating Solution Volume K Forecast, by Region 2020 & 2033
- Table 7: Global High Purity Electroplating Solution Revenue undefined Forecast, by Application 2020 & 2033
- Table 8: Global High Purity Electroplating Solution Volume K Forecast, by Application 2020 & 2033
- Table 9: Global High Purity Electroplating Solution Revenue undefined Forecast, by Types 2020 & 2033
- Table 10: Global High Purity Electroplating Solution Volume K Forecast, by Types 2020 & 2033
- Table 11: Global High Purity Electroplating Solution Revenue undefined Forecast, by Country 2020 & 2033
- Table 12: Global High Purity Electroplating Solution Volume K Forecast, by Country 2020 & 2033
- Table 13: United States High Purity Electroplating Solution Revenue (undefined) Forecast, by Application 2020 & 2033
- Table 14: United States High Purity Electroplating Solution Volume (K) Forecast, by Application 2020 & 2033
- Table 15: Canada High Purity Electroplating Solution Revenue (undefined) Forecast, by Application 2020 & 2033
- Table 16: Canada High Purity Electroplating Solution Volume (K) Forecast, by Application 2020 & 2033
- Table 17: Mexico High Purity Electroplating Solution Revenue (undefined) Forecast, by Application 2020 & 2033
- Table 18: Mexico High Purity Electroplating Solution Volume (K) Forecast, by Application 2020 & 2033
- Table 19: Global High Purity Electroplating Solution Revenue undefined Forecast, by Application 2020 & 2033
- Table 20: Global High Purity Electroplating Solution Volume K Forecast, by Application 2020 & 2033
- Table 21: Global High Purity Electroplating Solution Revenue undefined Forecast, by Types 2020 & 2033
- Table 22: Global High Purity Electroplating Solution Volume K Forecast, by Types 2020 & 2033
- Table 23: Global High Purity Electroplating Solution Revenue undefined Forecast, by Country 2020 & 2033
- Table 24: Global High Purity Electroplating Solution Volume K Forecast, by Country 2020 & 2033
- Table 25: Brazil High Purity Electroplating Solution Revenue (undefined) Forecast, by Application 2020 & 2033
- Table 26: Brazil High Purity Electroplating Solution Volume (K) Forecast, by Application 2020 & 2033
- Table 27: Argentina High Purity Electroplating Solution Revenue (undefined) Forecast, by Application 2020 & 2033
- Table 28: Argentina High Purity Electroplating Solution Volume (K) Forecast, by Application 2020 & 2033
- Table 29: Rest of South America High Purity Electroplating Solution Revenue (undefined) Forecast, by Application 2020 & 2033
- Table 30: Rest of South America High Purity Electroplating Solution Volume (K) Forecast, by Application 2020 & 2033
- Table 31: Global High Purity Electroplating Solution Revenue undefined Forecast, by Application 2020 & 2033
- Table 32: Global High Purity Electroplating Solution Volume K Forecast, by Application 2020 & 2033
- Table 33: Global High Purity Electroplating Solution Revenue undefined Forecast, by Types 2020 & 2033
- Table 34: Global High Purity Electroplating Solution Volume K Forecast, by Types 2020 & 2033
- Table 35: Global High Purity Electroplating Solution Revenue undefined Forecast, by Country 2020 & 2033
- Table 36: Global High Purity Electroplating Solution Volume K Forecast, by Country 2020 & 2033
- Table 37: United Kingdom High Purity Electroplating Solution Revenue (undefined) Forecast, by Application 2020 & 2033
- Table 38: United Kingdom High Purity Electroplating Solution Volume (K) Forecast, by Application 2020 & 2033
- Table 39: Germany High Purity Electroplating Solution Revenue (undefined) Forecast, by Application 2020 & 2033
- Table 40: Germany High Purity Electroplating Solution Volume (K) Forecast, by Application 2020 & 2033
- Table 41: France High Purity Electroplating Solution Revenue (undefined) Forecast, by Application 2020 & 2033
- Table 42: France High Purity Electroplating Solution Volume (K) Forecast, by Application 2020 & 2033
- Table 43: Italy High Purity Electroplating Solution Revenue (undefined) Forecast, by Application 2020 & 2033
- Table 44: Italy High Purity Electroplating Solution Volume (K) Forecast, by Application 2020 & 2033
- Table 45: Spain High Purity Electroplating Solution Revenue (undefined) Forecast, by Application 2020 & 2033
- Table 46: Spain High Purity Electroplating Solution Volume (K) Forecast, by Application 2020 & 2033
- Table 47: Russia High Purity Electroplating Solution Revenue (undefined) Forecast, by Application 2020 & 2033
- Table 48: Russia High Purity Electroplating Solution Volume (K) Forecast, by Application 2020 & 2033
- Table 49: Benelux High Purity Electroplating Solution Revenue (undefined) Forecast, by Application 2020 & 2033
- Table 50: Benelux High Purity Electroplating Solution Volume (K) Forecast, by Application 2020 & 2033
- Table 51: Nordics High Purity Electroplating Solution Revenue (undefined) Forecast, by Application 2020 & 2033
- Table 52: Nordics High Purity Electroplating Solution Volume (K) Forecast, by Application 2020 & 2033
- Table 53: Rest of Europe High Purity Electroplating Solution Revenue (undefined) Forecast, by Application 2020 & 2033
- Table 54: Rest of Europe High Purity Electroplating Solution Volume (K) Forecast, by Application 2020 & 2033
- Table 55: Global High Purity Electroplating Solution Revenue undefined Forecast, by Application 2020 & 2033
- Table 56: Global High Purity Electroplating Solution Volume K Forecast, by Application 2020 & 2033
- Table 57: Global High Purity Electroplating Solution Revenue undefined Forecast, by Types 2020 & 2033
- Table 58: Global High Purity Electroplating Solution Volume K Forecast, by Types 2020 & 2033
- Table 59: Global High Purity Electroplating Solution Revenue undefined Forecast, by Country 2020 & 2033
- Table 60: Global High Purity Electroplating Solution Volume K Forecast, by Country 2020 & 2033
- Table 61: Turkey High Purity Electroplating Solution Revenue (undefined) Forecast, by Application 2020 & 2033
- Table 62: Turkey High Purity Electroplating Solution Volume (K) Forecast, by Application 2020 & 2033
- Table 63: Israel High Purity Electroplating Solution Revenue (undefined) Forecast, by Application 2020 & 2033
- Table 64: Israel High Purity Electroplating Solution Volume (K) Forecast, by Application 2020 & 2033
- Table 65: GCC High Purity Electroplating Solution Revenue (undefined) Forecast, by Application 2020 & 2033
- Table 66: GCC High Purity Electroplating Solution Volume (K) Forecast, by Application 2020 & 2033
- Table 67: North Africa High Purity Electroplating Solution Revenue (undefined) Forecast, by Application 2020 & 2033
- Table 68: North Africa High Purity Electroplating Solution Volume (K) Forecast, by Application 2020 & 2033
- Table 69: South Africa High Purity Electroplating Solution Revenue (undefined) Forecast, by Application 2020 & 2033
- Table 70: South Africa High Purity Electroplating Solution Volume (K) Forecast, by Application 2020 & 2033
- Table 71: Rest of Middle East & Africa High Purity Electroplating Solution Revenue (undefined) Forecast, by Application 2020 & 2033
- Table 72: Rest of Middle East & Africa High Purity Electroplating Solution Volume (K) Forecast, by Application 2020 & 2033
- Table 73: Global High Purity Electroplating Solution Revenue undefined Forecast, by Application 2020 & 2033
- Table 74: Global High Purity Electroplating Solution Volume K Forecast, by Application 2020 & 2033
- Table 75: Global High Purity Electroplating Solution Revenue undefined Forecast, by Types 2020 & 2033
- Table 76: Global High Purity Electroplating Solution Volume K Forecast, by Types 2020 & 2033
- Table 77: Global High Purity Electroplating Solution Revenue undefined Forecast, by Country 2020 & 2033
- Table 78: Global High Purity Electroplating Solution Volume K Forecast, by Country 2020 & 2033
- Table 79: China High Purity Electroplating Solution Revenue (undefined) Forecast, by Application 2020 & 2033
- Table 80: China High Purity Electroplating Solution Volume (K) Forecast, by Application 2020 & 2033
- Table 81: India High Purity Electroplating Solution Revenue (undefined) Forecast, by Application 2020 & 2033
- Table 82: India High Purity Electroplating Solution Volume (K) Forecast, by Application 2020 & 2033
- Table 83: Japan High Purity Electroplating Solution Revenue (undefined) Forecast, by Application 2020 & 2033
- Table 84: Japan High Purity Electroplating Solution Volume (K) Forecast, by Application 2020 & 2033
- Table 85: South Korea High Purity Electroplating Solution Revenue (undefined) Forecast, by Application 2020 & 2033
- Table 86: South Korea High Purity Electroplating Solution Volume (K) Forecast, by Application 2020 & 2033
- Table 87: ASEAN High Purity Electroplating Solution Revenue (undefined) Forecast, by Application 2020 & 2033
- Table 88: ASEAN High Purity Electroplating Solution Volume (K) Forecast, by Application 2020 & 2033
- Table 89: Oceania High Purity Electroplating Solution Revenue (undefined) Forecast, by Application 2020 & 2033
- Table 90: Oceania High Purity Electroplating Solution Volume (K) Forecast, by Application 2020 & 2033
- Table 91: Rest of Asia Pacific High Purity Electroplating Solution Revenue (undefined) Forecast, by Application 2020 & 2033
- Table 92: Rest of Asia Pacific High Purity Electroplating Solution Volume (K) Forecast, by Application 2020 & 2033
Frequently Asked Questions
1. What is the projected Compound Annual Growth Rate (CAGR) of the High Purity Electroplating Solution?
The projected CAGR is approximately 9%.
2. Which companies are prominent players in the High Purity Electroplating Solution?
Key companies in the market include Umicore, MacDermid, TANAKA, Japan Pure Chemical, BASF, Technic, Mitsubishi Materials Corporation, Shanghai Sinyang Semiconductor Materials, DuPont, ADEKA, Jiangsu Aisen Semiconductor Material, Resound Technology, PhiChem Corporation, Anji Microelectronics Technology (Shanghai), Daiwa Fine Chemicals, NB Technologies, Krohn Industries, Transene.
3. What are the main segments of the High Purity Electroplating Solution?
The market segments include Application, Types.
4. Can you provide details about the market size?
The market size is estimated to be USD XXX N/A as of 2022.
5. What are some drivers contributing to market growth?
N/A
6. What are the notable trends driving market growth?
N/A
7. Are there any restraints impacting market growth?
N/A
8. Can you provide examples of recent developments in the market?
N/A
9. What pricing options are available for accessing the report?
Pricing options include single-user, multi-user, and enterprise licenses priced at USD 3350.00, USD 5025.00, and USD 6700.00 respectively.
10. Is the market size provided in terms of value or volume?
The market size is provided in terms of value, measured in N/A and volume, measured in K.
11. Are there any specific market keywords associated with the report?
Yes, the market keyword associated with the report is "High Purity Electroplating Solution," which aids in identifying and referencing the specific market segment covered.
12. How do I determine which pricing option suits my needs best?
The pricing options vary based on user requirements and access needs. Individual users may opt for single-user licenses, while businesses requiring broader access may choose multi-user or enterprise licenses for cost-effective access to the report.
13. Are there any additional resources or data provided in the High Purity Electroplating Solution report?
While the report offers comprehensive insights, it's advisable to review the specific contents or supplementary materials provided to ascertain if additional resources or data are available.
14. How can I stay updated on further developments or reports in the High Purity Electroplating Solution?
To stay informed about further developments, trends, and reports in the High Purity Electroplating Solution, consider subscribing to industry newsletters, following relevant companies and organizations, or regularly checking reputable industry news sources and publications.
Methodology
Step 1 - Identification of Relevant Samples Size from Population Database


Step 2 - Approaches for Defining Global Market Size (Value, Volume* & Price*)

Note*: In applicable scenarios
Step 3 - Data Sources
Primary Research
- Web Analytics
- Survey Reports
- Research Institute
- Latest Research Reports
- Opinion Leaders
Secondary Research
- Annual Reports
- White Paper
- Latest Press Release
- Industry Association
- Paid Database
- Investor Presentations

Step 4 - Data Triangulation
Involves using different sources of information in order to increase the validity of a study
These sources are likely to be stakeholders in a program - participants, other researchers, program staff, other community members, and so on.
Then we put all data in single framework & apply various statistical tools to find out the dynamic on the market.
During the analysis stage, feedback from the stakeholder groups would be compared to determine areas of agreement as well as areas of divergence