

Key Insights
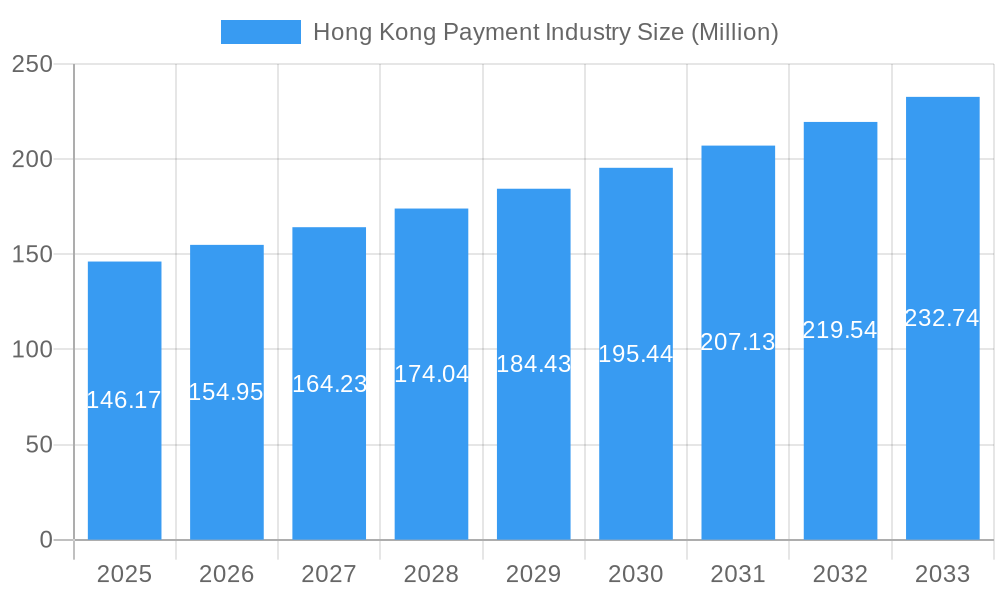
The Hong Kong payment industry, valued at $146.17 million in 2025, is projected to experience robust growth, driven by increasing digitalization, rising e-commerce adoption, and a burgeoning mobile-first population. The 5.66% CAGR indicates a steady expansion through 2033, exceeding $200 million by the end of the forecast period. Key growth drivers include the expanding adoption of contactless payments, fueled by government initiatives promoting digital financial inclusion and the widespread availability of mobile wallets. The rise of Buy Now Pay Later (BNPL) services and embedded finance solutions within various platforms further contribute to this positive trajectory. While the dominance of established players like Visa, Mastercard, and American Express remains significant, the increasing competition from fintech companies and the emergence of innovative payment solutions create a dynamic and evolving landscape. The segment breakdown reveals a strong presence of online sales, mirroring the broader global trend towards e-commerce. Retail, entertainment, and hospitality sectors are key end-user industries driving transaction volumes. However, potential restraints include concerns regarding data security and privacy, as well as regulatory hurdles related to cross-border payments and financial technology innovation.
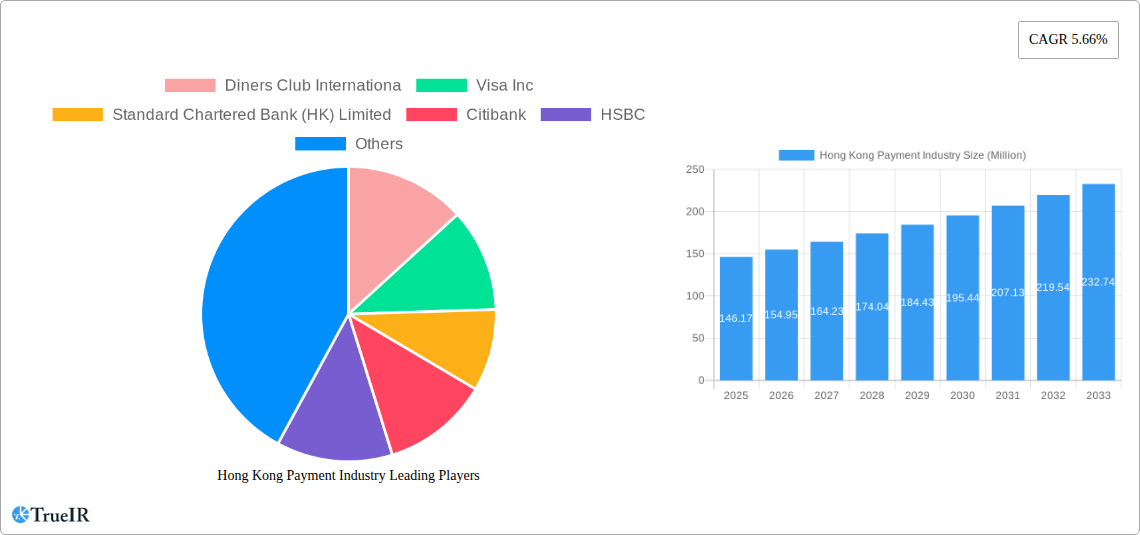
Hong Kong Payment Industry Market Size (In Million)
The strategic focus of major players in Hong Kong is shifting towards enhancing user experience, offering seamless cross-border transaction capabilities, and developing advanced security features to maintain customer trust. This includes investments in artificial intelligence (AI) and machine learning (ML) for fraud prevention and personalized payment solutions. Future growth hinges on adapting to changing consumer preferences, embracing open banking initiatives, and navigating the evolving regulatory framework. The continued penetration of mobile payments and the expansion into niche segments like healthcare payments will be critical for sustaining the industry's positive growth trajectory. The competitive landscape will see further consolidation and strategic partnerships as companies strive for market share and expansion opportunities.
Hong Kong Payment Industry Company Market Share
Hong Kong Payment Industry: Market Report 2019-2033
This comprehensive report provides a detailed analysis of the Hong Kong payment industry, covering market structure, competitive landscape, trends, opportunities, and future outlook from 2019 to 2033. The report leverages extensive data analysis and insights to offer a crucial understanding of this dynamic sector, ideal for investors, businesses, and industry professionals. With a focus on key players like Visa Inc, Mastercard Incorporated, and HSBC, alongside emerging trends, this report is essential for navigating the complexities of Hong Kong's payment landscape. The base year for this report is 2025, with estimations for 2025 and forecasts spanning 2025-2033, alongside historical data from 2019-2024. The market size is expected to reach xx Million by 2033.
Hong Kong Payment Industry Market Structure & Competitive Landscape
The Hong Kong payment industry exhibits a highly competitive landscape dominated by a few major players, including Visa Inc, Mastercard Incorporated, and local giants like HSBC and Bank of China. Market concentration, measured by the Herfindahl-Hirschman Index (HHI), stands at xx in 2025, indicating a moderately concentrated market. However, the emergence of fintech companies and mobile payment solutions is increasing competition.
- Innovation Drivers: Technological advancements, particularly in mobile payments and digital wallets, are significant innovation drivers. The adoption of faster payment systems and improved security measures constantly shapes the market.
- Regulatory Impacts: The Hong Kong Monetary Authority's (HKMA) regulatory framework plays a crucial role in shaping the industry. Regulations related to data privacy, security, and anti-money laundering are key factors.
- Product Substitutes: The rise of digital wallets and mobile payment apps presents viable substitutes for traditional payment methods like credit cards and cash. These alternatives are impacting market share and encouraging innovation within traditional banking systems.
- End-User Segmentation: The market is segmented by various end-user industries, including retail, entertainment, healthcare, and hospitality. The retail segment holds a significant share, driven by high consumer spending and e-commerce growth.
- M&A Trends: The past five years have witnessed xx Million in M&A activity within the Hong Kong payment industry. Consolidation and strategic partnerships are expected to continue, shaping the industry structure further.
Hong Kong Payment Industry Market Trends & Opportunities
The Hong Kong payment industry is experiencing robust growth, driven by factors such as rising disposable incomes, increased e-commerce adoption, and the proliferation of mobile payment solutions. The market size is estimated to be xx Million in 2025, growing at a Compound Annual Growth Rate (CAGR) of xx% from 2025 to 2033. Market penetration of digital payments is currently at xx%, expected to reach xx% by 2033.
This expansion is fueled by significant technological shifts, including the widespread adoption of contactless payments, the increasing popularity of digital wallets (e.g., Alipay, WeChat Pay), and advancements in biometric authentication technologies. Consumer preferences are shifting towards greater convenience and security in payment solutions, driving the demand for innovative products and services. Competitive dynamics are intensely shaped by strategic alliances, technological innovations, and the ongoing expansion of fintech companies.
Dominant Markets & Segments in Hong Kong Payment Industry
The retail segment constitutes the largest portion of the Hong Kong payment industry, with a market share of xx% in 2025. Online sales are also rapidly gaining traction, driven by e-commerce growth. By payment mode, Point of Sale (POS) transactions still dominate, although the proportion of online sales is steadily increasing.
- Key Growth Drivers (Retail Segment):
- Robust growth of e-commerce.
- Increasing consumer spending power.
- Expansion of retail infrastructure.
- Supportive government policies promoting digital economy.
- Key Growth Drivers (Online Sales Segment):
- Rise of e-commerce platforms.
- Improved internet penetration and mobile connectivity.
- Increased consumer trust in online payment security.
- Government initiatives to promote digital transactions.
Hong Kong Payment Industry Product Analysis
The Hong Kong payment industry displays a wide array of products, from traditional credit and debit cards issued by major players like Visa Inc, Mastercard Incorporated, and HSBC to innovative mobile payment solutions and digital wallets. The key differentiators lie in the level of security, user experience, and integration with existing financial systems. Technological advancements, such as biometric authentication and tokenization, are driving product innovation. The market's preference for convenient and secure options shapes the competitiveness of each product.
Key Drivers, Barriers & Challenges in Hong Kong Payment Industry
Key Drivers: The increasing adoption of digital technologies, the rise of e-commerce, and supportive government policies are major drivers of growth in the Hong Kong payment industry. The HKMA’s focus on fostering innovation and regulating the fintech sector is a key element.
Challenges: Regulatory hurdles, particularly those surrounding data privacy and security, pose significant challenges. Competition from both established players and emerging fintech companies also puts pressure on margins and market share. Maintaining secure payment systems in the face of rising cyber threats is a constant challenge.
Growth Drivers in the Hong Kong Payment Industry Market
Key growth drivers include the increasing penetration of smartphones and internet access, the rise of e-commerce and mobile commerce, and government initiatives promoting digitalization. The expansion of contactless payment options and the increasing popularity of digital wallets further contribute to market expansion.
Challenges Impacting Hong Kong Payment Industry Growth
Challenges include the need for robust cybersecurity measures to combat fraud and data breaches, the potential for regulatory changes affecting the industry, and the need for ongoing investment in infrastructure to support digital payment systems. Competition from regional and global players also presents a significant challenge.
Key Players Shaping the Hong Kong Payment Industry Market
Significant Hong Kong Payment Industry Industry Milestones
- November 2023: JCB and Stripe expanded their partnership to Europe, Singapore, and Hong Kong. This significantly increased JCB's reach in the region. Stripe's integration of JCB as a default payment option for merchants broadened access for consumers.
Future Outlook for Hong Kong Payment Industry Market
The Hong Kong payment industry is poised for continued growth, driven by technological innovation, increasing digital adoption, and a supportive regulatory environment. Strategic partnerships and investments in fintech are expected to further shape the market landscape. The focus on enhanced security and seamless user experiences will be critical for sustaining growth and maintaining consumer confidence.
Hong Kong Payment Industry Segmentation
-
1. Mode of Payment
-
1.1. By Point of Sale
- 1.1.1. Card Payments
- 1.1.2. Digital Wallet
- 1.1.3. Cash
- 1.1.4. Other Point of Sales
-
1.2. By Online Sale
- 1.2.1. Other Online Sales
-
1.1. By Point of Sale
-
2. End-user Industry
- 2.1. Retail
- 2.2. Entertainment
- 2.3. Healthcare
- 2.4. Hospitality
- 2.5. Other End-user Industries
Hong Kong Payment Industry Segmentation By Geography
-
1. North America
- 1.1. United States
- 1.2. Canada
- 1.3. Mexico
-
2. South America
- 2.1. Brazil
- 2.2. Argentina
- 2.3. Rest of South America
-
3. Europe
- 3.1. United Kingdom
- 3.2. Germany
- 3.3. France
- 3.4. Italy
- 3.5. Spain
- 3.6. Russia
- 3.7. Benelux
- 3.8. Nordics
- 3.9. Rest of Europe
-
4. Middle East & Africa
- 4.1. Turkey
- 4.2. Israel
- 4.3. GCC
- 4.4. North Africa
- 4.5. South Africa
- 4.6. Rest of Middle East & Africa
-
5. Asia Pacific
- 5.1. China
- 5.2. India
- 5.3. Japan
- 5.4. South Korea
- 5.5. ASEAN
- 5.6. Oceania
- 5.7. Rest of Asia Pacific
Hong Kong Payment Industry Regional Market Share
Geographic Coverage of Hong Kong Payment Industry
Hong Kong Payment Industry REPORT HIGHLIGHTS
| Aspects | Details |
|---|---|
| Study Period | 2020-2034 |
| Base Year | 2025 |
| Estimated Year | 2026 |
| Forecast Period | 2026-2034 |
| Historical Period | 2020-2025 |
| Growth Rate | CAGR of 5.66% from 2020-2034 |
| Segmentation |
|
Table of Contents
- 1. Introduction
- 1.1. Research Scope
- 1.2. Market Segmentation
- 1.3. Research Objective
- 1.4. Definitions and Assumptions
- 2. Executive Summary
- 2.1. Market Snapshot
- 3. Market Dynamics
- 3.1. Market Drivers
- 3.2. Market Restrains
- 3.3. Market Trends
- 3.4. Market Opportunities
- 4. Market Factor Analysis
- 4.1. Porters Five Forces
- 4.1.1. Bargaining Power of Suppliers
- 4.1.2. Bargaining Power of Buyers
- 4.1.3. Threat of New Entrants
- 4.1.4. Threat of Substitutes
- 4.1.5. Competitive Rivalry
- 4.2. PESTEL analysis
- 4.3. BCG Analysis
- 4.3.1. Stars (High Growth, High Market Share)
- 4.3.2. Cash Cows (Low Growth, High Market Share)
- 4.3.3. Question Mark (High Growth, Low Market Share)
- 4.3.4. Dogs (Low Growth, Low Market Share)
- 4.4. Ansoff Matrix Analysis
- 4.5. Supply Chain Analysis
- 4.6. Regulatory Landscape
- 4.7. Current Market Potential and Opportunity Assessment (TAM–SAM–SOM Framework)
- 4.8. TIR Analyst Note
- 4.1. Porters Five Forces
- 5. Market Analysis, Insights and Forecast 2021-2033
- 5.1. Market Analysis, Insights and Forecast - by Mode of Payment
- 5.1.1. By Point of Sale
- 5.1.1.1. Card Payments
- 5.1.1.2. Digital Wallet
- 5.1.1.3. Cash
- 5.1.1.4. Other Point of Sales
- 5.1.2. By Online Sale
- 5.1.2.1. Other Online Sales
- 5.1.1. By Point of Sale
- 5.2. Market Analysis, Insights and Forecast - by End-user Industry
- 5.2.1. Retail
- 5.2.2. Entertainment
- 5.2.3. Healthcare
- 5.2.4. Hospitality
- 5.2.5. Other End-user Industries
- 5.3. Market Analysis, Insights and Forecast - by Region
- 5.3.1. North America
- 5.3.2. South America
- 5.3.3. Europe
- 5.3.4. Middle East & Africa
- 5.3.5. Asia Pacific
- 5.1. Market Analysis, Insights and Forecast - by Mode of Payment
- 6. Global Hong Kong Payment Industry Analysis, Insights and Forecast, 2021-2033
- 6.1. Market Analysis, Insights and Forecast - by Mode of Payment
- 6.1.1. By Point of Sale
- 6.1.1.1. Card Payments
- 6.1.1.2. Digital Wallet
- 6.1.1.3. Cash
- 6.1.1.4. Other Point of Sales
- 6.1.2. By Online Sale
- 6.1.2.1. Other Online Sales
- 6.1.1. By Point of Sale
- 6.2. Market Analysis, Insights and Forecast - by End-user Industry
- 6.2.1. Retail
- 6.2.2. Entertainment
- 6.2.3. Healthcare
- 6.2.4. Hospitality
- 6.2.5. Other End-user Industries
- 6.1. Market Analysis, Insights and Forecast - by Mode of Payment
- 7. North America Hong Kong Payment Industry Analysis, Insights and Forecast, 2020-2032
- 7.1. Market Analysis, Insights and Forecast - by Mode of Payment
- 7.1.1. By Point of Sale
- 7.1.1.1. Card Payments
- 7.1.1.2. Digital Wallet
- 7.1.1.3. Cash
- 7.1.1.4. Other Point of Sales
- 7.1.2. By Online Sale
- 7.1.2.1. Other Online Sales
- 7.1.1. By Point of Sale
- 7.2. Market Analysis, Insights and Forecast - by End-user Industry
- 7.2.1. Retail
- 7.2.2. Entertainment
- 7.2.3. Healthcare
- 7.2.4. Hospitality
- 7.2.5. Other End-user Industries
- 7.1. Market Analysis, Insights and Forecast - by Mode of Payment
- 8. South America Hong Kong Payment Industry Analysis, Insights and Forecast, 2020-2032
- 8.1. Market Analysis, Insights and Forecast - by Mode of Payment
- 8.1.1. By Point of Sale
- 8.1.1.1. Card Payments
- 8.1.1.2. Digital Wallet
- 8.1.1.3. Cash
- 8.1.1.4. Other Point of Sales
- 8.1.2. By Online Sale
- 8.1.2.1. Other Online Sales
- 8.1.1. By Point of Sale
- 8.2. Market Analysis, Insights and Forecast - by End-user Industry
- 8.2.1. Retail
- 8.2.2. Entertainment
- 8.2.3. Healthcare
- 8.2.4. Hospitality
- 8.2.5. Other End-user Industries
- 8.1. Market Analysis, Insights and Forecast - by Mode of Payment
- 9. Europe Hong Kong Payment Industry Analysis, Insights and Forecast, 2020-2032
- 9.1. Market Analysis, Insights and Forecast - by Mode of Payment
- 9.1.1. By Point of Sale
- 9.1.1.1. Card Payments
- 9.1.1.2. Digital Wallet
- 9.1.1.3. Cash
- 9.1.1.4. Other Point of Sales
- 9.1.2. By Online Sale
- 9.1.2.1. Other Online Sales
- 9.1.1. By Point of Sale
- 9.2. Market Analysis, Insights and Forecast - by End-user Industry
- 9.2.1. Retail
- 9.2.2. Entertainment
- 9.2.3. Healthcare
- 9.2.4. Hospitality
- 9.2.5. Other End-user Industries
- 9.1. Market Analysis, Insights and Forecast - by Mode of Payment
- 10. Middle East & Africa Hong Kong Payment Industry Analysis, Insights and Forecast, 2020-2032
- 10.1. Market Analysis, Insights and Forecast - by Mode of Payment
- 10.1.1. By Point of Sale
- 10.1.1.1. Card Payments
- 10.1.1.2. Digital Wallet
- 10.1.1.3. Cash
- 10.1.1.4. Other Point of Sales
- 10.1.2. By Online Sale
- 10.1.2.1. Other Online Sales
- 10.1.1. By Point of Sale
- 10.2. Market Analysis, Insights and Forecast - by End-user Industry
- 10.2.1. Retail
- 10.2.2. Entertainment
- 10.2.3. Healthcare
- 10.2.4. Hospitality
- 10.2.5. Other End-user Industries
- 10.1. Market Analysis, Insights and Forecast - by Mode of Payment
- 11. Asia Pacific Hong Kong Payment Industry Analysis, Insights and Forecast, 2020-2032
- 11.1. Market Analysis, Insights and Forecast - by Mode of Payment
- 11.1.1. By Point of Sale
- 11.1.1.1. Card Payments
- 11.1.1.2. Digital Wallet
- 11.1.1.3. Cash
- 11.1.1.4. Other Point of Sales
- 11.1.2. By Online Sale
- 11.1.2.1. Other Online Sales
- 11.1.1. By Point of Sale
- 11.2. Market Analysis, Insights and Forecast - by End-user Industry
- 11.2.1. Retail
- 11.2.2. Entertainment
- 11.2.3. Healthcare
- 11.2.4. Hospitality
- 11.2.5. Other End-user Industries
- 11.1. Market Analysis, Insights and Forecast - by Mode of Payment
- 12. Competitive Analysis
- 12.1. Company Profiles
- 12.1.1 Diners Club Internationa
- 12.1.1.1. Company Overview
- 12.1.1.2. Products
- 12.1.1.3. Company Financials
- 12.1.1.4. SWOT Analysis
- 12.1.2 Visa Inc
- 12.1.2.1. Company Overview
- 12.1.2.2. Products
- 12.1.2.3. Company Financials
- 12.1.2.4. SWOT Analysis
- 12.1.3 Standard Chartered Bank (HK) Limited
- 12.1.3.1. Company Overview
- 12.1.3.2. Products
- 12.1.3.3. Company Financials
- 12.1.3.4. SWOT Analysis
- 12.1.4 Citibank
- 12.1.4.1. Company Overview
- 12.1.4.2. Products
- 12.1.4.3. Company Financials
- 12.1.4.4. SWOT Analysis
- 12.1.5 HSBC
- 12.1.5.1. Company Overview
- 12.1.5.2. Products
- 12.1.5.3. Company Financials
- 12.1.5.4. SWOT Analysis
- 12.1.6 Bank of China
- 12.1.6.1. Company Overview
- 12.1.6.2. Products
- 12.1.6.3. Company Financials
- 12.1.6.4. SWOT Analysis
- 12.1.7 American Express Company
- 12.1.7.1. Company Overview
- 12.1.7.2. Products
- 12.1.7.3. Company Financials
- 12.1.7.4. SWOT Analysis
- 12.1.8 The Bank of East Asia Limited (BEA)
- 12.1.8.1. Company Overview
- 12.1.8.2. Products
- 12.1.8.3. Company Financials
- 12.1.8.4. SWOT Analysis
- 12.1.9 Mastercard Incorporated
- 12.1.9.1. Company Overview
- 12.1.9.2. Products
- 12.1.9.3. Company Financials
- 12.1.9.4. SWOT Analysis
- 12.1.10 EPS Company
- 12.1.10.1. Company Overview
- 12.1.10.2. Products
- 12.1.10.3. Company Financials
- 12.1.10.4. SWOT Analysis
- 12.1.1 Diners Club Internationa
- 12.2. Market Entropy
- 12.2.1 Company's Key Areas Served
- 12.2.2 Recent Developments
- 12.3. Company Market Share Analysis 2025
- 12.3.1 Top 5 Companies Market Share Analysis
- 12.3.2 Top 3 Companies Market Share Analysis
- 12.4. List of Potential Customers
- 13. Research Methodology
List of Figures
- Figure 1: Global Hong Kong Payment Industry Revenue Breakdown (Million, %) by Region 2025 & 2033
- Figure 2: North America Hong Kong Payment Industry Revenue (Million), by Mode of Payment 2025 & 2033
- Figure 3: North America Hong Kong Payment Industry Revenue Share (%), by Mode of Payment 2025 & 2033
- Figure 4: North America Hong Kong Payment Industry Revenue (Million), by End-user Industry 2025 & 2033
- Figure 5: North America Hong Kong Payment Industry Revenue Share (%), by End-user Industry 2025 & 2033
- Figure 6: North America Hong Kong Payment Industry Revenue (Million), by Country 2025 & 2033
- Figure 7: North America Hong Kong Payment Industry Revenue Share (%), by Country 2025 & 2033
- Figure 8: South America Hong Kong Payment Industry Revenue (Million), by Mode of Payment 2025 & 2033
- Figure 9: South America Hong Kong Payment Industry Revenue Share (%), by Mode of Payment 2025 & 2033
- Figure 10: South America Hong Kong Payment Industry Revenue (Million), by End-user Industry 2025 & 2033
- Figure 11: South America Hong Kong Payment Industry Revenue Share (%), by End-user Industry 2025 & 2033
- Figure 12: South America Hong Kong Payment Industry Revenue (Million), by Country 2025 & 2033
- Figure 13: South America Hong Kong Payment Industry Revenue Share (%), by Country 2025 & 2033
- Figure 14: Europe Hong Kong Payment Industry Revenue (Million), by Mode of Payment 2025 & 2033
- Figure 15: Europe Hong Kong Payment Industry Revenue Share (%), by Mode of Payment 2025 & 2033
- Figure 16: Europe Hong Kong Payment Industry Revenue (Million), by End-user Industry 2025 & 2033
- Figure 17: Europe Hong Kong Payment Industry Revenue Share (%), by End-user Industry 2025 & 2033
- Figure 18: Europe Hong Kong Payment Industry Revenue (Million), by Country 2025 & 2033
- Figure 19: Europe Hong Kong Payment Industry Revenue Share (%), by Country 2025 & 2033
- Figure 20: Middle East & Africa Hong Kong Payment Industry Revenue (Million), by Mode of Payment 2025 & 2033
- Figure 21: Middle East & Africa Hong Kong Payment Industry Revenue Share (%), by Mode of Payment 2025 & 2033
- Figure 22: Middle East & Africa Hong Kong Payment Industry Revenue (Million), by End-user Industry 2025 & 2033
- Figure 23: Middle East & Africa Hong Kong Payment Industry Revenue Share (%), by End-user Industry 2025 & 2033
- Figure 24: Middle East & Africa Hong Kong Payment Industry Revenue (Million), by Country 2025 & 2033
- Figure 25: Middle East & Africa Hong Kong Payment Industry Revenue Share (%), by Country 2025 & 2033
- Figure 26: Asia Pacific Hong Kong Payment Industry Revenue (Million), by Mode of Payment 2025 & 2033
- Figure 27: Asia Pacific Hong Kong Payment Industry Revenue Share (%), by Mode of Payment 2025 & 2033
- Figure 28: Asia Pacific Hong Kong Payment Industry Revenue (Million), by End-user Industry 2025 & 2033
- Figure 29: Asia Pacific Hong Kong Payment Industry Revenue Share (%), by End-user Industry 2025 & 2033
- Figure 30: Asia Pacific Hong Kong Payment Industry Revenue (Million), by Country 2025 & 2033
- Figure 31: Asia Pacific Hong Kong Payment Industry Revenue Share (%), by Country 2025 & 2033
List of Tables
- Table 1: Global Hong Kong Payment Industry Revenue Million Forecast, by Mode of Payment 2020 & 2033
- Table 2: Global Hong Kong Payment Industry Revenue Million Forecast, by End-user Industry 2020 & 2033
- Table 3: Global Hong Kong Payment Industry Revenue Million Forecast, by Region 2020 & 2033
- Table 4: Global Hong Kong Payment Industry Revenue Million Forecast, by Mode of Payment 2020 & 2033
- Table 5: Global Hong Kong Payment Industry Revenue Million Forecast, by End-user Industry 2020 & 2033
- Table 6: Global Hong Kong Payment Industry Revenue Million Forecast, by Country 2020 & 2033
- Table 7: United States Hong Kong Payment Industry Revenue (Million) Forecast, by Application 2020 & 2033
- Table 8: Canada Hong Kong Payment Industry Revenue (Million) Forecast, by Application 2020 & 2033
- Table 9: Mexico Hong Kong Payment Industry Revenue (Million) Forecast, by Application 2020 & 2033
- Table 10: Global Hong Kong Payment Industry Revenue Million Forecast, by Mode of Payment 2020 & 2033
- Table 11: Global Hong Kong Payment Industry Revenue Million Forecast, by End-user Industry 2020 & 2033
- Table 12: Global Hong Kong Payment Industry Revenue Million Forecast, by Country 2020 & 2033
- Table 13: Brazil Hong Kong Payment Industry Revenue (Million) Forecast, by Application 2020 & 2033
- Table 14: Argentina Hong Kong Payment Industry Revenue (Million) Forecast, by Application 2020 & 2033
- Table 15: Rest of South America Hong Kong Payment Industry Revenue (Million) Forecast, by Application 2020 & 2033
- Table 16: Global Hong Kong Payment Industry Revenue Million Forecast, by Mode of Payment 2020 & 2033
- Table 17: Global Hong Kong Payment Industry Revenue Million Forecast, by End-user Industry 2020 & 2033
- Table 18: Global Hong Kong Payment Industry Revenue Million Forecast, by Country 2020 & 2033
- Table 19: United Kingdom Hong Kong Payment Industry Revenue (Million) Forecast, by Application 2020 & 2033
- Table 20: Germany Hong Kong Payment Industry Revenue (Million) Forecast, by Application 2020 & 2033
- Table 21: France Hong Kong Payment Industry Revenue (Million) Forecast, by Application 2020 & 2033
- Table 22: Italy Hong Kong Payment Industry Revenue (Million) Forecast, by Application 2020 & 2033
- Table 23: Spain Hong Kong Payment Industry Revenue (Million) Forecast, by Application 2020 & 2033
- Table 24: Russia Hong Kong Payment Industry Revenue (Million) Forecast, by Application 2020 & 2033
- Table 25: Benelux Hong Kong Payment Industry Revenue (Million) Forecast, by Application 2020 & 2033
- Table 26: Nordics Hong Kong Payment Industry Revenue (Million) Forecast, by Application 2020 & 2033
- Table 27: Rest of Europe Hong Kong Payment Industry Revenue (Million) Forecast, by Application 2020 & 2033
- Table 28: Global Hong Kong Payment Industry Revenue Million Forecast, by Mode of Payment 2020 & 2033
- Table 29: Global Hong Kong Payment Industry Revenue Million Forecast, by End-user Industry 2020 & 2033
- Table 30: Global Hong Kong Payment Industry Revenue Million Forecast, by Country 2020 & 2033
- Table 31: Turkey Hong Kong Payment Industry Revenue (Million) Forecast, by Application 2020 & 2033
- Table 32: Israel Hong Kong Payment Industry Revenue (Million) Forecast, by Application 2020 & 2033
- Table 33: GCC Hong Kong Payment Industry Revenue (Million) Forecast, by Application 2020 & 2033
- Table 34: North Africa Hong Kong Payment Industry Revenue (Million) Forecast, by Application 2020 & 2033
- Table 35: South Africa Hong Kong Payment Industry Revenue (Million) Forecast, by Application 2020 & 2033
- Table 36: Rest of Middle East & Africa Hong Kong Payment Industry Revenue (Million) Forecast, by Application 2020 & 2033
- Table 37: Global Hong Kong Payment Industry Revenue Million Forecast, by Mode of Payment 2020 & 2033
- Table 38: Global Hong Kong Payment Industry Revenue Million Forecast, by End-user Industry 2020 & 2033
- Table 39: Global Hong Kong Payment Industry Revenue Million Forecast, by Country 2020 & 2033
- Table 40: China Hong Kong Payment Industry Revenue (Million) Forecast, by Application 2020 & 2033
- Table 41: India Hong Kong Payment Industry Revenue (Million) Forecast, by Application 2020 & 2033
- Table 42: Japan Hong Kong Payment Industry Revenue (Million) Forecast, by Application 2020 & 2033
- Table 43: South Korea Hong Kong Payment Industry Revenue (Million) Forecast, by Application 2020 & 2033
- Table 44: ASEAN Hong Kong Payment Industry Revenue (Million) Forecast, by Application 2020 & 2033
- Table 45: Oceania Hong Kong Payment Industry Revenue (Million) Forecast, by Application 2020 & 2033
- Table 46: Rest of Asia Pacific Hong Kong Payment Industry Revenue (Million) Forecast, by Application 2020 & 2033
Frequently Asked Questions
1. What is the projected Compound Annual Growth Rate (CAGR) of the Hong Kong Payment Industry?
The projected CAGR is approximately 5.66%.
2. Which companies are prominent players in the Hong Kong Payment Industry?
Key companies in the market include Diners Club Internationa, Visa Inc, Standard Chartered Bank (HK) Limited, Citibank, HSBC, Bank of China, American Express Company, The Bank of East Asia Limited (BEA), Mastercard Incorporated, EPS Company.
3. What are the main segments of the Hong Kong Payment Industry?
The market segments include Mode of Payment, End-user Industry.
4. Can you provide details about the market size?
The market size is estimated to be USD 146.17 Million as of 2022.
5. What are some drivers contributing to market growth?
Integration of Payment Gateways; Initiatives by the Government to Advance in Digital Payments.
6. What are the notable trends driving market growth?
Card Payments to Hold Significant Share in Online Payment Sector.
7. Are there any restraints impacting market growth?
Rising Concern Regarding e-Waste.
8. Can you provide examples of recent developments in the market?
November 2023 - JCB and Stripe Expanded their Partnership to Europe, Singapore, and Hong Kong. As part of this expansion, Stripe added JCB to its default payment scheme for merchants in the United Kingdom and Ireland in August and for merchants in other European countries, Singapore and Hong Kong.
9. What pricing options are available for accessing the report?
Pricing options include single-user, multi-user, and enterprise licenses priced at USD 3800, USD 4500, and USD 5800 respectively.
10. Is the market size provided in terms of value or volume?
The market size is provided in terms of value, measured in Million.
11. Are there any specific market keywords associated with the report?
Yes, the market keyword associated with the report is "Hong Kong Payment Industry," which aids in identifying and referencing the specific market segment covered.
12. How do I determine which pricing option suits my needs best?
The pricing options vary based on user requirements and access needs. Individual users may opt for single-user licenses, while businesses requiring broader access may choose multi-user or enterprise licenses for cost-effective access to the report.
13. Are there any additional resources or data provided in the Hong Kong Payment Industry report?
While the report offers comprehensive insights, it's advisable to review the specific contents or supplementary materials provided to ascertain if additional resources or data are available.
14. How can I stay updated on further developments or reports in the Hong Kong Payment Industry?
To stay informed about further developments, trends, and reports in the Hong Kong Payment Industry, consider subscribing to industry newsletters, following relevant companies and organizations, or regularly checking reputable industry news sources and publications.
Methodology
Step 1 - Identification of Relevant Samples Size from Population Database


Step 2 - Approaches for Defining Global Market Size (Value, Volume* & Price*)

Note*: In applicable scenarios
Step 3 - Data Sources
Primary Research
- Web Analytics
- Survey Reports
- Research Institute
- Latest Research Reports
- Opinion Leaders
Secondary Research
- Annual Reports
- White Paper
- Latest Press Release
- Industry Association
- Paid Database
- Investor Presentations

Step 4 - Data Triangulation
Involves using different sources of information in order to increase the validity of a study
These sources are likely to be stakeholders in a program - participants, other researchers, program staff, other community members, and so on.
Then we put all data in single framework & apply various statistical tools to find out the dynamic on the market.
During the analysis stage, feedback from the stakeholder groups would be compared to determine areas of agreement as well as areas of divergence