

Key Insights
The global hydro generators market is projected for substantial growth, fueled by the escalating demand for renewable energy and the expansion of hydropower infrastructure worldwide. The market was valued at $7 billion in the base year 2025 and is expected to expand at a Compound Annual Growth Rate (CAGR) of 4.3%. Key growth catalysts include supportive government policies promoting clean energy, rising energy prices, and the imperative for reliable, sustainable power generation, especially in regions with abundant water resources. Technological innovations in hydro generator design, enhancing efficiency and power output, are further stimulating market expansion. Market segmentation by size (large, small, micro) caters to diverse applications, from extensive hydroelectric dams to smaller-scale installations. Leading industry participants, including Nidec Industrial Solutions, Voith GmbH & Co KGaA, and Siemens AG, are actively investing in research and development to optimize product performance and increase market share. Significant growth potential is evident across North America, Europe, and Asia Pacific, though regional market dynamics will be influenced by existing infrastructure, government regulations, and resource availability.
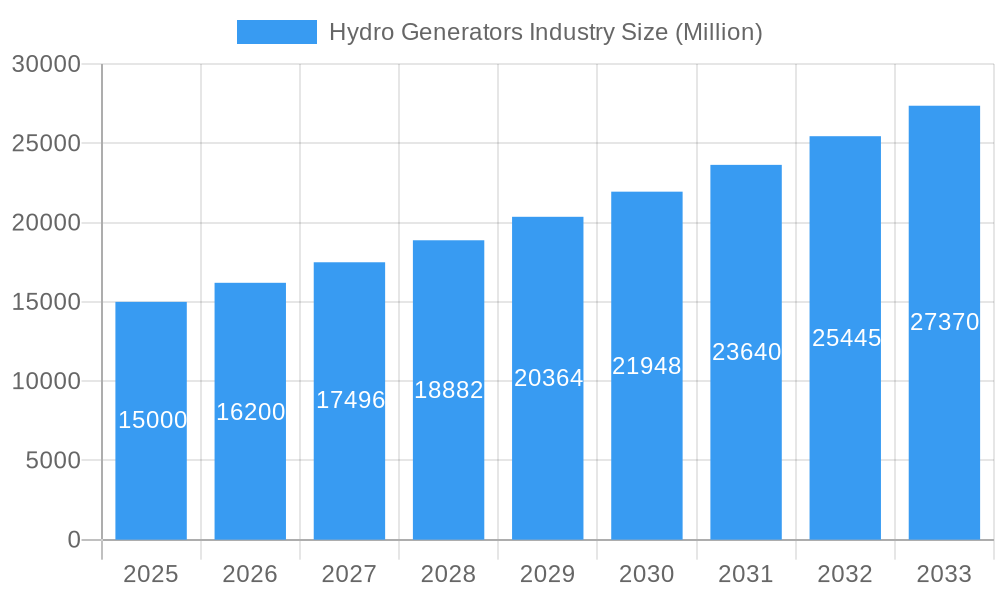
Hydro Generators Industry Market Size (In Billion)
The market encounters challenges such as high upfront investment for hydropower projects and potential environmental impacts from dam construction. Nevertheless, innovative financing models, enhanced environmental mitigation strategies, and a growing recognition of the long-term advantages of sustainable energy are addressing these obstacles. The forecast period (2025-2033) predicts sustained expansion, driven by ongoing investment in renewable energy and the continuous need for energy source diversification. A discernible trend towards higher-efficiency generators and advanced smart grid integration technologies is anticipated, creating lucrative opportunities for companies specializing in cutting-edge technologies and services. The competitive landscape is expected to remain dynamic, with established players prioritizing technological innovation and strategic collaborations to solidify and broaden their market standing.
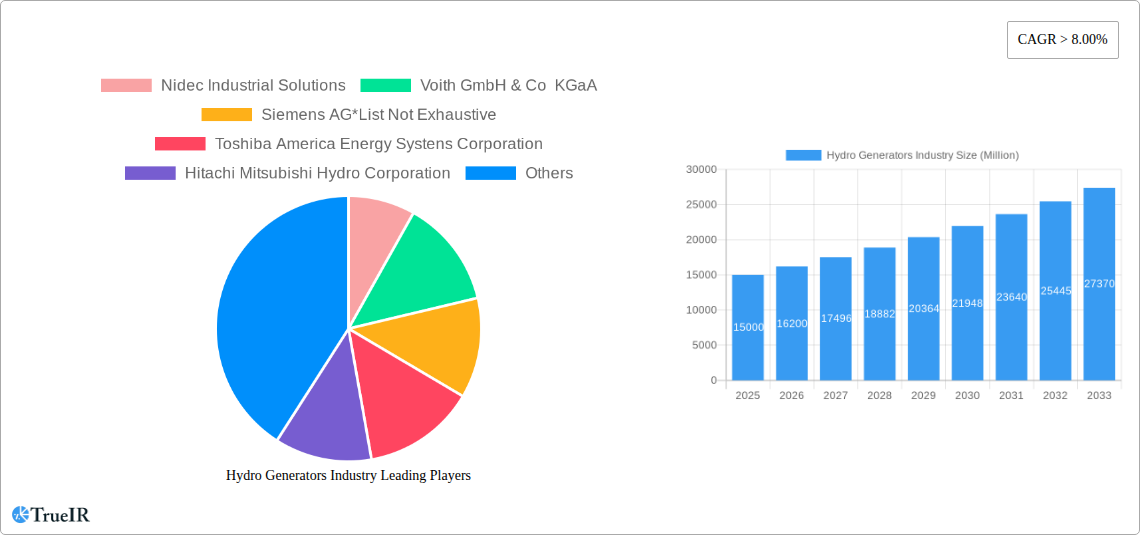
Hydro Generators Industry Company Market Share
Hydro Generators Industry: A Comprehensive Market Report (2019-2033)
This dynamic report provides a detailed analysis of the Hydro Generators industry, offering invaluable insights for investors, industry professionals, and strategic decision-makers. Covering the period from 2019 to 2033, with a focus on 2025, this study unveils market trends, competitive landscapes, and future growth projections. The report leverages extensive data analysis and incorporates key industry developments to provide a comprehensive understanding of this vital energy sector. The global hydro generator market is projected to reach xx Million by 2033, exhibiting a robust CAGR of xx% during the forecast period (2025-2033).
Hydro Generators Industry Market Structure & Competitive Landscape
The hydro generators market exhibits a moderately concentrated structure, with several major players holding significant market share. However, the presence of numerous smaller companies and regional players contributes to competitive dynamism. Concentration ratios, while varying across segments (large, small, micro), indicate a moderately consolidated landscape. For instance, the top five players – Nidec Industrial Solutions, Voith GmbH & Co KGaA, Siemens AG, Toshiba America Energy Systems Corporation, and Hitachi Mitsubishi Hydro Corporation – collectively hold approximately xx% of the global market share in 2025.
Key Market Dynamics:
- Innovation Drivers: Technological advancements in generator design, materials, and control systems continuously drive market innovation, leading to increased efficiency, reliability, and lifespan.
- Regulatory Impacts: Government policies promoting renewable energy, particularly hydropower, significantly influence market growth. Stringent environmental regulations also play a critical role in shaping technological choices and market strategies.
- Product Substitutes: While hydropower remains a cost-effective and sustainable energy source, competing renewable technologies like solar and wind power exert some competitive pressure.
- End-User Segmentation: The market is segmented into various end-users, including utility companies, independent power producers (IPPs), and industrial consumers, each with specific needs and purchasing patterns.
- M&A Trends: Consolidation activities within the hydro generator market have been moderate. The number of mergers and acquisitions (M&A) deals between 2019 and 2024 totaled approximately xx, primarily driven by strategic expansion and technological integration.
Hydro Generators Industry Market Trends & Opportunities
The global hydro generator market is experiencing significant growth, fueled by increasing demand for renewable energy sources and ongoing investments in hydropower infrastructure worldwide. The market size is projected to expand from xx Million in 2025 to xx Million by 2033, reflecting a strong CAGR of xx%. This growth is driven by several key factors:
- Technological advancements: Improvements in generator design, materials, and control systems are enhancing efficiency and reducing costs.
- Government support: Many governments are implementing policies to incentivize renewable energy adoption, creating a favorable regulatory environment for hydropower.
- Expanding infrastructure: Ongoing development of hydropower projects globally is creating substantial demand for hydro generators.
- Environmental concerns: Growing awareness of climate change and the need to reduce carbon emissions is boosting the adoption of clean energy sources like hydropower.
Market penetration rates for hydro generators vary across regions and segments, with higher penetration observed in regions with well-established hydropower infrastructure and supportive government policies. Competitive dynamics are characterized by intense competition among established players and emerging entrants, with a focus on technological differentiation, cost competitiveness, and customer service.
Dominant Markets & Segments in Hydro Generators Industry
The Asia-Pacific region holds a dominant position in the global hydro generators market, driven by substantial investments in hydropower projects and strong government support for renewable energy initiatives. China, India, and Southeast Asian countries are key growth markets.
Key Growth Drivers in Asia-Pacific:
- Extensive hydropower resources: The region possesses vast untapped hydropower potential.
- Government support for renewable energy: Numerous governments are implementing policies to promote the development of renewable energy sources.
- Rapid economic growth: The region's robust economic growth is fueling demand for electricity, creating opportunities for hydropower expansion.
Segment Analysis:
- Large Hydro Generators: This segment dominates the market due to the significant scale of large-scale hydropower projects.
- Small and Micro Hydro Generators: These segments are showing significant growth, driven by the increasing adoption of decentralized hydropower solutions in remote areas.
The North American and European markets are also relatively mature, characterized by a focus on refurbishment and modernization projects.
Hydro Generators Industry Product Analysis
Hydro generators are available in a wide range of sizes and configurations to cater to diverse hydropower project requirements. Technological advancements are focused on enhancing efficiency, reliability, and durability. These advancements include the use of advanced materials, improved control systems, and sophisticated monitoring technologies. Key competitive advantages include superior performance, lower maintenance costs, and longer lifespan. The market offers both synchronous and asynchronous generators, each tailored to specific applications.
Key Drivers, Barriers & Challenges in Hydro Generators Industry
Key Drivers:
- Increasing global demand for renewable energy.
- Government incentives and supportive policies for hydropower.
- Technological advancements enhancing efficiency and reliability.
- Growing environmental awareness and concerns about climate change.
Challenges and Restraints:
- High upfront capital costs associated with hydropower project development.
- Environmental concerns related to the impact of dams on aquatic ecosystems.
- Regulatory complexities and permitting challenges.
- Geographic limitations restricting the feasibility of hydropower projects.
- Supply chain disruptions affecting the availability of raw materials and components. This has led to an estimated xx% increase in production costs in some regions in 2024.
Growth Drivers in the Hydro Generators Industry Market
The hydro generators industry is propelled by a confluence of factors: a global push towards renewable energy adoption, governmental support through subsidies and favorable policies, and continuous technological improvements leading to more efficient and sustainable generators. The increasing awareness of climate change further fuels this growth, making hydropower a more attractive option for power generation.
Challenges Impacting Hydro Generators Industry Growth
Despite its strong growth trajectory, the hydro generators industry faces challenges. These include the high initial investment required for hydropower projects, environmental concerns regarding dam construction and its impact on ecosystems, and complex regulatory approvals processes, which can lead to project delays. Furthermore, supply chain disruptions and geopolitical instability can affect the availability of crucial components, hindering production.
Key Players Shaping the Hydro Generators Industry Market
- Nidec Industrial Solutions
- Voith GmbH & Co KGaA
- Siemens AG
- Toshiba America Energy Systems Corporation
- Hitachi Mitsubishi Hydro Corporation
- OJSC Power Machines
- General Electric Company
- Global Hydro Energy GmbH
- Andritz AG
- WEG SA
Significant Hydro Generators Industry Industry Milestones
- January 2022: GE Renewable Energy and Avista Utilities partnered to upgrade four generator units at the Long Lake hydropower facility in the US, increasing the plant's capacity to over 100 MW, enough to power 80,000 homes. This highlights the significant market for refurbishment and upgrades.
- March 2022: The introduction of a pico-hydro generation system by a Japanese multinational demonstrates the expanding market for smaller-scale hydropower solutions.
Future Outlook for Hydro Generators Industry Market
The hydro generators market is poised for continued growth, driven by the ongoing global shift towards renewable energy and the increasing demand for sustainable power solutions. Strategic partnerships, technological innovations, and supportive government policies will further propel market expansion, creating significant opportunities for industry players. The focus on improving efficiency, lowering costs, and minimizing environmental impact will remain crucial for sustained growth in this dynamic sector.
Hydro Generators Industry Segmentation
-
1. Size
- 1.1. Large
- 1.2. Small
- 1.3. Micro
Hydro Generators Industry Segmentation By Geography
- 1. North America
- 2. Asia Pacific
- 3. Europe
- 4. South America
- 5. Middle East
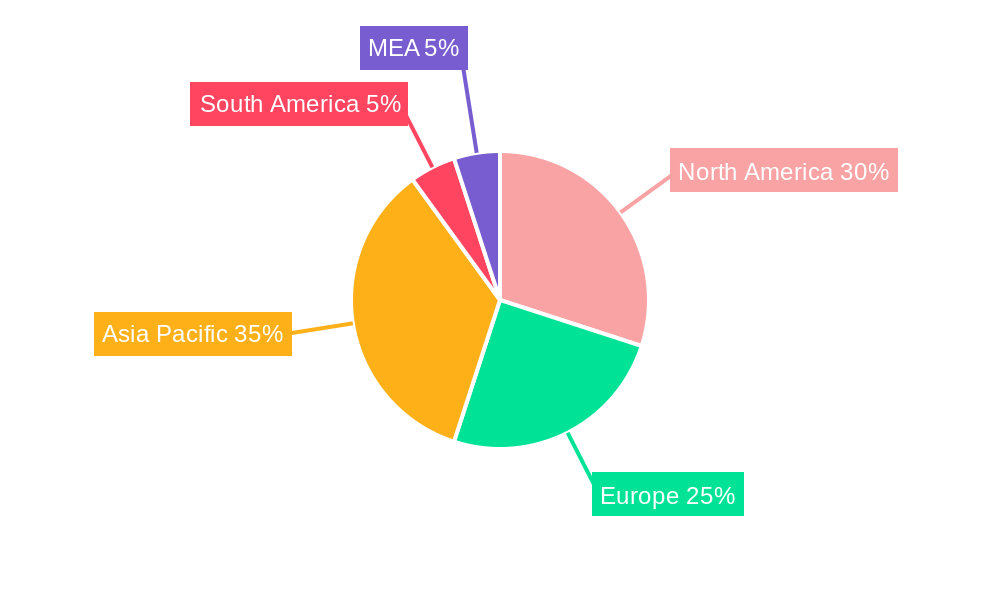
Hydro Generators Industry Regional Market Share
Geographic Coverage of Hydro Generators Industry
Hydro Generators Industry REPORT HIGHLIGHTS
| Aspects | Details |
|---|---|
| Study Period | 2020-2034 |
| Base Year | 2025 |
| Estimated Year | 2026 |
| Forecast Period | 2026-2034 |
| Historical Period | 2020-2025 |
| Growth Rate | CAGR of 4.3% from 2020-2034 |
| Segmentation |
|
Table of Contents
- 1. Introduction
- 1.1. Research Scope
- 1.2. Market Segmentation
- 1.3. Research Objective
- 1.4. Definitions and Assumptions
- 2. Executive Summary
- 2.1. Market Snapshot
- 3. Market Dynamics
- 3.1. Market Drivers
- 3.2. Market Restrains
- 3.3. Market Trends
- 3.4. Market Opportunities
- 4. Market Factor Analysis
- 4.1. Porters Five Forces
- 4.1.1. Bargaining Power of Suppliers
- 4.1.2. Bargaining Power of Buyers
- 4.1.3. Threat of New Entrants
- 4.1.4. Threat of Substitutes
- 4.1.5. Competitive Rivalry
- 4.2. PESTEL analysis
- 4.3. BCG Analysis
- 4.3.1. Stars (High Growth, High Market Share)
- 4.3.2. Cash Cows (Low Growth, High Market Share)
- 4.3.3. Question Mark (High Growth, Low Market Share)
- 4.3.4. Dogs (Low Growth, Low Market Share)
- 4.4. Ansoff Matrix Analysis
- 4.5. Supply Chain Analysis
- 4.6. Regulatory Landscape
- 4.7. Current Market Potential and Opportunity Assessment (TAM–SAM–SOM Framework)
- 4.8. TIR Analyst Note
- 4.1. Porters Five Forces
- 5. Market Analysis, Insights and Forecast 2021-2033
- 5.1. Market Analysis, Insights and Forecast - by Size
- 5.1.1. Large
- 5.1.2. Small
- 5.1.3. Micro
- 5.2. Market Analysis, Insights and Forecast - by Region
- 5.2.1. North America
- 5.2.2. Asia Pacific
- 5.2.3. Europe
- 5.2.4. South America
- 5.2.5. Middle East
- 5.1. Market Analysis, Insights and Forecast - by Size
- 6. Global Hydro Generators Industry Analysis, Insights and Forecast, 2021-2033
- 6.1. Market Analysis, Insights and Forecast - by Size
- 6.1.1. Large
- 6.1.2. Small
- 6.1.3. Micro
- 6.1. Market Analysis, Insights and Forecast - by Size
- 7. North America Hydro Generators Industry Analysis, Insights and Forecast, 2020-2032
- 7.1. Market Analysis, Insights and Forecast - by Size
- 7.1.1. Large
- 7.1.2. Small
- 7.1.3. Micro
- 7.1. Market Analysis, Insights and Forecast - by Size
- 8. Asia Pacific Hydro Generators Industry Analysis, Insights and Forecast, 2020-2032
- 8.1. Market Analysis, Insights and Forecast - by Size
- 8.1.1. Large
- 8.1.2. Small
- 8.1.3. Micro
- 8.1. Market Analysis, Insights and Forecast - by Size
- 9. Europe Hydro Generators Industry Analysis, Insights and Forecast, 2020-2032
- 9.1. Market Analysis, Insights and Forecast - by Size
- 9.1.1. Large
- 9.1.2. Small
- 9.1.3. Micro
- 9.1. Market Analysis, Insights and Forecast - by Size
- 10. South America Hydro Generators Industry Analysis, Insights and Forecast, 2020-2032
- 10.1. Market Analysis, Insights and Forecast - by Size
- 10.1.1. Large
- 10.1.2. Small
- 10.1.3. Micro
- 10.1. Market Analysis, Insights and Forecast - by Size
- 11. Middle East Hydro Generators Industry Analysis, Insights and Forecast, 2020-2032
- 11.1. Market Analysis, Insights and Forecast - by Size
- 11.1.1. Large
- 11.1.2. Small
- 11.1.3. Micro
- 11.1. Market Analysis, Insights and Forecast - by Size
- 12. Competitive Analysis
- 12.1. Company Profiles
- 12.1.1 Nidec Industrial Solutions
- 12.1.1.1. Company Overview
- 12.1.1.2. Products
- 12.1.1.3. Company Financials
- 12.1.1.4. SWOT Analysis
- 12.1.2 Voith GmbH & Co KGaA
- 12.1.2.1. Company Overview
- 12.1.2.2. Products
- 12.1.2.3. Company Financials
- 12.1.2.4. SWOT Analysis
- 12.1.3 Siemens AG*List Not Exhaustive
- 12.1.3.1. Company Overview
- 12.1.3.2. Products
- 12.1.3.3. Company Financials
- 12.1.3.4. SWOT Analysis
- 12.1.4 Toshiba America Energy Systens Corporation
- 12.1.4.1. Company Overview
- 12.1.4.2. Products
- 12.1.4.3. Company Financials
- 12.1.4.4. SWOT Analysis
- 12.1.5 Hitachi Mitsubishi Hydro Corporation
- 12.1.5.1. Company Overview
- 12.1.5.2. Products
- 12.1.5.3. Company Financials
- 12.1.5.4. SWOT Analysis
- 12.1.6 OJSC Power Machines
- 12.1.6.1. Company Overview
- 12.1.6.2. Products
- 12.1.6.3. Company Financials
- 12.1.6.4. SWOT Analysis
- 12.1.7 General Electric Company
- 12.1.7.1. Company Overview
- 12.1.7.2. Products
- 12.1.7.3. Company Financials
- 12.1.7.4. SWOT Analysis
- 12.1.8 Global Hydro Energy GmbH
- 12.1.8.1. Company Overview
- 12.1.8.2. Products
- 12.1.8.3. Company Financials
- 12.1.8.4. SWOT Analysis
- 12.1.9 Andritz AG
- 12.1.9.1. Company Overview
- 12.1.9.2. Products
- 12.1.9.3. Company Financials
- 12.1.9.4. SWOT Analysis
- 12.1.10 WEG SA
- 12.1.10.1. Company Overview
- 12.1.10.2. Products
- 12.1.10.3. Company Financials
- 12.1.10.4. SWOT Analysis
- 12.1.1 Nidec Industrial Solutions
- 12.2. Market Entropy
- 12.2.1 Company's Key Areas Served
- 12.2.2 Recent Developments
- 12.3. Company Market Share Analysis 2025
- 12.3.1 Top 5 Companies Market Share Analysis
- 12.3.2 Top 3 Companies Market Share Analysis
- 12.4. List of Potential Customers
- 13. Research Methodology
List of Figures
- Figure 1: Global Hydro Generators Industry Revenue Breakdown (billion, %) by Region 2025 & 2033
- Figure 2: North America Hydro Generators Industry Revenue (billion), by Size 2025 & 2033
- Figure 3: North America Hydro Generators Industry Revenue Share (%), by Size 2025 & 2033
- Figure 4: North America Hydro Generators Industry Revenue (billion), by Country 2025 & 2033
- Figure 5: North America Hydro Generators Industry Revenue Share (%), by Country 2025 & 2033
- Figure 6: Asia Pacific Hydro Generators Industry Revenue (billion), by Size 2025 & 2033
- Figure 7: Asia Pacific Hydro Generators Industry Revenue Share (%), by Size 2025 & 2033
- Figure 8: Asia Pacific Hydro Generators Industry Revenue (billion), by Country 2025 & 2033
- Figure 9: Asia Pacific Hydro Generators Industry Revenue Share (%), by Country 2025 & 2033
- Figure 10: Europe Hydro Generators Industry Revenue (billion), by Size 2025 & 2033
- Figure 11: Europe Hydro Generators Industry Revenue Share (%), by Size 2025 & 2033
- Figure 12: Europe Hydro Generators Industry Revenue (billion), by Country 2025 & 2033
- Figure 13: Europe Hydro Generators Industry Revenue Share (%), by Country 2025 & 2033
- Figure 14: South America Hydro Generators Industry Revenue (billion), by Size 2025 & 2033
- Figure 15: South America Hydro Generators Industry Revenue Share (%), by Size 2025 & 2033
- Figure 16: South America Hydro Generators Industry Revenue (billion), by Country 2025 & 2033
- Figure 17: South America Hydro Generators Industry Revenue Share (%), by Country 2025 & 2033
- Figure 18: Middle East Hydro Generators Industry Revenue (billion), by Size 2025 & 2033
- Figure 19: Middle East Hydro Generators Industry Revenue Share (%), by Size 2025 & 2033
- Figure 20: Middle East Hydro Generators Industry Revenue (billion), by Country 2025 & 2033
- Figure 21: Middle East Hydro Generators Industry Revenue Share (%), by Country 2025 & 2033
List of Tables
- Table 1: Global Hydro Generators Industry Revenue billion Forecast, by Size 2020 & 2033
- Table 2: Global Hydro Generators Industry Revenue billion Forecast, by Region 2020 & 2033
- Table 3: Global Hydro Generators Industry Revenue billion Forecast, by Size 2020 & 2033
- Table 4: Global Hydro Generators Industry Revenue billion Forecast, by Country 2020 & 2033
- Table 5: Global Hydro Generators Industry Revenue billion Forecast, by Size 2020 & 2033
- Table 6: Global Hydro Generators Industry Revenue billion Forecast, by Country 2020 & 2033
- Table 7: Global Hydro Generators Industry Revenue billion Forecast, by Size 2020 & 2033
- Table 8: Global Hydro Generators Industry Revenue billion Forecast, by Country 2020 & 2033
- Table 9: Global Hydro Generators Industry Revenue billion Forecast, by Size 2020 & 2033
- Table 10: Global Hydro Generators Industry Revenue billion Forecast, by Country 2020 & 2033
- Table 11: Global Hydro Generators Industry Revenue billion Forecast, by Size 2020 & 2033
- Table 12: Global Hydro Generators Industry Revenue billion Forecast, by Country 2020 & 2033
Frequently Asked Questions
1. What is the projected Compound Annual Growth Rate (CAGR) of the Hydro Generators Industry?
The projected CAGR is approximately 4.3%.
2. Which companies are prominent players in the Hydro Generators Industry?
Key companies in the market include Nidec Industrial Solutions, Voith GmbH & Co KGaA, Siemens AG*List Not Exhaustive, Toshiba America Energy Systens Corporation, Hitachi Mitsubishi Hydro Corporation, OJSC Power Machines, General Electric Company, Global Hydro Energy GmbH, Andritz AG, WEG SA.
3. What are the main segments of the Hydro Generators Industry?
The market segments include Size.
4. Can you provide details about the market size?
The market size is estimated to be USD 7 billion as of 2022.
5. What are some drivers contributing to market growth?
4.; Increasing Population Growth and Infrastructure Development.
6. What are the notable trends driving market growth?
Large Hydro Generator as a Prominent Segment.
7. Are there any restraints impacting market growth?
4.; High Operational and Maintenance Costs.
8. Can you provide examples of recent developments in the market?
In January 2022, In order to update four generator units at the Long Lake hydropower facility in the United States, GE Renewable Energy, and Avista Utilities, a US energy company serving four northwest states, entered into a service agreement. After the renovation project is finished, the plant will have an installed capacity that exceeds 100 MW. This quantity of energy can supply all the electricity that 80,000 houses would need.
9. What pricing options are available for accessing the report?
Pricing options include single-user, multi-user, and enterprise licenses priced at USD 4750, USD 5250, and USD 8750 respectively.
10. Is the market size provided in terms of value or volume?
The market size is provided in terms of value, measured in billion.
11. Are there any specific market keywords associated with the report?
Yes, the market keyword associated with the report is "Hydro Generators Industry," which aids in identifying and referencing the specific market segment covered.
12. How do I determine which pricing option suits my needs best?
The pricing options vary based on user requirements and access needs. Individual users may opt for single-user licenses, while businesses requiring broader access may choose multi-user or enterprise licenses for cost-effective access to the report.
13. Are there any additional resources or data provided in the Hydro Generators Industry report?
While the report offers comprehensive insights, it's advisable to review the specific contents or supplementary materials provided to ascertain if additional resources or data are available.
14. How can I stay updated on further developments or reports in the Hydro Generators Industry?
To stay informed about further developments, trends, and reports in the Hydro Generators Industry, consider subscribing to industry newsletters, following relevant companies and organizations, or regularly checking reputable industry news sources and publications.
Methodology
Step 1 - Identification of Relevant Samples Size from Population Database


Step 2 - Approaches for Defining Global Market Size (Value, Volume* & Price*)

Note*: In applicable scenarios
Step 3 - Data Sources
Primary Research
- Web Analytics
- Survey Reports
- Research Institute
- Latest Research Reports
- Opinion Leaders
Secondary Research
- Annual Reports
- White Paper
- Latest Press Release
- Industry Association
- Paid Database
- Investor Presentations

Step 4 - Data Triangulation
Involves using different sources of information in order to increase the validity of a study
These sources are likely to be stakeholders in a program - participants, other researchers, program staff, other community members, and so on.
Then we put all data in single framework & apply various statistical tools to find out the dynamic on the market.
During the analysis stage, feedback from the stakeholder groups would be compared to determine areas of agreement as well as areas of divergence