

Key Insights
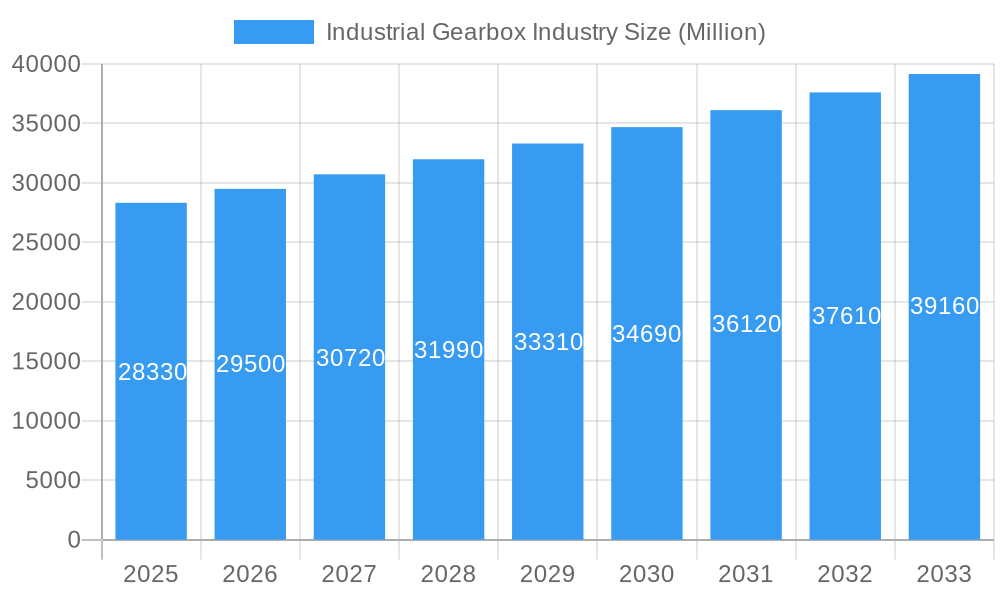
The global industrial gearbox market, valued at $28.33 billion in 2025, is projected to experience robust growth, driven by increasing automation across various industries and rising demand for energy-efficient solutions. A compound annual growth rate (CAGR) of 4.20% from 2025 to 2033 indicates a significant expansion, with the market size expected to surpass $40 billion by 2033. Key growth drivers include the burgeoning manufacturing sector, particularly in developing economies like China and India, the escalating need for efficient power transmission in renewable energy projects (wind and solar), and the expanding mining and minerals industry. The increasing adoption of advanced technologies, such as smart gearboxes with predictive maintenance capabilities, is further propelling market growth. Segmentation analysis reveals that worm gearboxes and helical gearboxes dominate the market in terms of type, while the power and manufacturing industries are major application segments. Competitive dynamics are shaped by the presence of established players like Flender, Sew-Eurodrive, and Bosch Rexroth, alongside emerging regional manufacturers, fostering innovation and price competition.
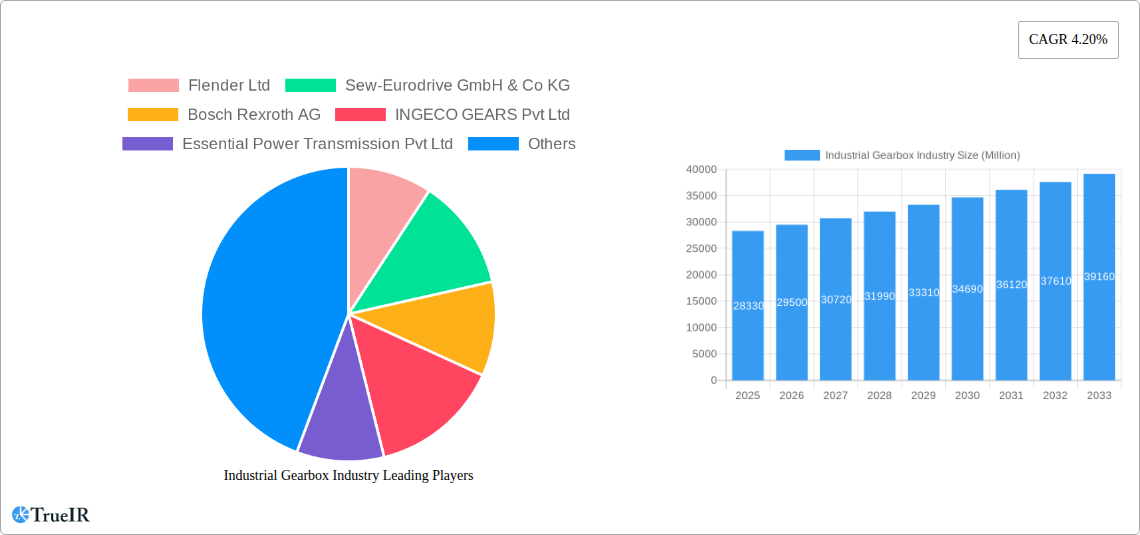
Industrial Gearbox Industry Market Size (In Billion)
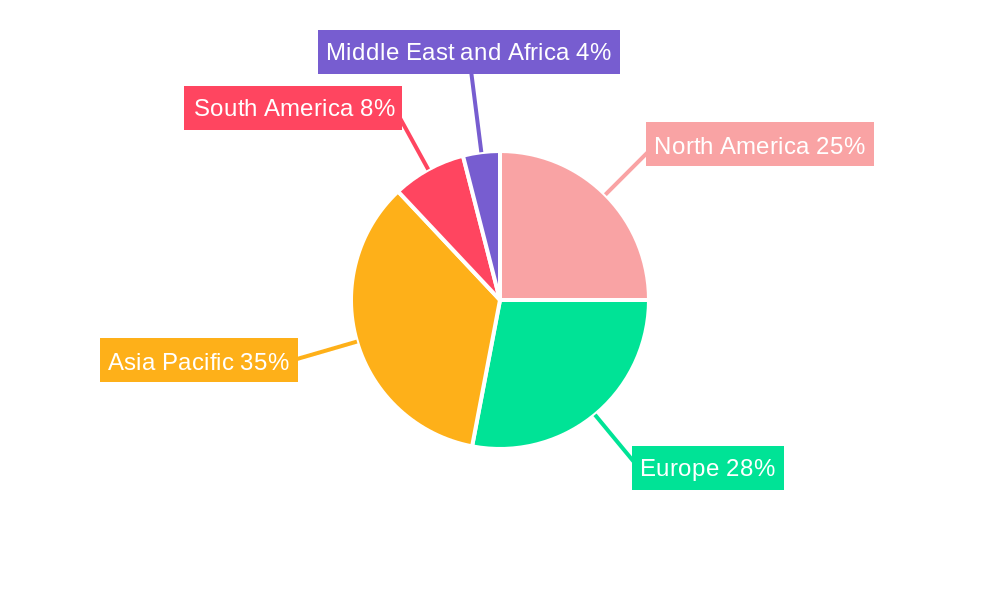
The geographical distribution of the market reveals strong growth potential in the Asia-Pacific region, fueled by rapid industrialization and infrastructure development. North America and Europe, while mature markets, are expected to experience steady growth driven by technological advancements and upgrades in existing infrastructure. However, factors such as fluctuating raw material prices, supply chain disruptions, and the cyclical nature of certain industries (like mining) pose potential restraints on market growth. To mitigate these challenges, manufacturers are focusing on strategic partnerships, technological innovation (e.g., developing lighter, more durable materials and improved lubrication technologies), and customized solutions to cater to specific industry needs. This ensures sustained growth and a resilient market position in the long term. The market is poised for sustained expansion, driven by a confluence of technological and economic factors.
Industrial Gearbox Industry Company Market Share
Industrial Gearbox Industry Market Report: 2019-2033 Forecast
This comprehensive report provides a detailed analysis of the global industrial gearbox market, projecting a robust growth trajectory from 2019 to 2033. We delve into market structure, competitive dynamics, key segments, technological advancements, and future outlook, offering invaluable insights for industry stakeholders, investors, and strategic decision-makers. The report covers a market valued at over $XX Million in 2025, and projects significant expansion throughout the forecast period (2025-2033). The study period spans from 2019 to 2033, with 2025 serving as both the base and estimated year.
Industrial Gearbox Industry Market Structure & Competitive Landscape
The industrial gearbox market is characterized by a moderately concentrated structure, featuring a dynamic interplay between established multinational corporations and agile regional manufacturers. The leading entities, including but not limited to Flender Ltd, Sew-Eurodrive GmbH & Co KG, Bosch Rexroth AG, and Getriebebau NORD GmbH & Co KG, collectively command a substantial market share, estimated to be around xx%. Alongside these giants, a robust ecosystem of smaller, specialized manufacturers actively carves out significant niches through tailored solutions and deep application expertise. Competition is largely fueled by continuous innovation in advanced materials, sophisticated manufacturing techniques, and the strategic implementation of Industry 4.0 principles. Adherence to increasingly stringent regulatory frameworks, particularly those focusing on energy efficiency, operational safety, and environmental impact, is paramount and a key differentiator. Furthermore, the market navigates competitive pressures from alternative power transmission solutions such as direct-drive motors and advanced belt-driven systems.
- Market Concentration: Top 5 players expected to hold approximately xx% of the market share by 2025, indicating a significant but not entirely monopolistic landscape.
- Innovation Drivers: Key advancements include the adoption of high-performance composite materials, ultra-precision manufacturing for enhanced reliability, and the integration of digitalization for predictive maintenance and smart operational insights.
- Regulatory Impacts: Evolving energy efficiency mandates and enhanced safety protocols are compelling manufacturers to invest heavily in technological upgrades and innovative designs.
- Product Substitutes: Ongoing competition from direct-drive motors and a variety of emerging alternative transmission technologies necessitates continuous product development and value proposition enhancement.
- End-User Segmentation: Robust demand is observed across critical sectors such as power generation, steel and metals processing, mining operations, general manufacturing, and essential infrastructure like wastewater treatment facilities.
- M&A Trends: The industry anticipates a sustained trend of consolidation, with projections indicating approximately xx significant merger and acquisition deals anticipated between 2025 and 2033, driven by strategic growth and market expansion objectives.
Industrial Gearbox Industry Market Trends & Opportunities
The industrial gearbox market is poised for significant growth, driven by increasing industrial automation, rising infrastructure investments globally, and a growing demand for efficient power transmission solutions. We project a Compound Annual Growth Rate (CAGR) of xx% from 2025 to 2033. Technological shifts toward high-efficiency gearboxes, incorporating advanced materials and designs, are reshaping the competitive landscape. Consumer preferences are moving towards modular, customizable, and digitally connected solutions. Market penetration of these advanced gearboxes is expected to reach xx% by 2033. The market expansion is further influenced by escalating demand in emerging economies, particularly in Asia-Pacific and South America.
Dominant Markets & Segments in Industrial Gearbox Industry
The manufacturing industry, driven by robust growth in automation and the need for efficient production processes, represents the largest segment, holding an estimated xx% market share in 2025. The Helical Gearbox segment dominates the Type category, owing to its versatility and wide applicability across various industrial processes, commanding around xx% of the market. Geographically, China holds the largest market share, driven by substantial infrastructure development and a booming manufacturing sector.
- Key Growth Drivers (China): Massive industrial expansion, government initiatives promoting manufacturing automation, and robust infrastructure projects.
- Key Growth Drivers (Manufacturing Industry): Increased automation adoption, modernization initiatives, and focus on production efficiency.
- Key Growth Drivers (Helical Gearboxes): Versatility, high efficiency, and cost-effectiveness compared to other gearbox types.
Industrial Gearbox Industry Product Analysis
Recent product development in the industrial gearbox sector is sharply focused on delivering tangible improvements in energy efficiency, extending operational lifespan, and significantly reducing acoustic emissions. The integration of sophisticated sensor technology and advanced predictive maintenance algorithms is revolutionizing gearbox reliability, minimizing unplanned downtime, and optimizing performance throughout their lifecycle. A notable market trend is the growing demand for compact, lightweight, yet high-performance gearbox solutions capable of withstanding extreme operational conditions. These advancements are directly addressing the industry's persistent need for enhanced productivity, reduced maintenance costs, and greater overall operational resilience.
Key Drivers, Barriers & Challenges in Industrial Gearbox Industry
Key Drivers: Increased automation in manufacturing, rising infrastructure spending globally, and demand for energy-efficient solutions in diverse industries. Government policies promoting energy efficiency and industrial modernization further accelerate market growth.
Challenges: Supply chain disruptions, particularly concerning raw materials and components, pose a major hurdle. Increasing raw material costs add to the production expense, while stringent regulatory requirements can increase compliance costs. Intense competition among established players and the emergence of new technologies create challenges for sustained market share.
Growth Drivers in the Industrial Gearbox Industry Market
The growth of the industrial gearbox market is fueled by factors including technological advancements in gearbox design and materials, substantial investments in infrastructure development across various regions, and rising automation levels in the manufacturing sector. Government regulations promoting energy efficiency also play a key role in driving demand for high-efficiency gearboxes.
Challenges Impacting Industrial Gearbox Industry Growth
The industrial gearbox market is navigating several significant challenges. Volatile fluctuations in raw material prices can directly impact production costs and profitability. Uncertainties within global supply chains can lead to production delays and further cost escalations. Intense competition, particularly from manufacturers offering innovative yet cost-effective solutions, places continuous pressure on pricing and market share. Furthermore, the imperative to comply with evolving regulatory landscapes and increasingly stringent safety standards can present substantial hurdles and necessitate significant investment in research and development.
Key Players Shaping the Industrial Gearbox Industry Market
- Flender Ltd
- Sew-Eurodrive GmbH & Co KG
- Bosch Rexroth AG
- INGECO GEARS Pvt Ltd
- Essential Power Transmission Pvt Ltd
- Getriebebau NORD GmbH & Co KG
- Nanjing High Accurate Drive Equipment Manufacturing Group Co Ltd
- Zollern GmbH & Co KG
- Lenze SE
- Kngear
- Elecon Engineering Company Limited
- Bonfiglioli Drives Co Ltd
Significant Industrial Gearbox Industry Industry Milestones
- May 2023: Triumph Group, Inc. solidified its market standing by securing a substantial, long-term agreement with General Electric (GE) for the annual supply of thousands of integrated gearboxes over the next decade.
- January 2023: Airbus Helicopters bolstered its advanced transmission capabilities and production capacity by acquiring ZF Luftfahrttechnik, thereby enhancing its overhaul and manufacturing operations for critical helicopter programs like the H145 and H135.
Future Outlook for Industrial Gearbox Industry Market
The industrial gearbox market is projected to experience sustained growth, propelled by ongoing automation trends, expanding global infrastructure projects, and a continuous demand for high-efficiency, reliable power transmission solutions. Strategic partnerships, technological innovations, and expansion into new geographical markets present significant growth opportunities. The market anticipates the integration of advanced technologies such as artificial intelligence and the Internet of Things (IoT) for predictive maintenance and optimized performance.
Industrial Gearbox Industry Segmentation
-
1. Type
- 1.1. Worm Gearbox
- 1.2. Helical Gearbox
- 1.3. Bevel Helical Gearbox
- 1.4. Planetary Gearbox
- 1.5. Other Types
-
2. Application
- 2.1. Power Industry
- 2.2. Steel Industry
- 2.3. Mines and Minerals Industry
- 2.4. Wastewater Treatment Industry
- 2.5. Manufacturing Industry
- 2.6. Other Applications
Industrial Gearbox Industry Segmentation By Geography
-
1. North America
- 1.1. United States
- 1.2. Canada
- 1.3. Rest of North America
-
2. Europe
- 2.1. Germany
- 2.2. France
- 2.3. United Kingdom
- 2.4. Rest of Europe
-
3. Asia Pacific
- 3.1. China
- 3.2. India
- 3.3. Japan
- 3.4. South Korea
- 3.5. Rest of Asia Pacific
-
4. South America
- 4.1. Brazil
- 4.2. Argentina
- 4.3. Rest of South America
-
5. Middle East and Africa
- 5.1. Saudi Arabia
- 5.2. United Arab Emirates
- 5.3. South Africa
- 5.4. Rest of Middle East and Africa
Industrial Gearbox Industry Regional Market Share
Geographic Coverage of Industrial Gearbox Industry
Industrial Gearbox Industry REPORT HIGHLIGHTS
| Aspects | Details |
|---|---|
| Study Period | 2020-2034 |
| Base Year | 2025 |
| Estimated Year | 2026 |
| Forecast Period | 2026-2034 |
| Historical Period | 2020-2025 |
| Growth Rate | CAGR of 4.20% from 2020-2034 |
| Segmentation |
|
Table of Contents
- 1. Introduction
- 1.1. Research Scope
- 1.2. Market Segmentation
- 1.3. Research Objective
- 1.4. Definitions and Assumptions
- 2. Executive Summary
- 2.1. Market Snapshot
- 3. Market Dynamics
- 3.1. Market Drivers
- 3.2. Market Restrains
- 3.3. Market Trends
- 3.4. Market Opportunities
- 4. Market Factor Analysis
- 4.1. Porters Five Forces
- 4.1.1. Bargaining Power of Suppliers
- 4.1.2. Bargaining Power of Buyers
- 4.1.3. Threat of New Entrants
- 4.1.4. Threat of Substitutes
- 4.1.5. Competitive Rivalry
- 4.2. PESTEL analysis
- 4.3. BCG Analysis
- 4.3.1. Stars (High Growth, High Market Share)
- 4.3.2. Cash Cows (Low Growth, High Market Share)
- 4.3.3. Question Mark (High Growth, Low Market Share)
- 4.3.4. Dogs (Low Growth, Low Market Share)
- 4.4. Ansoff Matrix Analysis
- 4.5. Supply Chain Analysis
- 4.6. Regulatory Landscape
- 4.7. Current Market Potential and Opportunity Assessment (TAM–SAM–SOM Framework)
- 4.8. TIR Analyst Note
- 4.1. Porters Five Forces
- 5. Market Analysis, Insights and Forecast 2021-2033
- 5.1. Market Analysis, Insights and Forecast - by Type
- 5.1.1. Worm Gearbox
- 5.1.2. Helical Gearbox
- 5.1.3. Bevel Helical Gearbox
- 5.1.4. Planetary Gearbox
- 5.1.5. Other Types
- 5.2. Market Analysis, Insights and Forecast - by Application
- 5.2.1. Power Industry
- 5.2.2. Steel Industry
- 5.2.3. Mines and Minerals Industry
- 5.2.4. Wastewater Treatment Industry
- 5.2.5. Manufacturing Industry
- 5.2.6. Other Applications
- 5.3. Market Analysis, Insights and Forecast - by Region
- 5.3.1. North America
- 5.3.2. Europe
- 5.3.3. Asia Pacific
- 5.3.4. South America
- 5.3.5. Middle East and Africa
- 5.1. Market Analysis, Insights and Forecast - by Type
- 6. Global Industrial Gearbox Industry Analysis, Insights and Forecast, 2021-2033
- 6.1. Market Analysis, Insights and Forecast - by Type
- 6.1.1. Worm Gearbox
- 6.1.2. Helical Gearbox
- 6.1.3. Bevel Helical Gearbox
- 6.1.4. Planetary Gearbox
- 6.1.5. Other Types
- 6.2. Market Analysis, Insights and Forecast - by Application
- 6.2.1. Power Industry
- 6.2.2. Steel Industry
- 6.2.3. Mines and Minerals Industry
- 6.2.4. Wastewater Treatment Industry
- 6.2.5. Manufacturing Industry
- 6.2.6. Other Applications
- 6.1. Market Analysis, Insights and Forecast - by Type
- 7. North America Industrial Gearbox Industry Analysis, Insights and Forecast, 2020-2032
- 7.1. Market Analysis, Insights and Forecast - by Type
- 7.1.1. Worm Gearbox
- 7.1.2. Helical Gearbox
- 7.1.3. Bevel Helical Gearbox
- 7.1.4. Planetary Gearbox
- 7.1.5. Other Types
- 7.2. Market Analysis, Insights and Forecast - by Application
- 7.2.1. Power Industry
- 7.2.2. Steel Industry
- 7.2.3. Mines and Minerals Industry
- 7.2.4. Wastewater Treatment Industry
- 7.2.5. Manufacturing Industry
- 7.2.6. Other Applications
- 7.1. Market Analysis, Insights and Forecast - by Type
- 8. Europe Industrial Gearbox Industry Analysis, Insights and Forecast, 2020-2032
- 8.1. Market Analysis, Insights and Forecast - by Type
- 8.1.1. Worm Gearbox
- 8.1.2. Helical Gearbox
- 8.1.3. Bevel Helical Gearbox
- 8.1.4. Planetary Gearbox
- 8.1.5. Other Types
- 8.2. Market Analysis, Insights and Forecast - by Application
- 8.2.1. Power Industry
- 8.2.2. Steel Industry
- 8.2.3. Mines and Minerals Industry
- 8.2.4. Wastewater Treatment Industry
- 8.2.5. Manufacturing Industry
- 8.2.6. Other Applications
- 8.1. Market Analysis, Insights and Forecast - by Type
- 9. Asia Pacific Industrial Gearbox Industry Analysis, Insights and Forecast, 2020-2032
- 9.1. Market Analysis, Insights and Forecast - by Type
- 9.1.1. Worm Gearbox
- 9.1.2. Helical Gearbox
- 9.1.3. Bevel Helical Gearbox
- 9.1.4. Planetary Gearbox
- 9.1.5. Other Types
- 9.2. Market Analysis, Insights and Forecast - by Application
- 9.2.1. Power Industry
- 9.2.2. Steel Industry
- 9.2.3. Mines and Minerals Industry
- 9.2.4. Wastewater Treatment Industry
- 9.2.5. Manufacturing Industry
- 9.2.6. Other Applications
- 9.1. Market Analysis, Insights and Forecast - by Type
- 10. South America Industrial Gearbox Industry Analysis, Insights and Forecast, 2020-2032
- 10.1. Market Analysis, Insights and Forecast - by Type
- 10.1.1. Worm Gearbox
- 10.1.2. Helical Gearbox
- 10.1.3. Bevel Helical Gearbox
- 10.1.4. Planetary Gearbox
- 10.1.5. Other Types
- 10.2. Market Analysis, Insights and Forecast - by Application
- 10.2.1. Power Industry
- 10.2.2. Steel Industry
- 10.2.3. Mines and Minerals Industry
- 10.2.4. Wastewater Treatment Industry
- 10.2.5. Manufacturing Industry
- 10.2.6. Other Applications
- 10.1. Market Analysis, Insights and Forecast - by Type
- 11. Middle East and Africa Industrial Gearbox Industry Analysis, Insights and Forecast, 2020-2032
- 11.1. Market Analysis, Insights and Forecast - by Type
- 11.1.1. Worm Gearbox
- 11.1.2. Helical Gearbox
- 11.1.3. Bevel Helical Gearbox
- 11.1.4. Planetary Gearbox
- 11.1.5. Other Types
- 11.2. Market Analysis, Insights and Forecast - by Application
- 11.2.1. Power Industry
- 11.2.2. Steel Industry
- 11.2.3. Mines and Minerals Industry
- 11.2.4. Wastewater Treatment Industry
- 11.2.5. Manufacturing Industry
- 11.2.6. Other Applications
- 11.1. Market Analysis, Insights and Forecast - by Type
- 12. Competitive Analysis
- 12.1. Company Profiles
- 12.1.1 Flender Ltd
- 12.1.1.1. Company Overview
- 12.1.1.2. Products
- 12.1.1.3. Company Financials
- 12.1.1.4. SWOT Analysis
- 12.1.2 Sew-Eurodrive GmbH & Co KG
- 12.1.2.1. Company Overview
- 12.1.2.2. Products
- 12.1.2.3. Company Financials
- 12.1.2.4. SWOT Analysis
- 12.1.3 Bosch Rexroth AG
- 12.1.3.1. Company Overview
- 12.1.3.2. Products
- 12.1.3.3. Company Financials
- 12.1.3.4. SWOT Analysis
- 12.1.4 INGECO GEARS Pvt Ltd
- 12.1.4.1. Company Overview
- 12.1.4.2. Products
- 12.1.4.3. Company Financials
- 12.1.4.4. SWOT Analysis
- 12.1.5 Essential Power Transmission Pvt Ltd
- 12.1.5.1. Company Overview
- 12.1.5.2. Products
- 12.1.5.3. Company Financials
- 12.1.5.4. SWOT Analysis
- 12.1.6 Getriebebau NORD GmbH & Co KG
- 12.1.6.1. Company Overview
- 12.1.6.2. Products
- 12.1.6.3. Company Financials
- 12.1.6.4. SWOT Analysis
- 12.1.7 Nanjing High Accurate Drive Equipment Manufacturing Group Co Ltd
- 12.1.7.1. Company Overview
- 12.1.7.2. Products
- 12.1.7.3. Company Financials
- 12.1.7.4. SWOT Analysis
- 12.1.8 Zollern GmbH & Co KG
- 12.1.8.1. Company Overview
- 12.1.8.2. Products
- 12.1.8.3. Company Financials
- 12.1.8.4. SWOT Analysis
- 12.1.9 Lenze SE
- 12.1.9.1. Company Overview
- 12.1.9.2. Products
- 12.1.9.3. Company Financials
- 12.1.9.4. SWOT Analysis
- 12.1.10 Kngear
- 12.1.10.1. Company Overview
- 12.1.10.2. Products
- 12.1.10.3. Company Financials
- 12.1.10.4. SWOT Analysis
- 12.1.11 Elecon Engineering Company Limited
- 12.1.11.1. Company Overview
- 12.1.11.2. Products
- 12.1.11.3. Company Financials
- 12.1.11.4. SWOT Analysis
- 12.1.12 Bonfiglioli Drives Co Ltd
- 12.1.12.1. Company Overview
- 12.1.12.2. Products
- 12.1.12.3. Company Financials
- 12.1.12.4. SWOT Analysis
- 12.1.1 Flender Ltd
- 12.2. Market Entropy
- 12.2.1 Company's Key Areas Served
- 12.2.2 Recent Developments
- 12.3. Company Market Share Analysis 2025
- 12.3.1 Top 5 Companies Market Share Analysis
- 12.3.2 Top 3 Companies Market Share Analysis
- 12.4. List of Potential Customers
- 13. Research Methodology
List of Figures
- Figure 1: Global Industrial Gearbox Industry Revenue Breakdown (Million, %) by Region 2025 & 2033
- Figure 2: Global Industrial Gearbox Industry Volume Breakdown (K Unit, %) by Region 2025 & 2033
- Figure 3: North America Industrial Gearbox Industry Revenue (Million), by Type 2025 & 2033
- Figure 4: North America Industrial Gearbox Industry Volume (K Unit), by Type 2025 & 2033
- Figure 5: North America Industrial Gearbox Industry Revenue Share (%), by Type 2025 & 2033
- Figure 6: North America Industrial Gearbox Industry Volume Share (%), by Type 2025 & 2033
- Figure 7: North America Industrial Gearbox Industry Revenue (Million), by Application 2025 & 2033
- Figure 8: North America Industrial Gearbox Industry Volume (K Unit), by Application 2025 & 2033
- Figure 9: North America Industrial Gearbox Industry Revenue Share (%), by Application 2025 & 2033
- Figure 10: North America Industrial Gearbox Industry Volume Share (%), by Application 2025 & 2033
- Figure 11: North America Industrial Gearbox Industry Revenue (Million), by Country 2025 & 2033
- Figure 12: North America Industrial Gearbox Industry Volume (K Unit), by Country 2025 & 2033
- Figure 13: North America Industrial Gearbox Industry Revenue Share (%), by Country 2025 & 2033
- Figure 14: North America Industrial Gearbox Industry Volume Share (%), by Country 2025 & 2033
- Figure 15: Europe Industrial Gearbox Industry Revenue (Million), by Type 2025 & 2033
- Figure 16: Europe Industrial Gearbox Industry Volume (K Unit), by Type 2025 & 2033
- Figure 17: Europe Industrial Gearbox Industry Revenue Share (%), by Type 2025 & 2033
- Figure 18: Europe Industrial Gearbox Industry Volume Share (%), by Type 2025 & 2033
- Figure 19: Europe Industrial Gearbox Industry Revenue (Million), by Application 2025 & 2033
- Figure 20: Europe Industrial Gearbox Industry Volume (K Unit), by Application 2025 & 2033
- Figure 21: Europe Industrial Gearbox Industry Revenue Share (%), by Application 2025 & 2033
- Figure 22: Europe Industrial Gearbox Industry Volume Share (%), by Application 2025 & 2033
- Figure 23: Europe Industrial Gearbox Industry Revenue (Million), by Country 2025 & 2033
- Figure 24: Europe Industrial Gearbox Industry Volume (K Unit), by Country 2025 & 2033
- Figure 25: Europe Industrial Gearbox Industry Revenue Share (%), by Country 2025 & 2033
- Figure 26: Europe Industrial Gearbox Industry Volume Share (%), by Country 2025 & 2033
- Figure 27: Asia Pacific Industrial Gearbox Industry Revenue (Million), by Type 2025 & 2033
- Figure 28: Asia Pacific Industrial Gearbox Industry Volume (K Unit), by Type 2025 & 2033
- Figure 29: Asia Pacific Industrial Gearbox Industry Revenue Share (%), by Type 2025 & 2033
- Figure 30: Asia Pacific Industrial Gearbox Industry Volume Share (%), by Type 2025 & 2033
- Figure 31: Asia Pacific Industrial Gearbox Industry Revenue (Million), by Application 2025 & 2033
- Figure 32: Asia Pacific Industrial Gearbox Industry Volume (K Unit), by Application 2025 & 2033
- Figure 33: Asia Pacific Industrial Gearbox Industry Revenue Share (%), by Application 2025 & 2033
- Figure 34: Asia Pacific Industrial Gearbox Industry Volume Share (%), by Application 2025 & 2033
- Figure 35: Asia Pacific Industrial Gearbox Industry Revenue (Million), by Country 2025 & 2033
- Figure 36: Asia Pacific Industrial Gearbox Industry Volume (K Unit), by Country 2025 & 2033
- Figure 37: Asia Pacific Industrial Gearbox Industry Revenue Share (%), by Country 2025 & 2033
- Figure 38: Asia Pacific Industrial Gearbox Industry Volume Share (%), by Country 2025 & 2033
- Figure 39: South America Industrial Gearbox Industry Revenue (Million), by Type 2025 & 2033
- Figure 40: South America Industrial Gearbox Industry Volume (K Unit), by Type 2025 & 2033
- Figure 41: South America Industrial Gearbox Industry Revenue Share (%), by Type 2025 & 2033
- Figure 42: South America Industrial Gearbox Industry Volume Share (%), by Type 2025 & 2033
- Figure 43: South America Industrial Gearbox Industry Revenue (Million), by Application 2025 & 2033
- Figure 44: South America Industrial Gearbox Industry Volume (K Unit), by Application 2025 & 2033
- Figure 45: South America Industrial Gearbox Industry Revenue Share (%), by Application 2025 & 2033
- Figure 46: South America Industrial Gearbox Industry Volume Share (%), by Application 2025 & 2033
- Figure 47: South America Industrial Gearbox Industry Revenue (Million), by Country 2025 & 2033
- Figure 48: South America Industrial Gearbox Industry Volume (K Unit), by Country 2025 & 2033
- Figure 49: South America Industrial Gearbox Industry Revenue Share (%), by Country 2025 & 2033
- Figure 50: South America Industrial Gearbox Industry Volume Share (%), by Country 2025 & 2033
- Figure 51: Middle East and Africa Industrial Gearbox Industry Revenue (Million), by Type 2025 & 2033
- Figure 52: Middle East and Africa Industrial Gearbox Industry Volume (K Unit), by Type 2025 & 2033
- Figure 53: Middle East and Africa Industrial Gearbox Industry Revenue Share (%), by Type 2025 & 2033
- Figure 54: Middle East and Africa Industrial Gearbox Industry Volume Share (%), by Type 2025 & 2033
- Figure 55: Middle East and Africa Industrial Gearbox Industry Revenue (Million), by Application 2025 & 2033
- Figure 56: Middle East and Africa Industrial Gearbox Industry Volume (K Unit), by Application 2025 & 2033
- Figure 57: Middle East and Africa Industrial Gearbox Industry Revenue Share (%), by Application 2025 & 2033
- Figure 58: Middle East and Africa Industrial Gearbox Industry Volume Share (%), by Application 2025 & 2033
- Figure 59: Middle East and Africa Industrial Gearbox Industry Revenue (Million), by Country 2025 & 2033
- Figure 60: Middle East and Africa Industrial Gearbox Industry Volume (K Unit), by Country 2025 & 2033
- Figure 61: Middle East and Africa Industrial Gearbox Industry Revenue Share (%), by Country 2025 & 2033
- Figure 62: Middle East and Africa Industrial Gearbox Industry Volume Share (%), by Country 2025 & 2033
List of Tables
- Table 1: Global Industrial Gearbox Industry Revenue Million Forecast, by Type 2020 & 2033
- Table 2: Global Industrial Gearbox Industry Volume K Unit Forecast, by Type 2020 & 2033
- Table 3: Global Industrial Gearbox Industry Revenue Million Forecast, by Application 2020 & 2033
- Table 4: Global Industrial Gearbox Industry Volume K Unit Forecast, by Application 2020 & 2033
- Table 5: Global Industrial Gearbox Industry Revenue Million Forecast, by Region 2020 & 2033
- Table 6: Global Industrial Gearbox Industry Volume K Unit Forecast, by Region 2020 & 2033
- Table 7: Global Industrial Gearbox Industry Revenue Million Forecast, by Type 2020 & 2033
- Table 8: Global Industrial Gearbox Industry Volume K Unit Forecast, by Type 2020 & 2033
- Table 9: Global Industrial Gearbox Industry Revenue Million Forecast, by Application 2020 & 2033
- Table 10: Global Industrial Gearbox Industry Volume K Unit Forecast, by Application 2020 & 2033
- Table 11: Global Industrial Gearbox Industry Revenue Million Forecast, by Country 2020 & 2033
- Table 12: Global Industrial Gearbox Industry Volume K Unit Forecast, by Country 2020 & 2033
- Table 13: United States Industrial Gearbox Industry Revenue (Million) Forecast, by Application 2020 & 2033
- Table 14: United States Industrial Gearbox Industry Volume (K Unit) Forecast, by Application 2020 & 2033
- Table 15: Canada Industrial Gearbox Industry Revenue (Million) Forecast, by Application 2020 & 2033
- Table 16: Canada Industrial Gearbox Industry Volume (K Unit) Forecast, by Application 2020 & 2033
- Table 17: Rest of North America Industrial Gearbox Industry Revenue (Million) Forecast, by Application 2020 & 2033
- Table 18: Rest of North America Industrial Gearbox Industry Volume (K Unit) Forecast, by Application 2020 & 2033
- Table 19: Global Industrial Gearbox Industry Revenue Million Forecast, by Type 2020 & 2033
- Table 20: Global Industrial Gearbox Industry Volume K Unit Forecast, by Type 2020 & 2033
- Table 21: Global Industrial Gearbox Industry Revenue Million Forecast, by Application 2020 & 2033
- Table 22: Global Industrial Gearbox Industry Volume K Unit Forecast, by Application 2020 & 2033
- Table 23: Global Industrial Gearbox Industry Revenue Million Forecast, by Country 2020 & 2033
- Table 24: Global Industrial Gearbox Industry Volume K Unit Forecast, by Country 2020 & 2033
- Table 25: Germany Industrial Gearbox Industry Revenue (Million) Forecast, by Application 2020 & 2033
- Table 26: Germany Industrial Gearbox Industry Volume (K Unit) Forecast, by Application 2020 & 2033
- Table 27: France Industrial Gearbox Industry Revenue (Million) Forecast, by Application 2020 & 2033
- Table 28: France Industrial Gearbox Industry Volume (K Unit) Forecast, by Application 2020 & 2033
- Table 29: United Kingdom Industrial Gearbox Industry Revenue (Million) Forecast, by Application 2020 & 2033
- Table 30: United Kingdom Industrial Gearbox Industry Volume (K Unit) Forecast, by Application 2020 & 2033
- Table 31: Rest of Europe Industrial Gearbox Industry Revenue (Million) Forecast, by Application 2020 & 2033
- Table 32: Rest of Europe Industrial Gearbox Industry Volume (K Unit) Forecast, by Application 2020 & 2033
- Table 33: Global Industrial Gearbox Industry Revenue Million Forecast, by Type 2020 & 2033
- Table 34: Global Industrial Gearbox Industry Volume K Unit Forecast, by Type 2020 & 2033
- Table 35: Global Industrial Gearbox Industry Revenue Million Forecast, by Application 2020 & 2033
- Table 36: Global Industrial Gearbox Industry Volume K Unit Forecast, by Application 2020 & 2033
- Table 37: Global Industrial Gearbox Industry Revenue Million Forecast, by Country 2020 & 2033
- Table 38: Global Industrial Gearbox Industry Volume K Unit Forecast, by Country 2020 & 2033
- Table 39: China Industrial Gearbox Industry Revenue (Million) Forecast, by Application 2020 & 2033
- Table 40: China Industrial Gearbox Industry Volume (K Unit) Forecast, by Application 2020 & 2033
- Table 41: India Industrial Gearbox Industry Revenue (Million) Forecast, by Application 2020 & 2033
- Table 42: India Industrial Gearbox Industry Volume (K Unit) Forecast, by Application 2020 & 2033
- Table 43: Japan Industrial Gearbox Industry Revenue (Million) Forecast, by Application 2020 & 2033
- Table 44: Japan Industrial Gearbox Industry Volume (K Unit) Forecast, by Application 2020 & 2033
- Table 45: South Korea Industrial Gearbox Industry Revenue (Million) Forecast, by Application 2020 & 2033
- Table 46: South Korea Industrial Gearbox Industry Volume (K Unit) Forecast, by Application 2020 & 2033
- Table 47: Rest of Asia Pacific Industrial Gearbox Industry Revenue (Million) Forecast, by Application 2020 & 2033
- Table 48: Rest of Asia Pacific Industrial Gearbox Industry Volume (K Unit) Forecast, by Application 2020 & 2033
- Table 49: Global Industrial Gearbox Industry Revenue Million Forecast, by Type 2020 & 2033
- Table 50: Global Industrial Gearbox Industry Volume K Unit Forecast, by Type 2020 & 2033
- Table 51: Global Industrial Gearbox Industry Revenue Million Forecast, by Application 2020 & 2033
- Table 52: Global Industrial Gearbox Industry Volume K Unit Forecast, by Application 2020 & 2033
- Table 53: Global Industrial Gearbox Industry Revenue Million Forecast, by Country 2020 & 2033
- Table 54: Global Industrial Gearbox Industry Volume K Unit Forecast, by Country 2020 & 2033
- Table 55: Brazil Industrial Gearbox Industry Revenue (Million) Forecast, by Application 2020 & 2033
- Table 56: Brazil Industrial Gearbox Industry Volume (K Unit) Forecast, by Application 2020 & 2033
- Table 57: Argentina Industrial Gearbox Industry Revenue (Million) Forecast, by Application 2020 & 2033
- Table 58: Argentina Industrial Gearbox Industry Volume (K Unit) Forecast, by Application 2020 & 2033
- Table 59: Rest of South America Industrial Gearbox Industry Revenue (Million) Forecast, by Application 2020 & 2033
- Table 60: Rest of South America Industrial Gearbox Industry Volume (K Unit) Forecast, by Application 2020 & 2033
- Table 61: Global Industrial Gearbox Industry Revenue Million Forecast, by Type 2020 & 2033
- Table 62: Global Industrial Gearbox Industry Volume K Unit Forecast, by Type 2020 & 2033
- Table 63: Global Industrial Gearbox Industry Revenue Million Forecast, by Application 2020 & 2033
- Table 64: Global Industrial Gearbox Industry Volume K Unit Forecast, by Application 2020 & 2033
- Table 65: Global Industrial Gearbox Industry Revenue Million Forecast, by Country 2020 & 2033
- Table 66: Global Industrial Gearbox Industry Volume K Unit Forecast, by Country 2020 & 2033
- Table 67: Saudi Arabia Industrial Gearbox Industry Revenue (Million) Forecast, by Application 2020 & 2033
- Table 68: Saudi Arabia Industrial Gearbox Industry Volume (K Unit) Forecast, by Application 2020 & 2033
- Table 69: United Arab Emirates Industrial Gearbox Industry Revenue (Million) Forecast, by Application 2020 & 2033
- Table 70: United Arab Emirates Industrial Gearbox Industry Volume (K Unit) Forecast, by Application 2020 & 2033
- Table 71: South Africa Industrial Gearbox Industry Revenue (Million) Forecast, by Application 2020 & 2033
- Table 72: South Africa Industrial Gearbox Industry Volume (K Unit) Forecast, by Application 2020 & 2033
- Table 73: Rest of Middle East and Africa Industrial Gearbox Industry Revenue (Million) Forecast, by Application 2020 & 2033
- Table 74: Rest of Middle East and Africa Industrial Gearbox Industry Volume (K Unit) Forecast, by Application 2020 & 2033
Frequently Asked Questions
1. What is the projected Compound Annual Growth Rate (CAGR) of the Industrial Gearbox Industry?
The projected CAGR is approximately 4.20%.
2. Which companies are prominent players in the Industrial Gearbox Industry?
Key companies in the market include Flender Ltd, Sew-Eurodrive GmbH & Co KG, Bosch Rexroth AG, INGECO GEARS Pvt Ltd, Essential Power Transmission Pvt Ltd, Getriebebau NORD GmbH & Co KG, Nanjing High Accurate Drive Equipment Manufacturing Group Co Ltd, Zollern GmbH & Co KG, Lenze SE, Kngear, Elecon Engineering Company Limited, Bonfiglioli Drives Co Ltd.
3. What are the main segments of the Industrial Gearbox Industry?
The market segments include Type, Application.
4. Can you provide details about the market size?
The market size is estimated to be USD 28.33 Million as of 2022.
5. What are some drivers contributing to market growth?
4.; Growing Adoption of Industrial Automation across Various Industrial Sectors4.; Rising Sales for Automobiles across the World.
6. What are the notable trends driving market growth?
Helical Gearbox Type Segment to Dominate the Market.
7. Are there any restraints impacting market growth?
4.; Slow Down in Economic and Industrial Activities.
8. Can you provide examples of recent developments in the market?
May 2023: Triumph Group, Inc. announced that it had been awarded a long-term agreement from General Electric (GE) through its Geared Solutions business for LEAP-1A, LEAP-1B, and LEAP-1C programs. TRIUMPH has collaborated with GE on LEAP and CFM56 IGBs for over 35 years, shipping over 25,000 gearboxes till now. TRIUMPH will supply thousands of IGBs annually to GE into the next decade with this contract extension.
9. What pricing options are available for accessing the report?
Pricing options include single-user, multi-user, and enterprise licenses priced at USD 4750, USD 5250, and USD 8750 respectively.
10. Is the market size provided in terms of value or volume?
The market size is provided in terms of value, measured in Million and volume, measured in K Unit.
11. Are there any specific market keywords associated with the report?
Yes, the market keyword associated with the report is "Industrial Gearbox Industry," which aids in identifying and referencing the specific market segment covered.
12. How do I determine which pricing option suits my needs best?
The pricing options vary based on user requirements and access needs. Individual users may opt for single-user licenses, while businesses requiring broader access may choose multi-user or enterprise licenses for cost-effective access to the report.
13. Are there any additional resources or data provided in the Industrial Gearbox Industry report?
While the report offers comprehensive insights, it's advisable to review the specific contents or supplementary materials provided to ascertain if additional resources or data are available.
14. How can I stay updated on further developments or reports in the Industrial Gearbox Industry?
To stay informed about further developments, trends, and reports in the Industrial Gearbox Industry, consider subscribing to industry newsletters, following relevant companies and organizations, or regularly checking reputable industry news sources and publications.
Methodology
Step 1 - Identification of Relevant Samples Size from Population Database


Step 2 - Approaches for Defining Global Market Size (Value, Volume* & Price*)

Note*: In applicable scenarios
Step 3 - Data Sources
Primary Research
- Web Analytics
- Survey Reports
- Research Institute
- Latest Research Reports
- Opinion Leaders
Secondary Research
- Annual Reports
- White Paper
- Latest Press Release
- Industry Association
- Paid Database
- Investor Presentations

Step 4 - Data Triangulation
Involves using different sources of information in order to increase the validity of a study
These sources are likely to be stakeholders in a program - participants, other researchers, program staff, other community members, and so on.
Then we put all data in single framework & apply various statistical tools to find out the dynamic on the market.
During the analysis stage, feedback from the stakeholder groups would be compared to determine areas of agreement as well as areas of divergence