

Key Insights
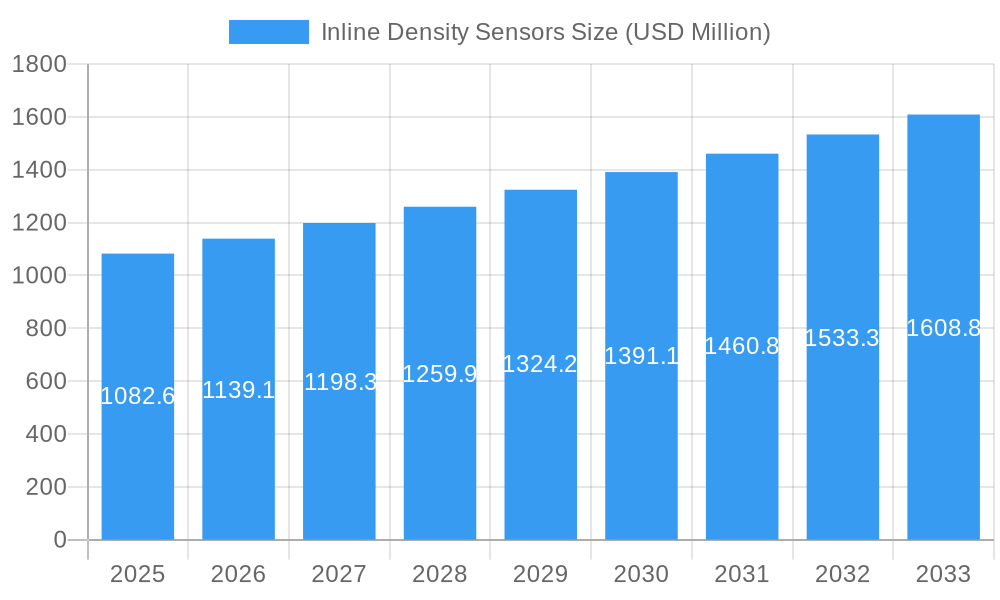
The global Inline Density Sensors market is poised for significant expansion, projected to reach an estimated $1,082.6 million in 2025. This growth is underpinned by a robust Compound Annual Growth Rate (CAGR) of 5.3% anticipated over the forecast period of 2025-2033. The increasing demand for precise process control and real-time monitoring across various industries, particularly in manufacturing, oil and gas, and chemical processing, is a primary catalyst for this upward trajectory. Inline density sensors are critical for optimizing product quality, ensuring efficient material handling, and maintaining safety standards by providing immediate data on fluid composition and concentration. The market benefits from advancements in sensor technology, leading to more accurate, reliable, and durable devices capable of operating in harsh industrial environments. Furthermore, stricter regulatory requirements for quality assurance and environmental compliance are driving the adoption of these sophisticated monitoring solutions.
Inline Density Sensors Market Size (In Billion)
The market segmentation reveals a dynamic landscape with distinct growth drivers. The Industrial application segment is expected to lead, fueled by extensive use in sectors like petrochemicals, food and beverage, and pharmaceuticals. Within types, both Contact Type and Non-contact Type sensors are experiencing demand, with advancements in non-contact technologies offering greater versatility and reduced maintenance. Key players such as Emerson Electric, Anton Paar, and BERTHOLD TECHNOLOGIES are investing heavily in research and development to introduce innovative solutions and expand their market reach. Geographically, Asia Pacific is anticipated to emerge as a key growth region, driven by rapid industrialization in countries like China and India, coupled with increasing investments in manufacturing infrastructure. However, established markets like North America and Europe will continue to be significant contributors, benefiting from their advanced technological adoption and mature industrial base. Challenges such as the initial high cost of advanced sensor systems and the need for skilled personnel for installation and maintenance are present, but are likely to be mitigated by technological innovations and growing market maturity.
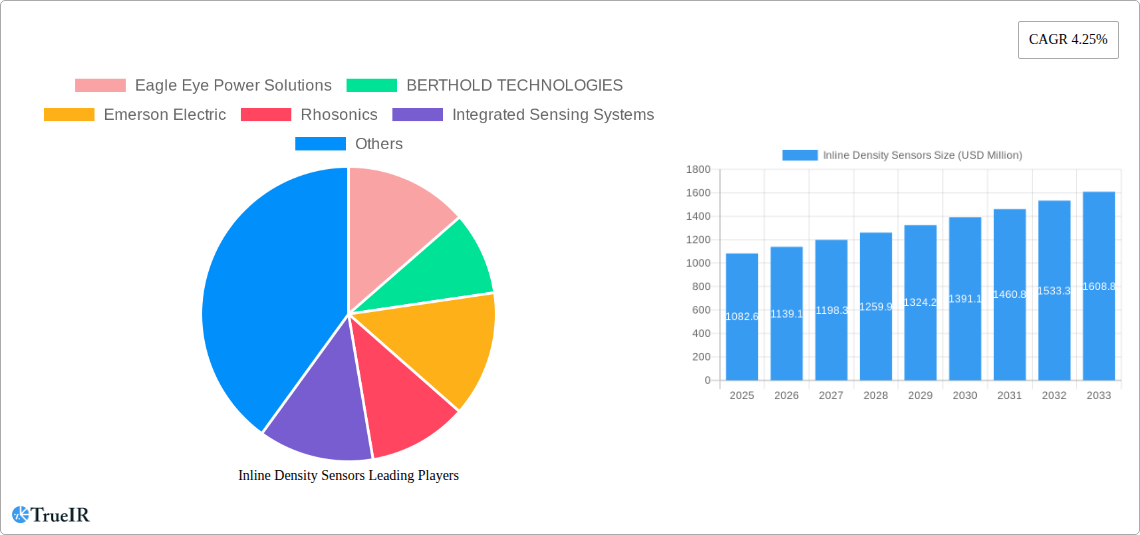
Inline Density Sensors Company Market Share
Inline Density Sensors Market: Comprehensive Growth Analysis and Future Projections (2019-2033)
This comprehensive report delves into the dynamic Inline Density Sensors market, providing a detailed analysis of its structure, trends, and future outlook. Leveraging a study period from 2019 to 2033, with a base year of 2025 and a forecast period extending to 2033, this report offers invaluable insights for industry stakeholders. We analyze market dynamics, technological advancements, and competitive landscapes, equipping you with the knowledge to navigate this evolving sector. The report highlights key players, significant industry milestones, and future growth catalysts.
Inline Density Sensors Market Structure & Competitive Landscape
The global Inline Density Sensors market exhibits a moderately fragmented structure, with a few dominant players alongside a significant number of specialized manufacturers. Innovation serves as a primary driver, with companies continuously investing in research and development to enhance sensor accuracy, reliability, and connectivity. For instance, advancements in digital signal processing and wireless communication are enabling more sophisticated data acquisition and remote monitoring capabilities. Regulatory impacts are largely driven by industry-specific standards for quality control and process safety, particularly in food & beverage, chemical, and pharmaceutical sectors, demanding stringent accuracy and calibration protocols. Product substitutes, such as laboratory-based density measurements or indirect inferential methods, exist but often fall short in providing real-time, continuous inline monitoring essential for process optimization. The end-user segmentation reveals a strong reliance on the industrial sector, driven by its critical need for precise process control. Commercial applications are also emerging, particularly in utility management and environmental monitoring. Mergers and acquisitions (M&A) trends are notable, with larger corporations acquiring smaller, innovative firms to expand their product portfolios and market reach. We anticipate at least 5 major M&A activities annually over the forecast period. The concentration ratio amongst the top five players is estimated to be around 55% in 2025, indicating a competitive yet consolidative market.
Inline Density Sensors Market Trends & Opportunities
The Inline Density Sensors market is projected for robust growth, with an estimated market size reaching over 1,200 million in 2025 and expanding to over 2,500 million by 2033, exhibiting a Compound Annual Growth Rate (CAGR) of approximately 9.5% during the forecast period. Technological shifts are at the forefront of this expansion, with a pronounced trend towards the adoption of non-contact type sensors, such as ultrasonic and microwave-based technologies. These offer advantages in terms of reduced maintenance, prevention of process contamination, and the ability to measure in abrasive or corrosive environments. Contact type sensors, however, continue to hold a significant share due to their established reliability and cost-effectiveness in less demanding applications. Consumer preferences are increasingly leaning towards intelligent sensors equipped with IoT capabilities, enabling seamless integration with SCADA systems and cloud-based analytics platforms. This facilitates predictive maintenance, real-time process optimization, and enhanced operational efficiency. Competitive dynamics are characterized by intense price competition, particularly in mature segments, alongside a strong emphasis on product differentiation through features like higher accuracy, wider operating temperature ranges, and advanced diagnostic capabilities. Market penetration rates are steadily increasing across various industrial verticals as businesses recognize the tangible benefits of inline density measurement for quality assurance and cost reduction. The growing demand for precise formulation control in industries like pharmaceuticals and food & beverage, coupled with the need for efficient resource management in oil & gas and chemical processing, are significant market drivers. Furthermore, the increasing focus on environmental compliance and product traceability is spurring the adoption of advanced inline measurement technologies. The market penetration for inline density sensors in industrial applications is estimated to be over 60% in 2025 and is expected to grow to over 75% by 2033.
Dominant Markets & Segments in Inline Density Sensors
The Industrial application segment stands as the dominant force in the global Inline Density Sensors market, driven by its indispensable role in critical manufacturing and processing operations. Within this segment, the Oil & Gas and Chemical industries are key contributors, demanding high-precision density measurements for product quality control, custody transfer, and process optimization. For instance, the accurate measurement of crude oil density is crucial for revenue calculation and blending operations. The Food & Beverage sector also represents a substantial and growing application, where inline density sensors are vital for ensuring consistent product quality, controlling fermentation processes, and optimizing ingredient mixing. The Pharmaceutical industry relies heavily on these sensors for precise formulation and quality assurance, adhering to strict regulatory standards.
Geographically, North America and Europe currently lead the market, owing to their established industrial infrastructure, stringent quality regulations, and early adoption of advanced technologies. However, the Asia Pacific region is emerging as a high-growth market, fueled by rapid industrialization, expanding manufacturing capabilities, and increasing investments in infrastructure projects across countries like China, India, and Southeast Asian nations.
Regarding sensor types, Contact Type sensors, such as vibrating tube and Coriolis flow meters, continue to hold a significant market share due to their proven reliability and cost-effectiveness in many established applications. However, the Non-contact Type sensors, particularly ultrasonic and microwave technologies, are witnessing accelerated growth. This is driven by their advantages in handling corrosive, abrasive, or high-temperature media, and their suitability for applications where process contamination is a critical concern. The development of advanced materials and manufacturing techniques is further enhancing the performance and reducing the cost of non-contact sensors, making them more accessible.
Key growth drivers for the dominant industrial segment include:
- Increasing demand for real-time process control: Essential for optimizing yield, minimizing waste, and ensuring product consistency.
- Stringent quality and safety regulations: Driving the need for accurate and reliable inline measurement solutions.
- Technological advancements: Leading to more accurate, robust, and feature-rich sensor technologies.
- Growth in emerging economies: Fueling industrial expansion and the adoption of modern process control technologies.
Inline Density Sensors Product Analysis
Product innovations in Inline Density Sensors are primarily focused on enhancing accuracy, expanding measurement capabilities, and improving user-friendliness. Advancements in digital signal processing and algorithm development are leading to sensors with higher precision, even in challenging process conditions. The integration of non-contact technologies, such as ultrasonic and microwave, offers significant competitive advantages by enabling measurements in corrosive, abrasive, or high-temperature fluids without direct contact, thereby minimizing maintenance and preventing contamination. Furthermore, the increasing adoption of IoT connectivity and smart sensor capabilities allows for seamless data integration with plant-wide control systems, enabling remote monitoring, predictive analytics, and optimized process control.
Key Drivers, Barriers & Challenges in Inline Density Sensors
Key Drivers: The Inline Density Sensors market is propelled by the relentless pursuit of process efficiency and quality control across diverse industries. Technological advancements, particularly in non-contact sensing technologies like ultrasonic and microwave, are expanding application possibilities and improving performance. Stringent regulatory mandates in sectors like pharmaceuticals and food & beverage, demanding precise product specifications and traceability, further fuel demand. Economic factors, including the drive for cost reduction through waste minimization and optimized resource utilization, also play a crucial role. Government initiatives promoting industrial automation and smart manufacturing further support market growth.
Barriers & Challenges: Despite robust growth, the market faces certain barriers. The high initial investment cost for some advanced inline density sensor systems can be a restraint, especially for small and medium-sized enterprises. Supply chain disruptions, as witnessed in recent years, can impact component availability and lead times. Intense competitive pressures, leading to price erosion in certain segments, can affect profit margins for manufacturers. Navigating complex and varying industry-specific calibration and certification requirements across different regions also presents a challenge. The need for skilled personnel to install, operate, and maintain these sophisticated systems can also be a limiting factor in some developing regions.
Growth Drivers in the Inline Density Sensors Market
The Inline Density Sensors market is experiencing significant growth, driven by several key factors. Technologically, the development and refinement of non-contact sensing methods, such as ultrasonic and microwave technologies, are expanding their applicability and offering enhanced performance in challenging environments. Economically, industries are increasingly focused on optimizing operational efficiency, reducing waste, and improving product yield, making accurate inline density measurements essential for achieving these goals. Regulatory frameworks in sectors like food & beverage and pharmaceuticals, which demand stringent quality control and traceability, are further boosting the adoption of these sensors. The burgeoning industrialization in emerging economies, particularly in Asia Pacific, presents a vast untapped market for these advanced measurement solutions.
Challenges Impacting Inline Density Sensors Growth
Despite a positive growth trajectory, the Inline Density Sensors market encounters several challenges. The upfront capital expenditure associated with acquiring and installing advanced inline density sensing systems can be a deterrent for some businesses, especially smaller enterprises. Fluctuations and potential disruptions within the global supply chain for critical components can lead to extended lead times and increased costs. Intense competition among manufacturers, particularly for established product types, can result in price pressures and impact profitability. Moreover, the diverse and sometimes stringent calibration and certification requirements across different industries and geographical regions necessitate significant compliance efforts from sensor providers.
Key Players Shaping the Inline Density Sensors Market
- Eagle Eye Power Solutions
- BERTHOLD TECHNOLOGIES
- Emerson Electric
- Rhosonics
- Integrated Sensing Systems
- Anton Paar
- LEMIS Process
- RITTER
- VAF Instruments
Significant Inline Density Sensors Industry Milestones
- 2019: Introduction of advanced digital signal processing for enhanced accuracy in ultrasonic density sensors.
- 2020: Major players focus on integrating IoT capabilities and cloud connectivity into inline density sensor product lines.
- 2021: Increased R&D investment in microwave-based density sensing technologies for challenging applications.
- 2022: Emergence of modular and customizable inline density sensor solutions catering to specific industrial needs.
- 2023: Growing emphasis on predictive maintenance features integrated within inline density sensor systems.
- 2024: Further development and adoption of non-contact sensors for stringent hygienic applications in food and pharmaceutical industries.
- 2025 (Estimated): Continued advancements in miniaturization and power efficiency for inline density sensors.
- 2026-2033 (Projected): Wider integration of AI and machine learning for advanced data analytics and process optimization based on inline density data.
Future Outlook for Inline Density Sensors Market
The future outlook for the Inline Density Sensors market is exceptionally promising, driven by the persistent demand for precise process control and efficiency gains across a multitude of industries. Strategic opportunities lie in the continued development and broader adoption of non-contact sensing technologies, which offer significant advantages in terms of reliability and maintenance. The integration of advanced analytics, leveraging IoT connectivity and AI, will transform these sensors from mere measurement devices into intelligent components of smart manufacturing ecosystems. Emerging economies present substantial growth potential as industrialization accelerates. Furthermore, increasing regulatory scrutiny on product quality and environmental impact will continue to fuel the need for accurate and reliable inline density measurement solutions, solidifying the market's robust growth trajectory for the foreseeable future.
Inline Density Sensors Segmentation
-
1. Application
- 1.1. Industrial
- 1.2. Commercial
-
2. Types
- 2.1. Contact Type
- 2.2. Non-contact Type
Inline Density Sensors Segmentation By Geography
-
1. North America
- 1.1. United States
- 1.2. Canada
- 1.3. Mexico
-
2. South America
- 2.1. Brazil
- 2.2. Argentina
- 2.3. Rest of South America
-
3. Europe
- 3.1. United Kingdom
- 3.2. Germany
- 3.3. France
- 3.4. Italy
- 3.5. Spain
- 3.6. Russia
- 3.7. Benelux
- 3.8. Nordics
- 3.9. Rest of Europe
-
4. Middle East & Africa
- 4.1. Turkey
- 4.2. Israel
- 4.3. GCC
- 4.4. North Africa
- 4.5. South Africa
- 4.6. Rest of Middle East & Africa
-
5. Asia Pacific
- 5.1. China
- 5.2. India
- 5.3. Japan
- 5.4. South Korea
- 5.5. ASEAN
- 5.6. Oceania
- 5.7. Rest of Asia Pacific
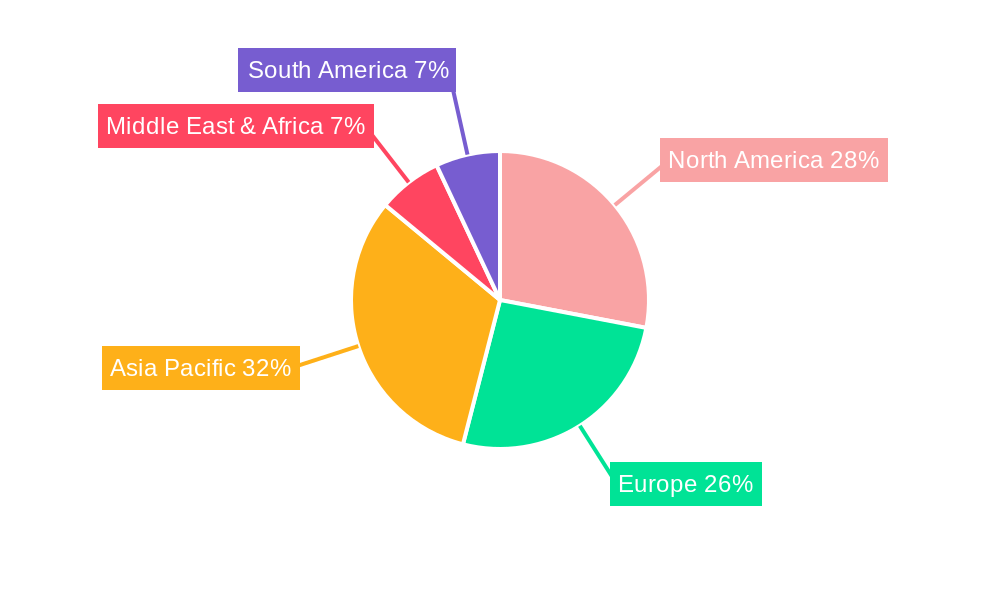
Inline Density Sensors Regional Market Share
Geographic Coverage of Inline Density Sensors
Inline Density Sensors REPORT HIGHLIGHTS
| Aspects | Details |
|---|---|
| Study Period | 2020-2034 |
| Base Year | 2025 |
| Estimated Year | 2026 |
| Forecast Period | 2026-2034 |
| Historical Period | 2020-2025 |
| Growth Rate | CAGR of 5.3% from 2020-2034 |
| Segmentation |
|
Table of Contents
- 1. Introduction
- 1.1. Research Scope
- 1.2. Market Segmentation
- 1.3. Research Objective
- 1.4. Definitions and Assumptions
- 2. Executive Summary
- 2.1. Market Snapshot
- 3. Market Dynamics
- 3.1. Market Drivers
- 3.2. Market Restrains
- 3.3. Market Trends
- 3.4. Market Opportunities
- 4. Market Factor Analysis
- 4.1. Porters Five Forces
- 4.1.1. Bargaining Power of Suppliers
- 4.1.2. Bargaining Power of Buyers
- 4.1.3. Threat of New Entrants
- 4.1.4. Threat of Substitutes
- 4.1.5. Competitive Rivalry
- 4.2. PESTEL analysis
- 4.3. BCG Analysis
- 4.3.1. Stars (High Growth, High Market Share)
- 4.3.2. Cash Cows (Low Growth, High Market Share)
- 4.3.3. Question Mark (High Growth, Low Market Share)
- 4.3.4. Dogs (Low Growth, Low Market Share)
- 4.4. Ansoff Matrix Analysis
- 4.5. Supply Chain Analysis
- 4.6. Regulatory Landscape
- 4.7. Current Market Potential and Opportunity Assessment (TAM–SAM–SOM Framework)
- 4.8. TIR Analyst Note
- 4.1. Porters Five Forces
- 5. Market Analysis, Insights and Forecast 2021-2033
- 5.1. Market Analysis, Insights and Forecast - by Application
- 5.1.1. Industrial
- 5.1.2. Commercial
- 5.2. Market Analysis, Insights and Forecast - by Types
- 5.2.1. Contact Type
- 5.2.2. Non-contact Type
- 5.3. Market Analysis, Insights and Forecast - by Region
- 5.3.1. North America
- 5.3.2. South America
- 5.3.3. Europe
- 5.3.4. Middle East & Africa
- 5.3.5. Asia Pacific
- 5.1. Market Analysis, Insights and Forecast - by Application
- 6. Global Inline Density Sensors Analysis, Insights and Forecast, 2021-2033
- 6.1. Market Analysis, Insights and Forecast - by Application
- 6.1.1. Industrial
- 6.1.2. Commercial
- 6.2. Market Analysis, Insights and Forecast - by Types
- 6.2.1. Contact Type
- 6.2.2. Non-contact Type
- 6.1. Market Analysis, Insights and Forecast - by Application
- 7. North America Inline Density Sensors Analysis, Insights and Forecast, 2020-2032
- 7.1. Market Analysis, Insights and Forecast - by Application
- 7.1.1. Industrial
- 7.1.2. Commercial
- 7.2. Market Analysis, Insights and Forecast - by Types
- 7.2.1. Contact Type
- 7.2.2. Non-contact Type
- 7.1. Market Analysis, Insights and Forecast - by Application
- 8. South America Inline Density Sensors Analysis, Insights and Forecast, 2020-2032
- 8.1. Market Analysis, Insights and Forecast - by Application
- 8.1.1. Industrial
- 8.1.2. Commercial
- 8.2. Market Analysis, Insights and Forecast - by Types
- 8.2.1. Contact Type
- 8.2.2. Non-contact Type
- 8.1. Market Analysis, Insights and Forecast - by Application
- 9. Europe Inline Density Sensors Analysis, Insights and Forecast, 2020-2032
- 9.1. Market Analysis, Insights and Forecast - by Application
- 9.1.1. Industrial
- 9.1.2. Commercial
- 9.2. Market Analysis, Insights and Forecast - by Types
- 9.2.1. Contact Type
- 9.2.2. Non-contact Type
- 9.1. Market Analysis, Insights and Forecast - by Application
- 10. Middle East & Africa Inline Density Sensors Analysis, Insights and Forecast, 2020-2032
- 10.1. Market Analysis, Insights and Forecast - by Application
- 10.1.1. Industrial
- 10.1.2. Commercial
- 10.2. Market Analysis, Insights and Forecast - by Types
- 10.2.1. Contact Type
- 10.2.2. Non-contact Type
- 10.1. Market Analysis, Insights and Forecast - by Application
- 11. Asia Pacific Inline Density Sensors Analysis, Insights and Forecast, 2020-2032
- 11.1. Market Analysis, Insights and Forecast - by Application
- 11.1.1. Industrial
- 11.1.2. Commercial
- 11.2. Market Analysis, Insights and Forecast - by Types
- 11.2.1. Contact Type
- 11.2.2. Non-contact Type
- 11.1. Market Analysis, Insights and Forecast - by Application
- 12. Competitive Analysis
- 12.1. Company Profiles
- 12.1.1 Eagle Eye Power Solutions
- 12.1.1.1. Company Overview
- 12.1.1.2. Products
- 12.1.1.3. Company Financials
- 12.1.1.4. SWOT Analysis
- 12.1.2 BERTHOLD TECHNOLOGIES
- 12.1.2.1. Company Overview
- 12.1.2.2. Products
- 12.1.2.3. Company Financials
- 12.1.2.4. SWOT Analysis
- 12.1.3 Emerson Electric
- 12.1.3.1. Company Overview
- 12.1.3.2. Products
- 12.1.3.3. Company Financials
- 12.1.3.4. SWOT Analysis
- 12.1.4 Rhosonics
- 12.1.4.1. Company Overview
- 12.1.4.2. Products
- 12.1.4.3. Company Financials
- 12.1.4.4. SWOT Analysis
- 12.1.5 Integrated Sensing Systems
- 12.1.5.1. Company Overview
- 12.1.5.2. Products
- 12.1.5.3. Company Financials
- 12.1.5.4. SWOT Analysis
- 12.1.6 Anton Paar
- 12.1.6.1. Company Overview
- 12.1.6.2. Products
- 12.1.6.3. Company Financials
- 12.1.6.4. SWOT Analysis
- 12.1.7 Integrated Sensing Systems
- 12.1.7.1. Company Overview
- 12.1.7.2. Products
- 12.1.7.3. Company Financials
- 12.1.7.4. SWOT Analysis
- 12.1.8 LEMIS Process
- 12.1.8.1. Company Overview
- 12.1.8.2. Products
- 12.1.8.3. Company Financials
- 12.1.8.4. SWOT Analysis
- 12.1.9 RITTER
- 12.1.9.1. Company Overview
- 12.1.9.2. Products
- 12.1.9.3. Company Financials
- 12.1.9.4. SWOT Analysis
- 12.1.10 VAF Instruments
- 12.1.10.1. Company Overview
- 12.1.10.2. Products
- 12.1.10.3. Company Financials
- 12.1.10.4. SWOT Analysis
- 12.1.1 Eagle Eye Power Solutions
- 12.2. Market Entropy
- 12.2.1 Company's Key Areas Served
- 12.2.2 Recent Developments
- 12.3. Company Market Share Analysis 2025
- 12.3.1 Top 5 Companies Market Share Analysis
- 12.3.2 Top 3 Companies Market Share Analysis
- 12.4. List of Potential Customers
- 13. Research Methodology
List of Figures
- Figure 1: Global Inline Density Sensors Revenue Breakdown (undefined, %) by Region 2025 & 2033
- Figure 2: Global Inline Density Sensors Volume Breakdown (K, %) by Region 2025 & 2033
- Figure 3: North America Inline Density Sensors Revenue (undefined), by Application 2025 & 2033
- Figure 4: North America Inline Density Sensors Volume (K), by Application 2025 & 2033
- Figure 5: North America Inline Density Sensors Revenue Share (%), by Application 2025 & 2033
- Figure 6: North America Inline Density Sensors Volume Share (%), by Application 2025 & 2033
- Figure 7: North America Inline Density Sensors Revenue (undefined), by Types 2025 & 2033
- Figure 8: North America Inline Density Sensors Volume (K), by Types 2025 & 2033
- Figure 9: North America Inline Density Sensors Revenue Share (%), by Types 2025 & 2033
- Figure 10: North America Inline Density Sensors Volume Share (%), by Types 2025 & 2033
- Figure 11: North America Inline Density Sensors Revenue (undefined), by Country 2025 & 2033
- Figure 12: North America Inline Density Sensors Volume (K), by Country 2025 & 2033
- Figure 13: North America Inline Density Sensors Revenue Share (%), by Country 2025 & 2033
- Figure 14: North America Inline Density Sensors Volume Share (%), by Country 2025 & 2033
- Figure 15: South America Inline Density Sensors Revenue (undefined), by Application 2025 & 2033
- Figure 16: South America Inline Density Sensors Volume (K), by Application 2025 & 2033
- Figure 17: South America Inline Density Sensors Revenue Share (%), by Application 2025 & 2033
- Figure 18: South America Inline Density Sensors Volume Share (%), by Application 2025 & 2033
- Figure 19: South America Inline Density Sensors Revenue (undefined), by Types 2025 & 2033
- Figure 20: South America Inline Density Sensors Volume (K), by Types 2025 & 2033
- Figure 21: South America Inline Density Sensors Revenue Share (%), by Types 2025 & 2033
- Figure 22: South America Inline Density Sensors Volume Share (%), by Types 2025 & 2033
- Figure 23: South America Inline Density Sensors Revenue (undefined), by Country 2025 & 2033
- Figure 24: South America Inline Density Sensors Volume (K), by Country 2025 & 2033
- Figure 25: South America Inline Density Sensors Revenue Share (%), by Country 2025 & 2033
- Figure 26: South America Inline Density Sensors Volume Share (%), by Country 2025 & 2033
- Figure 27: Europe Inline Density Sensors Revenue (undefined), by Application 2025 & 2033
- Figure 28: Europe Inline Density Sensors Volume (K), by Application 2025 & 2033
- Figure 29: Europe Inline Density Sensors Revenue Share (%), by Application 2025 & 2033
- Figure 30: Europe Inline Density Sensors Volume Share (%), by Application 2025 & 2033
- Figure 31: Europe Inline Density Sensors Revenue (undefined), by Types 2025 & 2033
- Figure 32: Europe Inline Density Sensors Volume (K), by Types 2025 & 2033
- Figure 33: Europe Inline Density Sensors Revenue Share (%), by Types 2025 & 2033
- Figure 34: Europe Inline Density Sensors Volume Share (%), by Types 2025 & 2033
- Figure 35: Europe Inline Density Sensors Revenue (undefined), by Country 2025 & 2033
- Figure 36: Europe Inline Density Sensors Volume (K), by Country 2025 & 2033
- Figure 37: Europe Inline Density Sensors Revenue Share (%), by Country 2025 & 2033
- Figure 38: Europe Inline Density Sensors Volume Share (%), by Country 2025 & 2033
- Figure 39: Middle East & Africa Inline Density Sensors Revenue (undefined), by Application 2025 & 2033
- Figure 40: Middle East & Africa Inline Density Sensors Volume (K), by Application 2025 & 2033
- Figure 41: Middle East & Africa Inline Density Sensors Revenue Share (%), by Application 2025 & 2033
- Figure 42: Middle East & Africa Inline Density Sensors Volume Share (%), by Application 2025 & 2033
- Figure 43: Middle East & Africa Inline Density Sensors Revenue (undefined), by Types 2025 & 2033
- Figure 44: Middle East & Africa Inline Density Sensors Volume (K), by Types 2025 & 2033
- Figure 45: Middle East & Africa Inline Density Sensors Revenue Share (%), by Types 2025 & 2033
- Figure 46: Middle East & Africa Inline Density Sensors Volume Share (%), by Types 2025 & 2033
- Figure 47: Middle East & Africa Inline Density Sensors Revenue (undefined), by Country 2025 & 2033
- Figure 48: Middle East & Africa Inline Density Sensors Volume (K), by Country 2025 & 2033
- Figure 49: Middle East & Africa Inline Density Sensors Revenue Share (%), by Country 2025 & 2033
- Figure 50: Middle East & Africa Inline Density Sensors Volume Share (%), by Country 2025 & 2033
- Figure 51: Asia Pacific Inline Density Sensors Revenue (undefined), by Application 2025 & 2033
- Figure 52: Asia Pacific Inline Density Sensors Volume (K), by Application 2025 & 2033
- Figure 53: Asia Pacific Inline Density Sensors Revenue Share (%), by Application 2025 & 2033
- Figure 54: Asia Pacific Inline Density Sensors Volume Share (%), by Application 2025 & 2033
- Figure 55: Asia Pacific Inline Density Sensors Revenue (undefined), by Types 2025 & 2033
- Figure 56: Asia Pacific Inline Density Sensors Volume (K), by Types 2025 & 2033
- Figure 57: Asia Pacific Inline Density Sensors Revenue Share (%), by Types 2025 & 2033
- Figure 58: Asia Pacific Inline Density Sensors Volume Share (%), by Types 2025 & 2033
- Figure 59: Asia Pacific Inline Density Sensors Revenue (undefined), by Country 2025 & 2033
- Figure 60: Asia Pacific Inline Density Sensors Volume (K), by Country 2025 & 2033
- Figure 61: Asia Pacific Inline Density Sensors Revenue Share (%), by Country 2025 & 2033
- Figure 62: Asia Pacific Inline Density Sensors Volume Share (%), by Country 2025 & 2033
List of Tables
- Table 1: Global Inline Density Sensors Revenue undefined Forecast, by Application 2020 & 2033
- Table 2: Global Inline Density Sensors Volume K Forecast, by Application 2020 & 2033
- Table 3: Global Inline Density Sensors Revenue undefined Forecast, by Types 2020 & 2033
- Table 4: Global Inline Density Sensors Volume K Forecast, by Types 2020 & 2033
- Table 5: Global Inline Density Sensors Revenue undefined Forecast, by Region 2020 & 2033
- Table 6: Global Inline Density Sensors Volume K Forecast, by Region 2020 & 2033
- Table 7: Global Inline Density Sensors Revenue undefined Forecast, by Application 2020 & 2033
- Table 8: Global Inline Density Sensors Volume K Forecast, by Application 2020 & 2033
- Table 9: Global Inline Density Sensors Revenue undefined Forecast, by Types 2020 & 2033
- Table 10: Global Inline Density Sensors Volume K Forecast, by Types 2020 & 2033
- Table 11: Global Inline Density Sensors Revenue undefined Forecast, by Country 2020 & 2033
- Table 12: Global Inline Density Sensors Volume K Forecast, by Country 2020 & 2033
- Table 13: United States Inline Density Sensors Revenue (undefined) Forecast, by Application 2020 & 2033
- Table 14: United States Inline Density Sensors Volume (K) Forecast, by Application 2020 & 2033
- Table 15: Canada Inline Density Sensors Revenue (undefined) Forecast, by Application 2020 & 2033
- Table 16: Canada Inline Density Sensors Volume (K) Forecast, by Application 2020 & 2033
- Table 17: Mexico Inline Density Sensors Revenue (undefined) Forecast, by Application 2020 & 2033
- Table 18: Mexico Inline Density Sensors Volume (K) Forecast, by Application 2020 & 2033
- Table 19: Global Inline Density Sensors Revenue undefined Forecast, by Application 2020 & 2033
- Table 20: Global Inline Density Sensors Volume K Forecast, by Application 2020 & 2033
- Table 21: Global Inline Density Sensors Revenue undefined Forecast, by Types 2020 & 2033
- Table 22: Global Inline Density Sensors Volume K Forecast, by Types 2020 & 2033
- Table 23: Global Inline Density Sensors Revenue undefined Forecast, by Country 2020 & 2033
- Table 24: Global Inline Density Sensors Volume K Forecast, by Country 2020 & 2033
- Table 25: Brazil Inline Density Sensors Revenue (undefined) Forecast, by Application 2020 & 2033
- Table 26: Brazil Inline Density Sensors Volume (K) Forecast, by Application 2020 & 2033
- Table 27: Argentina Inline Density Sensors Revenue (undefined) Forecast, by Application 2020 & 2033
- Table 28: Argentina Inline Density Sensors Volume (K) Forecast, by Application 2020 & 2033
- Table 29: Rest of South America Inline Density Sensors Revenue (undefined) Forecast, by Application 2020 & 2033
- Table 30: Rest of South America Inline Density Sensors Volume (K) Forecast, by Application 2020 & 2033
- Table 31: Global Inline Density Sensors Revenue undefined Forecast, by Application 2020 & 2033
- Table 32: Global Inline Density Sensors Volume K Forecast, by Application 2020 & 2033
- Table 33: Global Inline Density Sensors Revenue undefined Forecast, by Types 2020 & 2033
- Table 34: Global Inline Density Sensors Volume K Forecast, by Types 2020 & 2033
- Table 35: Global Inline Density Sensors Revenue undefined Forecast, by Country 2020 & 2033
- Table 36: Global Inline Density Sensors Volume K Forecast, by Country 2020 & 2033
- Table 37: United Kingdom Inline Density Sensors Revenue (undefined) Forecast, by Application 2020 & 2033
- Table 38: United Kingdom Inline Density Sensors Volume (K) Forecast, by Application 2020 & 2033
- Table 39: Germany Inline Density Sensors Revenue (undefined) Forecast, by Application 2020 & 2033
- Table 40: Germany Inline Density Sensors Volume (K) Forecast, by Application 2020 & 2033
- Table 41: France Inline Density Sensors Revenue (undefined) Forecast, by Application 2020 & 2033
- Table 42: France Inline Density Sensors Volume (K) Forecast, by Application 2020 & 2033
- Table 43: Italy Inline Density Sensors Revenue (undefined) Forecast, by Application 2020 & 2033
- Table 44: Italy Inline Density Sensors Volume (K) Forecast, by Application 2020 & 2033
- Table 45: Spain Inline Density Sensors Revenue (undefined) Forecast, by Application 2020 & 2033
- Table 46: Spain Inline Density Sensors Volume (K) Forecast, by Application 2020 & 2033
- Table 47: Russia Inline Density Sensors Revenue (undefined) Forecast, by Application 2020 & 2033
- Table 48: Russia Inline Density Sensors Volume (K) Forecast, by Application 2020 & 2033
- Table 49: Benelux Inline Density Sensors Revenue (undefined) Forecast, by Application 2020 & 2033
- Table 50: Benelux Inline Density Sensors Volume (K) Forecast, by Application 2020 & 2033
- Table 51: Nordics Inline Density Sensors Revenue (undefined) Forecast, by Application 2020 & 2033
- Table 52: Nordics Inline Density Sensors Volume (K) Forecast, by Application 2020 & 2033
- Table 53: Rest of Europe Inline Density Sensors Revenue (undefined) Forecast, by Application 2020 & 2033
- Table 54: Rest of Europe Inline Density Sensors Volume (K) Forecast, by Application 2020 & 2033
- Table 55: Global Inline Density Sensors Revenue undefined Forecast, by Application 2020 & 2033
- Table 56: Global Inline Density Sensors Volume K Forecast, by Application 2020 & 2033
- Table 57: Global Inline Density Sensors Revenue undefined Forecast, by Types 2020 & 2033
- Table 58: Global Inline Density Sensors Volume K Forecast, by Types 2020 & 2033
- Table 59: Global Inline Density Sensors Revenue undefined Forecast, by Country 2020 & 2033
- Table 60: Global Inline Density Sensors Volume K Forecast, by Country 2020 & 2033
- Table 61: Turkey Inline Density Sensors Revenue (undefined) Forecast, by Application 2020 & 2033
- Table 62: Turkey Inline Density Sensors Volume (K) Forecast, by Application 2020 & 2033
- Table 63: Israel Inline Density Sensors Revenue (undefined) Forecast, by Application 2020 & 2033
- Table 64: Israel Inline Density Sensors Volume (K) Forecast, by Application 2020 & 2033
- Table 65: GCC Inline Density Sensors Revenue (undefined) Forecast, by Application 2020 & 2033
- Table 66: GCC Inline Density Sensors Volume (K) Forecast, by Application 2020 & 2033
- Table 67: North Africa Inline Density Sensors Revenue (undefined) Forecast, by Application 2020 & 2033
- Table 68: North Africa Inline Density Sensors Volume (K) Forecast, by Application 2020 & 2033
- Table 69: South Africa Inline Density Sensors Revenue (undefined) Forecast, by Application 2020 & 2033
- Table 70: South Africa Inline Density Sensors Volume (K) Forecast, by Application 2020 & 2033
- Table 71: Rest of Middle East & Africa Inline Density Sensors Revenue (undefined) Forecast, by Application 2020 & 2033
- Table 72: Rest of Middle East & Africa Inline Density Sensors Volume (K) Forecast, by Application 2020 & 2033
- Table 73: Global Inline Density Sensors Revenue undefined Forecast, by Application 2020 & 2033
- Table 74: Global Inline Density Sensors Volume K Forecast, by Application 2020 & 2033
- Table 75: Global Inline Density Sensors Revenue undefined Forecast, by Types 2020 & 2033
- Table 76: Global Inline Density Sensors Volume K Forecast, by Types 2020 & 2033
- Table 77: Global Inline Density Sensors Revenue undefined Forecast, by Country 2020 & 2033
- Table 78: Global Inline Density Sensors Volume K Forecast, by Country 2020 & 2033
- Table 79: China Inline Density Sensors Revenue (undefined) Forecast, by Application 2020 & 2033
- Table 80: China Inline Density Sensors Volume (K) Forecast, by Application 2020 & 2033
- Table 81: India Inline Density Sensors Revenue (undefined) Forecast, by Application 2020 & 2033
- Table 82: India Inline Density Sensors Volume (K) Forecast, by Application 2020 & 2033
- Table 83: Japan Inline Density Sensors Revenue (undefined) Forecast, by Application 2020 & 2033
- Table 84: Japan Inline Density Sensors Volume (K) Forecast, by Application 2020 & 2033
- Table 85: South Korea Inline Density Sensors Revenue (undefined) Forecast, by Application 2020 & 2033
- Table 86: South Korea Inline Density Sensors Volume (K) Forecast, by Application 2020 & 2033
- Table 87: ASEAN Inline Density Sensors Revenue (undefined) Forecast, by Application 2020 & 2033
- Table 88: ASEAN Inline Density Sensors Volume (K) Forecast, by Application 2020 & 2033
- Table 89: Oceania Inline Density Sensors Revenue (undefined) Forecast, by Application 2020 & 2033
- Table 90: Oceania Inline Density Sensors Volume (K) Forecast, by Application 2020 & 2033
- Table 91: Rest of Asia Pacific Inline Density Sensors Revenue (undefined) Forecast, by Application 2020 & 2033
- Table 92: Rest of Asia Pacific Inline Density Sensors Volume (K) Forecast, by Application 2020 & 2033
Frequently Asked Questions
1. What is the projected Compound Annual Growth Rate (CAGR) of the Inline Density Sensors?
The projected CAGR is approximately 5.3%.
2. Which companies are prominent players in the Inline Density Sensors?
Key companies in the market include Eagle Eye Power Solutions, BERTHOLD TECHNOLOGIES, Emerson Electric, Rhosonics, Integrated Sensing Systems, Anton Paar, Integrated Sensing Systems, LEMIS Process, RITTER, VAF Instruments.
3. What are the main segments of the Inline Density Sensors?
The market segments include Application, Types.
4. Can you provide details about the market size?
The market size is estimated to be USD XXX N/A as of 2022.
5. What are some drivers contributing to market growth?
N/A
6. What are the notable trends driving market growth?
N/A
7. Are there any restraints impacting market growth?
N/A
8. Can you provide examples of recent developments in the market?
N/A
9. What pricing options are available for accessing the report?
Pricing options include single-user, multi-user, and enterprise licenses priced at USD 3350.00, USD 5025.00, and USD 6700.00 respectively.
10. Is the market size provided in terms of value or volume?
The market size is provided in terms of value, measured in N/A and volume, measured in K.
11. Are there any specific market keywords associated with the report?
Yes, the market keyword associated with the report is "Inline Density Sensors," which aids in identifying and referencing the specific market segment covered.
12. How do I determine which pricing option suits my needs best?
The pricing options vary based on user requirements and access needs. Individual users may opt for single-user licenses, while businesses requiring broader access may choose multi-user or enterprise licenses for cost-effective access to the report.
13. Are there any additional resources or data provided in the Inline Density Sensors report?
While the report offers comprehensive insights, it's advisable to review the specific contents or supplementary materials provided to ascertain if additional resources or data are available.
14. How can I stay updated on further developments or reports in the Inline Density Sensors?
To stay informed about further developments, trends, and reports in the Inline Density Sensors, consider subscribing to industry newsletters, following relevant companies and organizations, or regularly checking reputable industry news sources and publications.
Methodology
Step 1 - Identification of Relevant Samples Size from Population Database


Step 2 - Approaches for Defining Global Market Size (Value, Volume* & Price*)

Note*: In applicable scenarios
Step 3 - Data Sources
Primary Research
- Web Analytics
- Survey Reports
- Research Institute
- Latest Research Reports
- Opinion Leaders
Secondary Research
- Annual Reports
- White Paper
- Latest Press Release
- Industry Association
- Paid Database
- Investor Presentations

Step 4 - Data Triangulation
Involves using different sources of information in order to increase the validity of a study
These sources are likely to be stakeholders in a program - participants, other researchers, program staff, other community members, and so on.
Then we put all data in single framework & apply various statistical tools to find out the dynamic on the market.
During the analysis stage, feedback from the stakeholder groups would be compared to determine areas of agreement as well as areas of divergence