

Key Insights
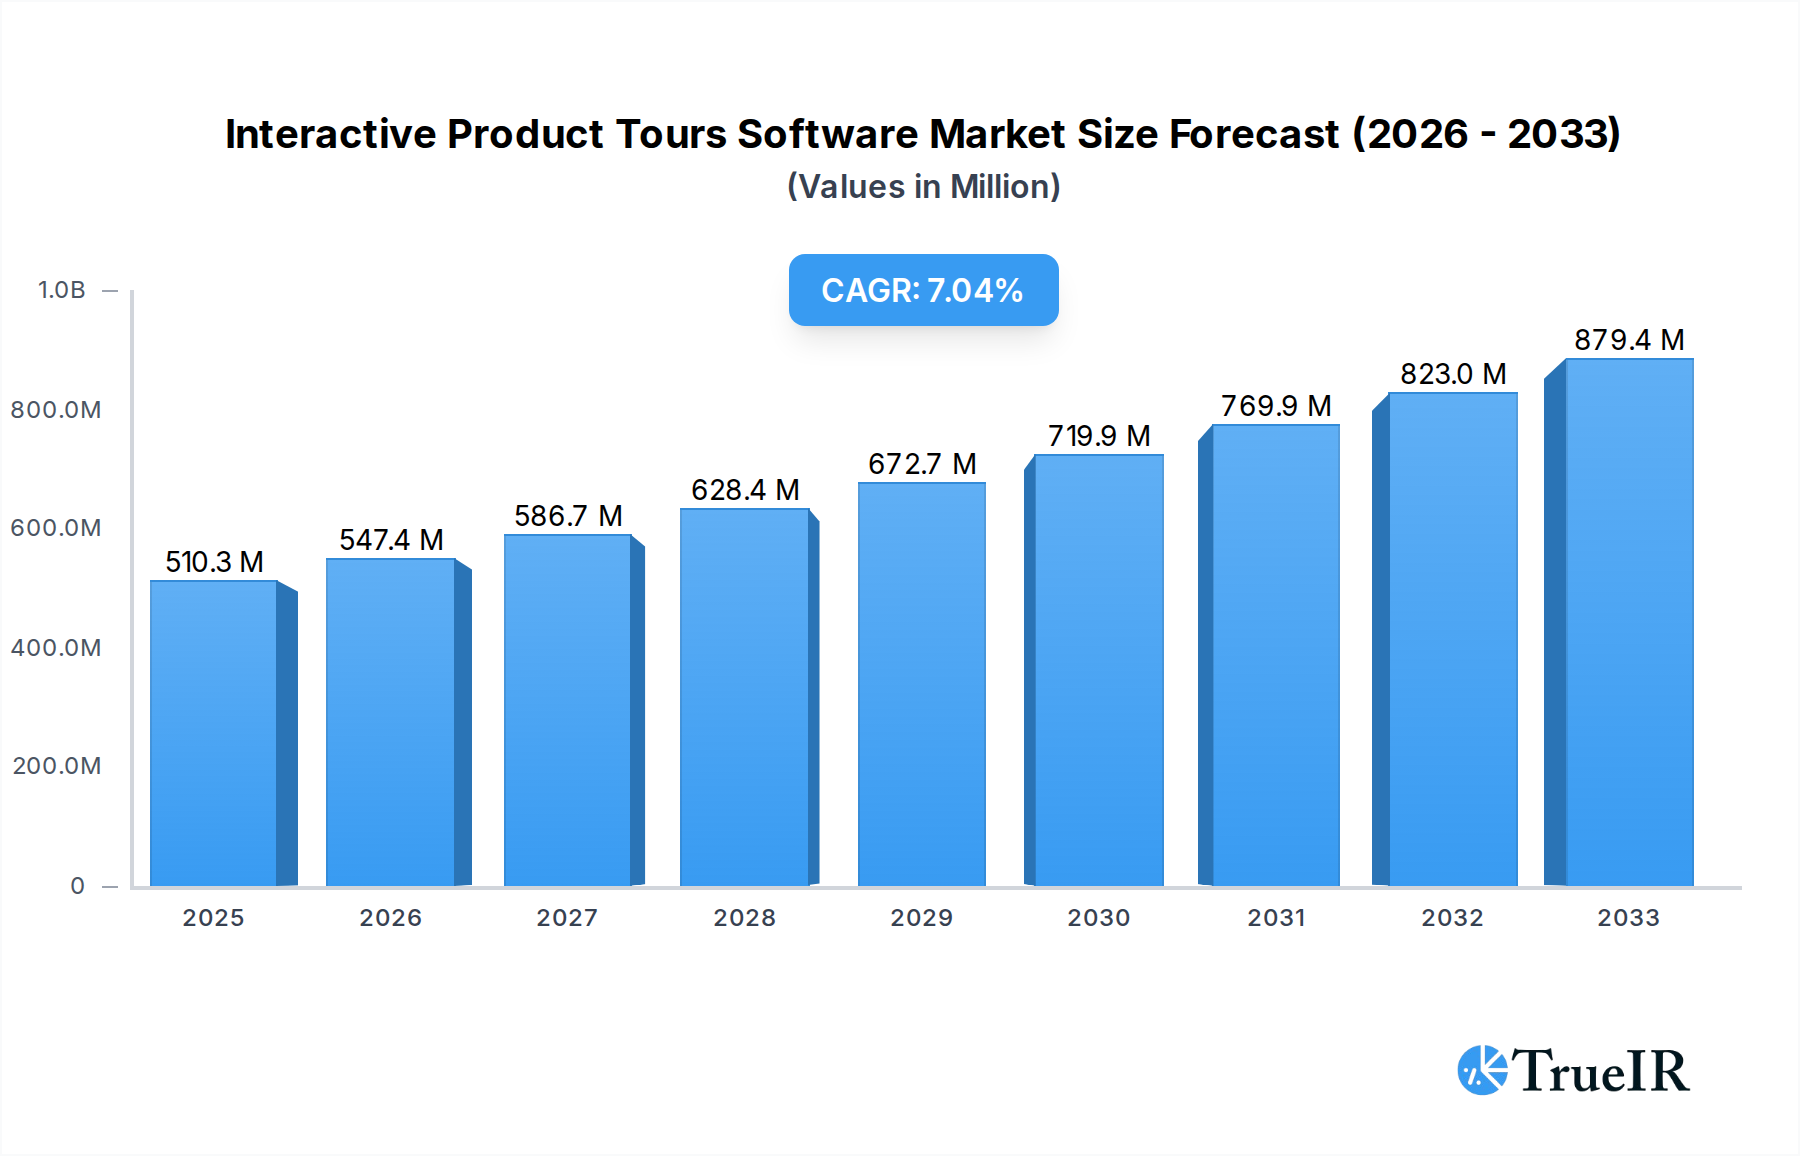
The global Interactive Product Tours Software market is poised for significant expansion, projected to reach an estimated $510.3 million by 2025. This robust growth is fueled by an anticipated Compound Annual Growth Rate (CAGR) of 7.3% from 2025 to 2033. The increasing adoption of digital products across enterprises of all sizes, coupled with the growing need for seamless user onboarding and feature adoption, are key drivers. Businesses are recognizing the critical role of intuitive product tours in reducing customer churn, enhancing user satisfaction, and ultimately boosting revenue. The software's ability to guide users through complex interfaces, highlight new features, and provide in-app support makes it indispensable for companies aiming to maximize product value and user engagement. The market is also benefiting from the rise of Software-as-a-Service (SaaS) models, making these solutions more accessible and scalable for businesses.

Interactive Product Tours Software Market Size (In Million)
The market segmentation reveals a strong demand for both No-code/Low-code Software and Full-code Software solutions, catering to a diverse user base with varying technical capabilities. While Large Enterprises are significant adopters due to their extensive product portfolios and user bases, Small and Medium-sized Enterprises (SMEs) are increasingly leveraging these tools for competitive advantage and efficient growth. Geographically, North America and Europe are expected to lead the market, driven by early adoption and a mature digital landscape. However, the Asia Pacific region is emerging as a high-growth market, owing to rapid digitalization and a burgeoning startup ecosystem. Key players are focusing on developing AI-powered features, advanced analytics, and seamless integrations with other business tools to maintain a competitive edge.
Interactive Product Tours Software Company Market Share
Interactive Product Tours Software Market Structure & Competitive Landscape
The Interactive Product Tours Software market exhibits a moderately concentrated structure, with leading players like Userpilot, Appcues, and Pendo holding significant market share. Innovation drivers are primarily focused on enhancing user onboarding efficiency, reducing customer churn, and improving feature adoption rates through intuitive, no-code/low-code solutions. Regulatory impacts are minimal, with a focus on data privacy and security compliance. Product substitutes include traditional help documentation, video tutorials, and in-app chat support, but interactive tours offer superior real-time guidance. End-user segmentation is broad, encompassing Large Enterprises and SMEs across various industries such as SaaS, e-commerce, and fintech. Merger and acquisition trends are on the rise, with approximately 15 major M&A deals recorded between 2019 and 2024, indicating consolidation and strategic expansion by larger entities to acquire innovative technologies or capture new customer bases. The concentration ratio for the top 5 players stands at around 0.65.
Interactive Product Tours Software Market Trends & Opportunities
The global Interactive Product Tours Software market is poised for substantial expansion, projected to reach an estimated value of over $6,000 million by 2033, exhibiting a robust Compound Annual Growth Rate (CAGR) of approximately 18.5% during the forecast period of 2025–2033. This surge is driven by an increasing demand from businesses seeking to optimize user onboarding, enhance customer success, and reduce support costs. The market size in the base year of 2025 is estimated at over $2,000 million. Technological advancements are a key trend, with a significant shift towards no-code/low-code platforms that empower non-technical users to create sophisticated product tours. This democratization of tool creation is a major opportunity, allowing a wider array of businesses, including SMEs, to implement interactive guidance without extensive development resources. Consumer preferences are increasingly leaning towards self-service support and personalized in-app experiences, directly benefiting the adoption of interactive product tours. Competitive dynamics are intensifying, with established players continually innovating and new entrants focusing on niche functionalities and affordability. The market penetration rate for interactive product tours among software-as-a-service (SaaS) companies is expected to exceed 75% by 2033.
The historical period from 2019 to 2024 witnessed steady growth, with the market size evolving from approximately $500 million to over $1,800 million, fueled by the growing realization of the importance of effective user onboarding in a competitive digital landscape. During this period, the adoption of full-code solutions by larger enterprises seeking highly customized experiences was prevalent, while SMEs began exploring the benefits of more accessible no-code/low-code alternatives.
The study period of 2019–2033 covers a significant evolution in digital product development and customer engagement strategies. The base year of 2025 serves as a crucial benchmark for understanding the current market trajectory.
Dominant Markets & Segments in Interactive Product Tours Software
The dominant market for Interactive Product Tours Software is currently North America, with an estimated market share of 40% in 2025. The United States, in particular, is a leading country due to its mature tech ecosystem, high adoption of SaaS products, and a significant concentration of Large Enterprises and SMEs actively seeking to improve customer onboarding and retention. Key growth drivers in this region include robust government policies supporting digital transformation and strong investment in R&D for customer success technologies.
Another significant market is Europe, with a projected market share of 25% by 2025, driven by the increasing digital maturity of its economies and a growing focus on customer experience among European businesses. Asia-Pacific is emerging as a high-growth region, expected to witness a CAGR of over 20% from 2025 to 2033, propelled by rapid digitalization, the expansion of the SME sector, and increasing adoption of advanced software solutions.
In terms of application segmentation:
- Large Enterprises: This segment represents a substantial portion of the market due to their extensive user bases, complex product functionalities, and higher budgets for customer success initiatives. Their demand is for scalable, customizable, and analytics-rich solutions. Key growth drivers include the need to reduce churn in large customer bases and the imperative to drive adoption of new features across diverse employee roles.
- SMEs: This segment is experiencing the fastest growth, primarily driven by the proliferation of no-code/low-code solutions. SMEs benefit from the affordability and ease of implementation, allowing them to compete with larger players by offering superior user experiences. Growth drivers include the increasing need to compete on customer experience and the accessibility of user-friendly tools.
In terms of type segmentation:
- No-code/Low-code Software: This segment is dominating market growth and adoption. The ease of use, rapid deployment, and cost-effectiveness are major attractions, democratizing access to interactive product tour capabilities for a wider range of businesses. Key growth drivers are the user-friendly interfaces and drag-and-drop functionalities that empower citizen developers.
- Full-code Software: While a smaller segment, full-code solutions cater to Large Enterprises with highly specific customization needs and complex integration requirements. Growth in this segment is steady, driven by the demand for deeply embedded and bespoke interactive experiences.
Interactive Product Tours Software Product Analysis
Interactive Product Tours Software is characterized by continuous product innovation, focusing on enhancing user onboarding, feature discovery, and in-app support. Key advancements include AI-powered personalization, sophisticated analytics for understanding user behavior, and seamless integration with CRM and customer support platforms. Companies are prioritizing no-code/low-code interfaces to democratize tour creation, enabling rapid deployment and iteration. Competitive advantages lie in offering intuitive design tools, robust A/B testing capabilities, and comprehensive analytics to measure tour effectiveness. The market fit is strong, as businesses globally recognize the critical role of effective product adoption in driving customer retention and reducing churn.
Key Drivers, Barriers & Challenges in Interactive Product Tours Software
Key drivers propelling the Interactive Product Tours Software market include the escalating need for efficient user onboarding to reduce churn, the growing adoption of SaaS solutions, and the increasing focus on customer experience (CX) as a competitive differentiator. Technological advancements, particularly in AI and machine learning, are enabling more personalized and effective tour experiences. Furthermore, the widespread availability of no-code/low-code platforms is democratizing access for SMEs, fostering rapid market expansion.
Challenges impacting Interactive Product Tours Software growth include the initial cost of implementation, particularly for enterprise-grade solutions, and the potential for user fatigue if tours are not well-designed or are overly intrusive. Developing engaging and effective content requires skilled resources, which can be a barrier for some organizations. Competitive pressures from alternative support methods like extensive knowledge bases and responsive customer service also present a challenge. Regulatory compliance, particularly regarding data privacy, requires careful consideration.
Growth Drivers in the Interactive Product Tours Software Market
Key growth drivers in the Interactive Product Tours Software market are multi-faceted. Technologically, the continuous evolution of AI and machine learning is enabling more intelligent and personalized user experiences, leading to higher engagement and conversion rates. Economically, the post-pandemic surge in digital transformation and the increasing reliance on SaaS solutions by businesses of all sizes are creating a fertile ground for adoption. The clear ROI in terms of reduced support costs and increased customer retention is a significant economic driver. Regulatorily, while not a primary driver, adherence to data privacy laws like GDPR and CCPA necessitates transparent and user-friendly approaches to data collection and user interaction, which interactive tours can facilitate. The rise of the gig economy and remote work also necessitates efficient digital onboarding for new team members, further fueling growth.
Challenges Impacting Interactive Product Tours Software Growth
Several challenges can impact the growth of the Interactive Product Tours Software market. Regulatory complexities, such as evolving data privacy laws across different jurisdictions, can pose compliance hurdles and require significant investment in security infrastructure. Supply chain issues are less directly relevant to software but can indirectly affect hardware dependency for some deployment models, though this is minimal. Competitive pressures from established players, new market entrants, and alternative customer support methods like extensive knowledge bases and video tutorials can fragment the market and necessitate constant innovation. The initial investment required for robust solutions can also be a barrier for smaller businesses, and a lack of internal expertise to design and implement effective tours can hinder adoption.
Key Players Shaping the Interactive Product Tours Software Market
- Userpilot
- Appcues
- Pendo
- Chameleon
- Intercom
- WalkMe
- Whatfix
- Nickelled
- Hopscotch
- Supademo
- Helphero
- UserGuiding
- Stonly
- Product Fruits
- LOU Web Technologies
- Usetiful
- Driftly
- Reprise
- Userlove
- Demostack
- Aprimo
- TrueClicks
Significant Interactive Product Tours Software Industry Milestones
- 2019: Increased focus on no-code/low-code solutions to democratize product tour creation.
- 2020: Significant surge in demand due to accelerated digital transformation and remote work adoption.
- 2021: Integration of AI and machine learning for personalized user onboarding experiences.
- 2022: Enhanced analytics capabilities become standard, offering deeper insights into user behavior.
- 2023: Consolidation through mergers and acquisitions as larger players acquire innovative startups.
- 2024: Growing emphasis on in-app customer support integration alongside product tours.
- 2025 (Estimated): Widespread adoption of interactive tours across SMEs as a core customer success tool.
- 2026-2033 (Forecast): Continued innovation in AI-driven personalization, gamification of onboarding, and cross-platform tour consistency.
Future Outlook for Interactive Product Tours Software Market
The future outlook for the Interactive Product Tours Software market is exceptionally bright, projected to experience sustained high growth. The increasing recognition of product tours as a critical component of customer success, essential for driving feature adoption, reducing churn, and enhancing user satisfaction, will continue to fuel demand. Strategic opportunities lie in expanding into emerging markets, further refining AI capabilities for hyper-personalized user journeys, and developing more robust analytics to demonstrate clear ROI. The continued shift towards no-code/low-code solutions will democratize access, allowing smaller businesses to leverage powerful onboarding tools and further expanding the market's reach. The market potential is vast, driven by the ongoing digital transformation across all industries and the relentless pursuit of superior customer experiences.
Interactive Product Tours Software Segmentation
-
1. Application
- 1.1. Large Enterprises
- 1.2. SMEs
-
2. Types
- 2.1. No-code/Low-code Software
- 2.2. Full-code Software
Interactive Product Tours Software Segmentation By Geography
-
1. North America
- 1.1. United States
- 1.2. Canada
- 1.3. Mexico
-
2. South America
- 2.1. Brazil
- 2.2. Argentina
- 2.3. Rest of South America
-
3. Europe
- 3.1. United Kingdom
- 3.2. Germany
- 3.3. France
- 3.4. Italy
- 3.5. Spain
- 3.6. Russia
- 3.7. Benelux
- 3.8. Nordics
- 3.9. Rest of Europe
-
4. Middle East & Africa
- 4.1. Turkey
- 4.2. Israel
- 4.3. GCC
- 4.4. North Africa
- 4.5. South Africa
- 4.6. Rest of Middle East & Africa
-
5. Asia Pacific
- 5.1. China
- 5.2. India
- 5.3. Japan
- 5.4. South Korea
- 5.5. ASEAN
- 5.6. Oceania
- 5.7. Rest of Asia Pacific

Interactive Product Tours Software Regional Market Share
Geographic Coverage of Interactive Product Tours Software
Interactive Product Tours Software REPORT HIGHLIGHTS
| Aspects | Details |
|---|---|
| Study Period | 2020-2034 |
| Base Year | 2025 |
| Estimated Year | 2026 |
| Forecast Period | 2026-2034 |
| Historical Period | 2020-2025 |
| Growth Rate | CAGR of 7.3% from 2020-2034 |
| Segmentation |
|
Table of Contents
- 1. Introduction
- 1.1. Research Scope
- 1.2. Market Segmentation
- 1.3. Research Methodology
- 1.4. Definitions and Assumptions
- 2. Executive Summary
- 2.1. Introduction
- 3. Market Dynamics
- 3.1. Introduction
- 3.2. Market Drivers
- 3.3. Market Restrains
- 3.4. Market Trends
- 4. Market Factor Analysis
- 4.1. Porters Five Forces
- 4.2. Supply/Value Chain
- 4.3. PESTEL analysis
- 4.4. Market Entropy
- 4.5. Patent/Trademark Analysis
- 5. Global Interactive Product Tours Software Analysis, Insights and Forecast, 2020-2032
- 5.1. Market Analysis, Insights and Forecast - by Application
- 5.1.1. Large Enterprises
- 5.1.2. SMEs
- 5.2. Market Analysis, Insights and Forecast - by Types
- 5.2.1. No-code/Low-code Software
- 5.2.2. Full-code Software
- 5.3. Market Analysis, Insights and Forecast - by Region
- 5.3.1. North America
- 5.3.2. South America
- 5.3.3. Europe
- 5.3.4. Middle East & Africa
- 5.3.5. Asia Pacific
- 5.1. Market Analysis, Insights and Forecast - by Application
- 6. North America Interactive Product Tours Software Analysis, Insights and Forecast, 2020-2032
- 6.1. Market Analysis, Insights and Forecast - by Application
- 6.1.1. Large Enterprises
- 6.1.2. SMEs
- 6.2. Market Analysis, Insights and Forecast - by Types
- 6.2.1. No-code/Low-code Software
- 6.2.2. Full-code Software
- 6.1. Market Analysis, Insights and Forecast - by Application
- 7. South America Interactive Product Tours Software Analysis, Insights and Forecast, 2020-2032
- 7.1. Market Analysis, Insights and Forecast - by Application
- 7.1.1. Large Enterprises
- 7.1.2. SMEs
- 7.2. Market Analysis, Insights and Forecast - by Types
- 7.2.1. No-code/Low-code Software
- 7.2.2. Full-code Software
- 7.1. Market Analysis, Insights and Forecast - by Application
- 8. Europe Interactive Product Tours Software Analysis, Insights and Forecast, 2020-2032
- 8.1. Market Analysis, Insights and Forecast - by Application
- 8.1.1. Large Enterprises
- 8.1.2. SMEs
- 8.2. Market Analysis, Insights and Forecast - by Types
- 8.2.1. No-code/Low-code Software
- 8.2.2. Full-code Software
- 8.1. Market Analysis, Insights and Forecast - by Application
- 9. Middle East & Africa Interactive Product Tours Software Analysis, Insights and Forecast, 2020-2032
- 9.1. Market Analysis, Insights and Forecast - by Application
- 9.1.1. Large Enterprises
- 9.1.2. SMEs
- 9.2. Market Analysis, Insights and Forecast - by Types
- 9.2.1. No-code/Low-code Software
- 9.2.2. Full-code Software
- 9.1. Market Analysis, Insights and Forecast - by Application
- 10. Asia Pacific Interactive Product Tours Software Analysis, Insights and Forecast, 2020-2032
- 10.1. Market Analysis, Insights and Forecast - by Application
- 10.1.1. Large Enterprises
- 10.1.2. SMEs
- 10.2. Market Analysis, Insights and Forecast - by Types
- 10.2.1. No-code/Low-code Software
- 10.2.2. Full-code Software
- 10.1. Market Analysis, Insights and Forecast - by Application
- 11. Competitive Analysis
- 11.1. Global Market Share Analysis 2025
- 11.2. Company Profiles
- 11.2.1 Userpilot
- 11.2.1.1. Overview
- 11.2.1.2. Products
- 11.2.1.3. SWOT Analysis
- 11.2.1.4. Recent Developments
- 11.2.1.5. Financials (Based on Availability)
- 11.2.2 Appcues
- 11.2.2.1. Overview
- 11.2.2.2. Products
- 11.2.2.3. SWOT Analysis
- 11.2.2.4. Recent Developments
- 11.2.2.5. Financials (Based on Availability)
- 11.2.3 Pendo
- 11.2.3.1. Overview
- 11.2.3.2. Products
- 11.2.3.3. SWOT Analysis
- 11.2.3.4. Recent Developments
- 11.2.3.5. Financials (Based on Availability)
- 11.2.4 Chameleon
- 11.2.4.1. Overview
- 11.2.4.2. Products
- 11.2.4.3. SWOT Analysis
- 11.2.4.4. Recent Developments
- 11.2.4.5. Financials (Based on Availability)
- 11.2.5 Intercom
- 11.2.5.1. Overview
- 11.2.5.2. Products
- 11.2.5.3. SWOT Analysis
- 11.2.5.4. Recent Developments
- 11.2.5.5. Financials (Based on Availability)
- 11.2.6 WalkMe
- 11.2.6.1. Overview
- 11.2.6.2. Products
- 11.2.6.3. SWOT Analysis
- 11.2.6.4. Recent Developments
- 11.2.6.5. Financials (Based on Availability)
- 11.2.7 Whatfix
- 11.2.7.1. Overview
- 11.2.7.2. Products
- 11.2.7.3. SWOT Analysis
- 11.2.7.4. Recent Developments
- 11.2.7.5. Financials (Based on Availability)
- 11.2.8 Nickelled
- 11.2.8.1. Overview
- 11.2.8.2. Products
- 11.2.8.3. SWOT Analysis
- 11.2.8.4. Recent Developments
- 11.2.8.5. Financials (Based on Availability)
- 11.2.9 Hopscotch
- 11.2.9.1. Overview
- 11.2.9.2. Products
- 11.2.9.3. SWOT Analysis
- 11.2.9.4. Recent Developments
- 11.2.9.5. Financials (Based on Availability)
- 11.2.10 Supademo
- 11.2.10.1. Overview
- 11.2.10.2. Products
- 11.2.10.3. SWOT Analysis
- 11.2.10.4. Recent Developments
- 11.2.10.5. Financials (Based on Availability)
- 11.2.11 Helphero
- 11.2.11.1. Overview
- 11.2.11.2. Products
- 11.2.11.3. SWOT Analysis
- 11.2.11.4. Recent Developments
- 11.2.11.5. Financials (Based on Availability)
- 11.2.12 UserGuiding
- 11.2.12.1. Overview
- 11.2.12.2. Products
- 11.2.12.3. SWOT Analysis
- 11.2.12.4. Recent Developments
- 11.2.12.5. Financials (Based on Availability)
- 11.2.13 Stonly
- 11.2.13.1. Overview
- 11.2.13.2. Products
- 11.2.13.3. SWOT Analysis
- 11.2.13.4. Recent Developments
- 11.2.13.5. Financials (Based on Availability)
- 11.2.14 Product Fruits
- 11.2.14.1. Overview
- 11.2.14.2. Products
- 11.2.14.3. SWOT Analysis
- 11.2.14.4. Recent Developments
- 11.2.14.5. Financials (Based on Availability)
- 11.2.15 LOU Web Technologies
- 11.2.15.1. Overview
- 11.2.15.2. Products
- 11.2.15.3. SWOT Analysis
- 11.2.15.4. Recent Developments
- 11.2.15.5. Financials (Based on Availability)
- 11.2.16 Usetiful
- 11.2.16.1. Overview
- 11.2.16.2. Products
- 11.2.16.3. SWOT Analysis
- 11.2.16.4. Recent Developments
- 11.2.16.5. Financials (Based on Availability)
- 11.2.17 Driftly
- 11.2.17.1. Overview
- 11.2.17.2. Products
- 11.2.17.3. SWOT Analysis
- 11.2.17.4. Recent Developments
- 11.2.17.5. Financials (Based on Availability)
- 11.2.18 Reprise
- 11.2.18.1. Overview
- 11.2.18.2. Products
- 11.2.18.3. SWOT Analysis
- 11.2.18.4. Recent Developments
- 11.2.18.5. Financials (Based on Availability)
- 11.2.19 Userlove
- 11.2.19.1. Overview
- 11.2.19.2. Products
- 11.2.19.3. SWOT Analysis
- 11.2.19.4. Recent Developments
- 11.2.19.5. Financials (Based on Availability)
- 11.2.20 Demostack
- 11.2.20.1. Overview
- 11.2.20.2. Products
- 11.2.20.3. SWOT Analysis
- 11.2.20.4. Recent Developments
- 11.2.20.5. Financials (Based on Availability)
- 11.2.21 Aprimo
- 11.2.21.1. Overview
- 11.2.21.2. Products
- 11.2.21.3. SWOT Analysis
- 11.2.21.4. Recent Developments
- 11.2.21.5. Financials (Based on Availability)
- 11.2.22 TrueClicks
- 11.2.22.1. Overview
- 11.2.22.2. Products
- 11.2.22.3. SWOT Analysis
- 11.2.22.4. Recent Developments
- 11.2.22.5. Financials (Based on Availability)
- 11.2.1 Userpilot
List of Figures
- Figure 1: Global Interactive Product Tours Software Revenue Breakdown (undefined, %) by Region 2025 & 2033
- Figure 2: North America Interactive Product Tours Software Revenue (undefined), by Application 2025 & 2033
- Figure 3: North America Interactive Product Tours Software Revenue Share (%), by Application 2025 & 2033
- Figure 4: North America Interactive Product Tours Software Revenue (undefined), by Types 2025 & 2033
- Figure 5: North America Interactive Product Tours Software Revenue Share (%), by Types 2025 & 2033
- Figure 6: North America Interactive Product Tours Software Revenue (undefined), by Country 2025 & 2033
- Figure 7: North America Interactive Product Tours Software Revenue Share (%), by Country 2025 & 2033
- Figure 8: South America Interactive Product Tours Software Revenue (undefined), by Application 2025 & 2033
- Figure 9: South America Interactive Product Tours Software Revenue Share (%), by Application 2025 & 2033
- Figure 10: South America Interactive Product Tours Software Revenue (undefined), by Types 2025 & 2033
- Figure 11: South America Interactive Product Tours Software Revenue Share (%), by Types 2025 & 2033
- Figure 12: South America Interactive Product Tours Software Revenue (undefined), by Country 2025 & 2033
- Figure 13: South America Interactive Product Tours Software Revenue Share (%), by Country 2025 & 2033
- Figure 14: Europe Interactive Product Tours Software Revenue (undefined), by Application 2025 & 2033
- Figure 15: Europe Interactive Product Tours Software Revenue Share (%), by Application 2025 & 2033
- Figure 16: Europe Interactive Product Tours Software Revenue (undefined), by Types 2025 & 2033
- Figure 17: Europe Interactive Product Tours Software Revenue Share (%), by Types 2025 & 2033
- Figure 18: Europe Interactive Product Tours Software Revenue (undefined), by Country 2025 & 2033
- Figure 19: Europe Interactive Product Tours Software Revenue Share (%), by Country 2025 & 2033
- Figure 20: Middle East & Africa Interactive Product Tours Software Revenue (undefined), by Application 2025 & 2033
- Figure 21: Middle East & Africa Interactive Product Tours Software Revenue Share (%), by Application 2025 & 2033
- Figure 22: Middle East & Africa Interactive Product Tours Software Revenue (undefined), by Types 2025 & 2033
- Figure 23: Middle East & Africa Interactive Product Tours Software Revenue Share (%), by Types 2025 & 2033
- Figure 24: Middle East & Africa Interactive Product Tours Software Revenue (undefined), by Country 2025 & 2033
- Figure 25: Middle East & Africa Interactive Product Tours Software Revenue Share (%), by Country 2025 & 2033
- Figure 26: Asia Pacific Interactive Product Tours Software Revenue (undefined), by Application 2025 & 2033
- Figure 27: Asia Pacific Interactive Product Tours Software Revenue Share (%), by Application 2025 & 2033
- Figure 28: Asia Pacific Interactive Product Tours Software Revenue (undefined), by Types 2025 & 2033
- Figure 29: Asia Pacific Interactive Product Tours Software Revenue Share (%), by Types 2025 & 2033
- Figure 30: Asia Pacific Interactive Product Tours Software Revenue (undefined), by Country 2025 & 2033
- Figure 31: Asia Pacific Interactive Product Tours Software Revenue Share (%), by Country 2025 & 2033
List of Tables
- Table 1: Global Interactive Product Tours Software Revenue undefined Forecast, by Application 2020 & 2033
- Table 2: Global Interactive Product Tours Software Revenue undefined Forecast, by Types 2020 & 2033
- Table 3: Global Interactive Product Tours Software Revenue undefined Forecast, by Region 2020 & 2033
- Table 4: Global Interactive Product Tours Software Revenue undefined Forecast, by Application 2020 & 2033
- Table 5: Global Interactive Product Tours Software Revenue undefined Forecast, by Types 2020 & 2033
- Table 6: Global Interactive Product Tours Software Revenue undefined Forecast, by Country 2020 & 2033
- Table 7: United States Interactive Product Tours Software Revenue (undefined) Forecast, by Application 2020 & 2033
- Table 8: Canada Interactive Product Tours Software Revenue (undefined) Forecast, by Application 2020 & 2033
- Table 9: Mexico Interactive Product Tours Software Revenue (undefined) Forecast, by Application 2020 & 2033
- Table 10: Global Interactive Product Tours Software Revenue undefined Forecast, by Application 2020 & 2033
- Table 11: Global Interactive Product Tours Software Revenue undefined Forecast, by Types 2020 & 2033
- Table 12: Global Interactive Product Tours Software Revenue undefined Forecast, by Country 2020 & 2033
- Table 13: Brazil Interactive Product Tours Software Revenue (undefined) Forecast, by Application 2020 & 2033
- Table 14: Argentina Interactive Product Tours Software Revenue (undefined) Forecast, by Application 2020 & 2033
- Table 15: Rest of South America Interactive Product Tours Software Revenue (undefined) Forecast, by Application 2020 & 2033
- Table 16: Global Interactive Product Tours Software Revenue undefined Forecast, by Application 2020 & 2033
- Table 17: Global Interactive Product Tours Software Revenue undefined Forecast, by Types 2020 & 2033
- Table 18: Global Interactive Product Tours Software Revenue undefined Forecast, by Country 2020 & 2033
- Table 19: United Kingdom Interactive Product Tours Software Revenue (undefined) Forecast, by Application 2020 & 2033
- Table 20: Germany Interactive Product Tours Software Revenue (undefined) Forecast, by Application 2020 & 2033
- Table 21: France Interactive Product Tours Software Revenue (undefined) Forecast, by Application 2020 & 2033
- Table 22: Italy Interactive Product Tours Software Revenue (undefined) Forecast, by Application 2020 & 2033
- Table 23: Spain Interactive Product Tours Software Revenue (undefined) Forecast, by Application 2020 & 2033
- Table 24: Russia Interactive Product Tours Software Revenue (undefined) Forecast, by Application 2020 & 2033
- Table 25: Benelux Interactive Product Tours Software Revenue (undefined) Forecast, by Application 2020 & 2033
- Table 26: Nordics Interactive Product Tours Software Revenue (undefined) Forecast, by Application 2020 & 2033
- Table 27: Rest of Europe Interactive Product Tours Software Revenue (undefined) Forecast, by Application 2020 & 2033
- Table 28: Global Interactive Product Tours Software Revenue undefined Forecast, by Application 2020 & 2033
- Table 29: Global Interactive Product Tours Software Revenue undefined Forecast, by Types 2020 & 2033
- Table 30: Global Interactive Product Tours Software Revenue undefined Forecast, by Country 2020 & 2033
- Table 31: Turkey Interactive Product Tours Software Revenue (undefined) Forecast, by Application 2020 & 2033
- Table 32: Israel Interactive Product Tours Software Revenue (undefined) Forecast, by Application 2020 & 2033
- Table 33: GCC Interactive Product Tours Software Revenue (undefined) Forecast, by Application 2020 & 2033
- Table 34: North Africa Interactive Product Tours Software Revenue (undefined) Forecast, by Application 2020 & 2033
- Table 35: South Africa Interactive Product Tours Software Revenue (undefined) Forecast, by Application 2020 & 2033
- Table 36: Rest of Middle East & Africa Interactive Product Tours Software Revenue (undefined) Forecast, by Application 2020 & 2033
- Table 37: Global Interactive Product Tours Software Revenue undefined Forecast, by Application 2020 & 2033
- Table 38: Global Interactive Product Tours Software Revenue undefined Forecast, by Types 2020 & 2033
- Table 39: Global Interactive Product Tours Software Revenue undefined Forecast, by Country 2020 & 2033
- Table 40: China Interactive Product Tours Software Revenue (undefined) Forecast, by Application 2020 & 2033
- Table 41: India Interactive Product Tours Software Revenue (undefined) Forecast, by Application 2020 & 2033
- Table 42: Japan Interactive Product Tours Software Revenue (undefined) Forecast, by Application 2020 & 2033
- Table 43: South Korea Interactive Product Tours Software Revenue (undefined) Forecast, by Application 2020 & 2033
- Table 44: ASEAN Interactive Product Tours Software Revenue (undefined) Forecast, by Application 2020 & 2033
- Table 45: Oceania Interactive Product Tours Software Revenue (undefined) Forecast, by Application 2020 & 2033
- Table 46: Rest of Asia Pacific Interactive Product Tours Software Revenue (undefined) Forecast, by Application 2020 & 2033
Frequently Asked Questions
1. What is the projected Compound Annual Growth Rate (CAGR) of the Interactive Product Tours Software?
The projected CAGR is approximately 7.3%.
2. Which companies are prominent players in the Interactive Product Tours Software?
Key companies in the market include Userpilot, Appcues, Pendo, Chameleon, Intercom, WalkMe, Whatfix, Nickelled, Hopscotch, Supademo, Helphero, UserGuiding, Stonly, Product Fruits, LOU Web Technologies, Usetiful, Driftly, Reprise, Userlove, Demostack, Aprimo, TrueClicks.
3. What are the main segments of the Interactive Product Tours Software?
The market segments include Application, Types.
4. Can you provide details about the market size?
The market size is estimated to be USD XXX N/A as of 2022.
5. What are some drivers contributing to market growth?
N/A
6. What are the notable trends driving market growth?
N/A
7. Are there any restraints impacting market growth?
N/A
8. Can you provide examples of recent developments in the market?
N/A
9. What pricing options are available for accessing the report?
Pricing options include single-user, multi-user, and enterprise licenses priced at USD 2900.00, USD 4350.00, and USD 5800.00 respectively.
10. Is the market size provided in terms of value or volume?
The market size is provided in terms of value, measured in N/A.
11. Are there any specific market keywords associated with the report?
Yes, the market keyword associated with the report is "Interactive Product Tours Software," which aids in identifying and referencing the specific market segment covered.
12. How do I determine which pricing option suits my needs best?
The pricing options vary based on user requirements and access needs. Individual users may opt for single-user licenses, while businesses requiring broader access may choose multi-user or enterprise licenses for cost-effective access to the report.
13. Are there any additional resources or data provided in the Interactive Product Tours Software report?
While the report offers comprehensive insights, it's advisable to review the specific contents or supplementary materials provided to ascertain if additional resources or data are available.
14. How can I stay updated on further developments or reports in the Interactive Product Tours Software?
To stay informed about further developments, trends, and reports in the Interactive Product Tours Software, consider subscribing to industry newsletters, following relevant companies and organizations, or regularly checking reputable industry news sources and publications.
Methodology
Step 1 - Identification of Relevant Samples Size from Population Database


Step 2 - Approaches for Defining Global Market Size (Value, Volume* & Price*)

Note*: In applicable scenarios
Step 3 - Data Sources
Primary Research
- Web Analytics
- Survey Reports
- Research Institute
- Latest Research Reports
- Opinion Leaders
Secondary Research
- Annual Reports
- White Paper
- Latest Press Release
- Industry Association
- Paid Database
- Investor Presentations

Step 4 - Data Triangulation
Involves using different sources of information in order to increase the validity of a study
These sources are likely to be stakeholders in a program - participants, other researchers, program staff, other community members, and so on.
Then we put all data in single framework & apply various statistical tools to find out the dynamic on the market.
During the analysis stage, feedback from the stakeholder groups would be compared to determine areas of agreement as well as areas of divergence