

Key Insights
The interactive whiteboard and smartboard market is poised for significant expansion, propelled by the accelerating digital transformation across educational and corporate landscapes. Demand for interactive displays is growing, driven by the adoption of technology-enhanced learning environments and collaborative workspaces that integrate seamlessly with diverse software and platforms. Based on current market trends and analogous technology sector CAGRs, the market is estimated to reach $5.6 billion by 2025, with a projected Compound Annual Growth Rate (CAGR) of 9.7% throughout the forecast period (2025-2033). Advancements in display technology, including higher resolutions, superior touch sensitivity, and enhanced interactivity, are key growth drivers. The integration of cloud-based solutions, augmented reality capabilities, and advanced collaboration tools further elevates the value proposition for both educational institutions and businesses. Leading vendors such as SMART Technologies and Promethean are continuously innovating, introducing features like multi-touch functionality, wireless screen sharing, and sophisticated annotation tools to maintain market leadership and address evolving consumer needs.
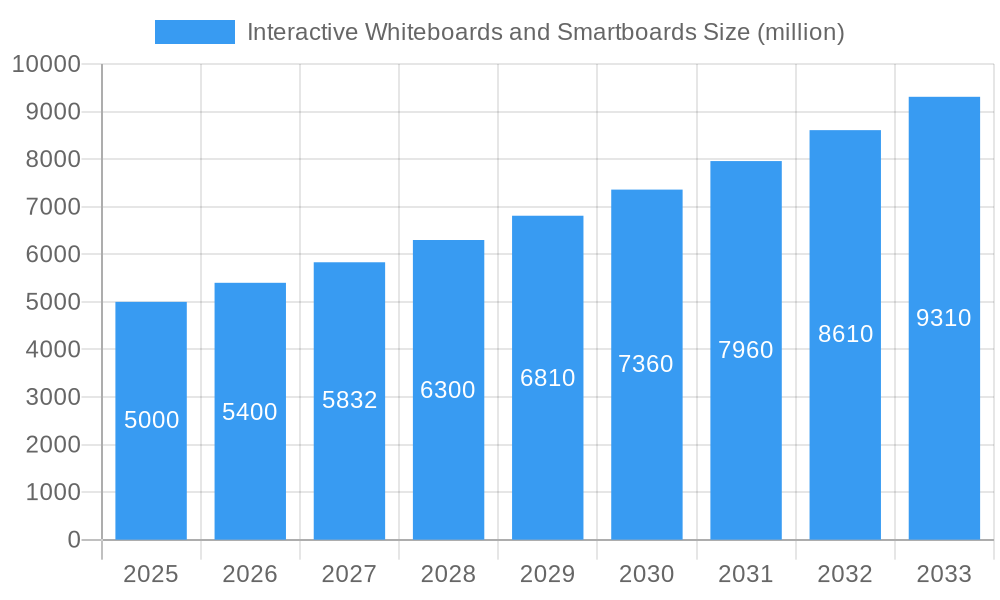
Interactive Whiteboards and Smartboards Market Size (In Billion)
Market growth faces certain challenges, predominantly the substantial initial investment required for interactive whiteboard and smartboard implementation, particularly for budget-conscious educational bodies and small enterprises. However, the long-term benefits, including reduced printing expenses, enhanced pedagogical effectiveness, and improved employee collaboration, are anticipated to offset upfront costs. The market is segmented by display size, resolution, technology (LED, LCD), and application (education, corporate, healthcare). While North America and Europe currently dominate market share, the Asia-Pacific region is expected to experience accelerated growth. The competitive arena features established players alongside emerging brands offering cost-effective alternatives. Strategic collaborations, mergers, acquisitions, and ongoing technological breakthroughs will continue to shape market dynamics and foster future innovation.
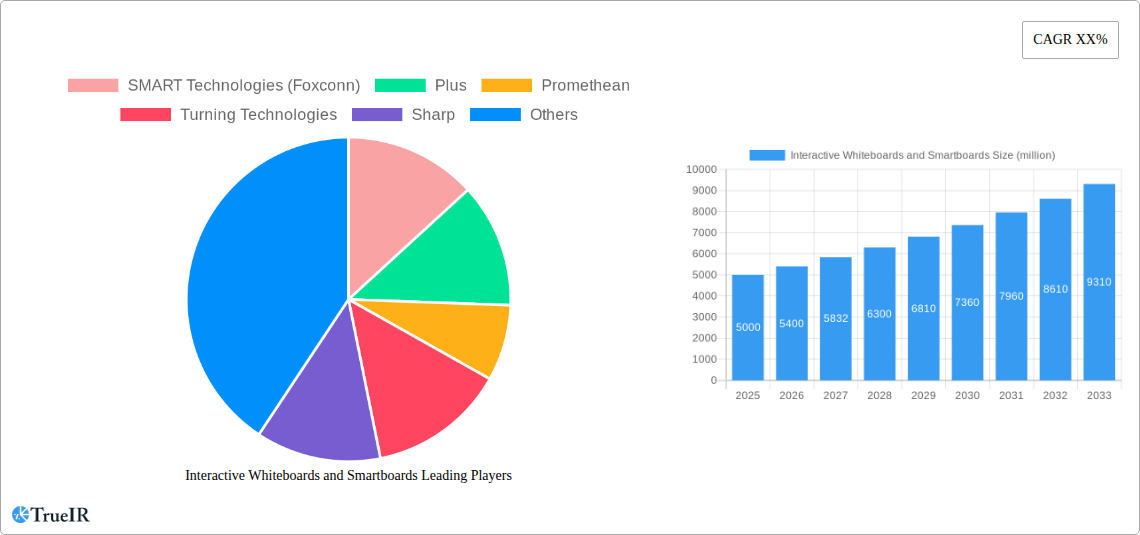
Interactive Whiteboards and Smartboards Company Market Share
Interactive Whiteboards and Smartboards Market Report: 2019-2033
This comprehensive report delivers an in-depth analysis of the global interactive whiteboards and smartboards market, providing crucial insights for stakeholders across the education, corporate, and government sectors. With a focus on market trends, competitive dynamics, and future growth projections, this report covers the period from 2019 to 2033, leveraging data from the base year 2025 and estimating market performance through 2033. The study encompasses a detailed analysis of over two dozen key players and identifies significant growth opportunities within this rapidly evolving technological landscape. Expect millions of dollars in market value projections and insightful analysis across numerous market segments.
Interactive Whiteboards and Smartboards Market Structure & Competitive Landscape
The global interactive whiteboards and smartboards market is characterized by a moderately concentrated landscape. While a handful of major players such as SMART Technologies (Foxconn), Promethean, and Panasonic hold significant market share, numerous smaller companies like Hitevision and Seewo are also actively competing. The market concentration ratio (CR5) is estimated at 40% in 2025, indicating moderate dominance by the top five players. Innovation drives this market significantly, with companies constantly upgrading their products with features like improved touch sensitivity, 4K resolution, and seamless integration with cloud-based learning platforms. Regulatory impacts are currently minimal, largely focused on safety and accessibility standards. Product substitutes, such as large-screen projectors and traditional whiteboards, continue to exist but have limited impact due to the interactive capabilities offered by smartboards.
The end-user segmentation is primarily driven by education and corporate sectors, with education accounting for xx% of the market in 2025. Mergers and acquisitions (M&A) activity has been moderate over the past five years, with xx major deals recorded during the historical period (2019-2024). This activity is expected to increase over the forecast period (2025-2033) driven by increased competition and the desire for companies to gain market share and access new technologies.
Interactive Whiteboards and Smartboards Market Trends & Opportunities
The global interactive whiteboards and smartboards market exhibits robust growth, with a projected Compound Annual Growth Rate (CAGR) of xx% during the forecast period (2025-2033). This growth is fueled by several key factors, including rising adoption in educational institutions, growing demand in corporate settings for collaborative workspaces, and increasing government initiatives promoting technology integration in classrooms. The market size is estimated to reach $xx million in 2025 and is projected to exceed $xx million by 2033.
Technological advancements play a crucial role in shaping market trends. The shift towards larger screen sizes, improved touch sensitivity, and the integration of advanced features like wireless connectivity and augmented reality functionalities are significant drivers of market growth. Consumer preferences are increasingly leaning towards user-friendly interfaces, cloud connectivity, and cost-effective solutions. Competitive dynamics remain intense, with companies engaging in strategic partnerships, product innovation, and aggressive pricing strategies to capture market share. Market penetration rates in developing economies are expected to rise significantly, presenting lucrative opportunities for market expansion.
Dominant Markets & Segments in Interactive Whiteboards and Smartboards
The North American region holds a dominant position in the global interactive whiteboards and smartboards market, capturing xx% of the global market share in 2025. This dominance is attributed to high levels of technology adoption in both the education and corporate sectors, strong government support for technology integration, and a high level of disposable income.
- Key Growth Drivers in North America:
- High levels of technology adoption in education and corporate sectors.
- Strong government support for educational technology initiatives.
- High disposable income levels allowing for increased technology spending.
- Well-established distribution networks.
Asia-Pacific is the second-largest market, projected to witness rapid growth during the forecast period. This is primarily driven by increasing government investments in education, a burgeoning middle class with rising disposable incomes, and a growing demand for interactive learning experiences. The European market also presents significant opportunities, though growth is expected to be more moderate compared to the Asia-Pacific region.
Interactive Whiteboards and Smartboards Product Analysis
The interactive whiteboard and smartboard market showcases continuous product innovation. Recent advancements include improved touch sensitivity, increased resolution (including 4K options), enhanced software integration for seamless collaboration and content sharing, and the incorporation of augmented reality features for enriching learning experiences. These innovations are designed to cater to diverse applications, including classroom instruction, corporate presentations, and collaborative workspaces. Competitive advantages are increasingly being built around features, ease of use, software integration, and robust after-sales support.
Key Drivers, Barriers & Challenges in Interactive Whiteboards and Smartboards
Key Drivers: The primary drivers for market growth include the increasing demand for interactive learning experiences in the education sector, rising adoption of collaborative workspaces in corporate environments, and significant government investments in educational technology infrastructure across several regions. Technological advancements, including the development of more user-friendly interfaces and sophisticated software integration, are further accelerating market expansion.
Key Challenges: Significant barriers include the high initial investment cost of smartboards, concerns about the long-term maintenance and support requirements, and the potential for technology integration issues within existing educational or corporate systems. Competition from alternative technologies like large-screen projectors also impacts market growth. Supply chain disruptions, particularly concerning critical components like display panels, have resulted in xx% increase in average smartboard prices over the last two years.
Growth Drivers in the Interactive Whiteboards and Smartboards Market
Technological advancements, particularly in areas such as touch sensitivity, display resolution, and software integration, are driving market growth. Economic factors like rising disposable incomes and increased government spending on education and technology infrastructure play a major role. Regulatory factors, such as policies promoting technology integration in education, also significantly influence market expansion. The increasing demand for collaborative workspaces and interactive learning experiences further accelerates market growth.
Challenges Impacting Interactive Whiteboards and Smartboards Growth
High initial costs, complex integration requirements, and potential maintenance issues pose significant challenges. The competitive landscape, featuring established and emerging players, also influences market dynamics. Supply chain disruptions and fluctuations in component prices can impact production costs and product availability. Regulatory hurdles in certain regions, along with concerns regarding data security and privacy, further affect market expansion.
Key Players Shaping the Interactive Whiteboards and Smartboards Market
- SMART Technologies (Foxconn)
- Plus
- Promethean
- Turning Technologies
- Sharp
- Panasonic
- Ricoh
- Hitachi
- Genee
- Hitevision
- CVTE
- Changhong
- Julong
- Returnstar
- Seewo
- Skyworth
- CreateView
- MAXHUB
- Horion
- Hisense
- Huawei
- INTECH
- Haiya
Significant Interactive Whiteboards and Smartboards Industry Milestones
- 2020: SMART Technologies launched its new interactive whiteboard series with enhanced collaboration features.
- 2021: Promethean acquired a smaller competitor, expanding its product portfolio.
- 2022: Several major players introduced interactive whiteboards with improved 4K resolution displays.
- 2023: The introduction of several new models integrating AI functionalities was seen.
- 2024: A significant increase in M&A activity in the market was observed.
Future Outlook for Interactive Whiteboards and Smartboards Market
The future outlook for the interactive whiteboards and smartboards market remains highly positive. Continued technological advancements, coupled with rising demand from both the education and corporate sectors, are expected to drive robust growth throughout the forecast period. Strategic partnerships, focused on software integration and improved user experiences, will play a crucial role in shaping market dynamics. The market is poised for significant expansion, driven by an increasing emphasis on interactive learning and collaborative work environments.
Interactive Whiteboards and Smartboards Segmentation
-
1. Application
- 1.1. Education Field
- 1.2. Business Field
- 1.3. Government Field
- 1.4. Household Field
- 1.5. Others
-
2. Types
- 2.1. Interactive Whiteboards
- 2.2. Interactive Smartboards
Interactive Whiteboards and Smartboards Segmentation By Geography
-
1. North America
- 1.1. United States
- 1.2. Canada
- 1.3. Mexico
-
2. South America
- 2.1. Brazil
- 2.2. Argentina
- 2.3. Rest of South America
-
3. Europe
- 3.1. United Kingdom
- 3.2. Germany
- 3.3. France
- 3.4. Italy
- 3.5. Spain
- 3.6. Russia
- 3.7. Benelux
- 3.8. Nordics
- 3.9. Rest of Europe
-
4. Middle East & Africa
- 4.1. Turkey
- 4.2. Israel
- 4.3. GCC
- 4.4. North Africa
- 4.5. South Africa
- 4.6. Rest of Middle East & Africa
-
5. Asia Pacific
- 5.1. China
- 5.2. India
- 5.3. Japan
- 5.4. South Korea
- 5.5. ASEAN
- 5.6. Oceania
- 5.7. Rest of Asia Pacific

Interactive Whiteboards and Smartboards Regional Market Share
Geographic Coverage of Interactive Whiteboards and Smartboards
Interactive Whiteboards and Smartboards REPORT HIGHLIGHTS
| Aspects | Details |
|---|---|
| Study Period | 2020-2034 |
| Base Year | 2025 |
| Estimated Year | 2026 |
| Forecast Period | 2026-2034 |
| Historical Period | 2020-2025 |
| Growth Rate | CAGR of 9.7% from 2020-2034 |
| Segmentation |
|
Table of Contents
- 1. Introduction
- 1.1. Research Scope
- 1.2. Market Segmentation
- 1.3. Research Objective
- 1.4. Definitions and Assumptions
- 2. Executive Summary
- 2.1. Market Snapshot
- 3. Market Dynamics
- 3.1. Market Drivers
- 3.2. Market Restrains
- 3.3. Market Trends
- 3.4. Market Opportunities
- 4. Market Factor Analysis
- 4.1. Porters Five Forces
- 4.1.1. Bargaining Power of Suppliers
- 4.1.2. Bargaining Power of Buyers
- 4.1.3. Threat of New Entrants
- 4.1.4. Threat of Substitutes
- 4.1.5. Competitive Rivalry
- 4.2. PESTEL analysis
- 4.3. BCG Analysis
- 4.3.1. Stars (High Growth, High Market Share)
- 4.3.2. Cash Cows (Low Growth, High Market Share)
- 4.3.3. Question Mark (High Growth, Low Market Share)
- 4.3.4. Dogs (Low Growth, Low Market Share)
- 4.4. Ansoff Matrix Analysis
- 4.5. Supply Chain Analysis
- 4.6. Regulatory Landscape
- 4.7. Current Market Potential and Opportunity Assessment (TAM–SAM–SOM Framework)
- 4.8. TIR Analyst Note
- 4.1. Porters Five Forces
- 5. Market Analysis, Insights and Forecast 2021-2033
- 5.1. Market Analysis, Insights and Forecast - by Application
- 5.1.1. Education Field
- 5.1.2. Business Field
- 5.1.3. Government Field
- 5.1.4. Household Field
- 5.1.5. Others
- 5.2. Market Analysis, Insights and Forecast - by Types
- 5.2.1. Interactive Whiteboards
- 5.2.2. Interactive Smartboards
- 5.3. Market Analysis, Insights and Forecast - by Region
- 5.3.1. North America
- 5.3.2. South America
- 5.3.3. Europe
- 5.3.4. Middle East & Africa
- 5.3.5. Asia Pacific
- 5.1. Market Analysis, Insights and Forecast - by Application
- 6. Global Interactive Whiteboards and Smartboards Analysis, Insights and Forecast, 2021-2033
- 6.1. Market Analysis, Insights and Forecast - by Application
- 6.1.1. Education Field
- 6.1.2. Business Field
- 6.1.3. Government Field
- 6.1.4. Household Field
- 6.1.5. Others
- 6.2. Market Analysis, Insights and Forecast - by Types
- 6.2.1. Interactive Whiteboards
- 6.2.2. Interactive Smartboards
- 6.1. Market Analysis, Insights and Forecast - by Application
- 7. North America Interactive Whiteboards and Smartboards Analysis, Insights and Forecast, 2020-2032
- 7.1. Market Analysis, Insights and Forecast - by Application
- 7.1.1. Education Field
- 7.1.2. Business Field
- 7.1.3. Government Field
- 7.1.4. Household Field
- 7.1.5. Others
- 7.2. Market Analysis, Insights and Forecast - by Types
- 7.2.1. Interactive Whiteboards
- 7.2.2. Interactive Smartboards
- 7.1. Market Analysis, Insights and Forecast - by Application
- 8. South America Interactive Whiteboards and Smartboards Analysis, Insights and Forecast, 2020-2032
- 8.1. Market Analysis, Insights and Forecast - by Application
- 8.1.1. Education Field
- 8.1.2. Business Field
- 8.1.3. Government Field
- 8.1.4. Household Field
- 8.1.5. Others
- 8.2. Market Analysis, Insights and Forecast - by Types
- 8.2.1. Interactive Whiteboards
- 8.2.2. Interactive Smartboards
- 8.1. Market Analysis, Insights and Forecast - by Application
- 9. Europe Interactive Whiteboards and Smartboards Analysis, Insights and Forecast, 2020-2032
- 9.1. Market Analysis, Insights and Forecast - by Application
- 9.1.1. Education Field
- 9.1.2. Business Field
- 9.1.3. Government Field
- 9.1.4. Household Field
- 9.1.5. Others
- 9.2. Market Analysis, Insights and Forecast - by Types
- 9.2.1. Interactive Whiteboards
- 9.2.2. Interactive Smartboards
- 9.1. Market Analysis, Insights and Forecast - by Application
- 10. Middle East & Africa Interactive Whiteboards and Smartboards Analysis, Insights and Forecast, 2020-2032
- 10.1. Market Analysis, Insights and Forecast - by Application
- 10.1.1. Education Field
- 10.1.2. Business Field
- 10.1.3. Government Field
- 10.1.4. Household Field
- 10.1.5. Others
- 10.2. Market Analysis, Insights and Forecast - by Types
- 10.2.1. Interactive Whiteboards
- 10.2.2. Interactive Smartboards
- 10.1. Market Analysis, Insights and Forecast - by Application
- 11. Asia Pacific Interactive Whiteboards and Smartboards Analysis, Insights and Forecast, 2020-2032
- 11.1. Market Analysis, Insights and Forecast - by Application
- 11.1.1. Education Field
- 11.1.2. Business Field
- 11.1.3. Government Field
- 11.1.4. Household Field
- 11.1.5. Others
- 11.2. Market Analysis, Insights and Forecast - by Types
- 11.2.1. Interactive Whiteboards
- 11.2.2. Interactive Smartboards
- 11.1. Market Analysis, Insights and Forecast - by Application
- 12. Competitive Analysis
- 12.1. Company Profiles
- 12.1.1 SMART Technologies (Foxconn)
- 12.1.1.1. Company Overview
- 12.1.1.2. Products
- 12.1.1.3. Company Financials
- 12.1.1.4. SWOT Analysis
- 12.1.2 Plus
- 12.1.2.1. Company Overview
- 12.1.2.2. Products
- 12.1.2.3. Company Financials
- 12.1.2.4. SWOT Analysis
- 12.1.3 Promethean
- 12.1.3.1. Company Overview
- 12.1.3.2. Products
- 12.1.3.3. Company Financials
- 12.1.3.4. SWOT Analysis
- 12.1.4 Turning Technologies
- 12.1.4.1. Company Overview
- 12.1.4.2. Products
- 12.1.4.3. Company Financials
- 12.1.4.4. SWOT Analysis
- 12.1.5 Sharp
- 12.1.5.1. Company Overview
- 12.1.5.2. Products
- 12.1.5.3. Company Financials
- 12.1.5.4. SWOT Analysis
- 12.1.6 Panasonic
- 12.1.6.1. Company Overview
- 12.1.6.2. Products
- 12.1.6.3. Company Financials
- 12.1.6.4. SWOT Analysis
- 12.1.7 Ricoh
- 12.1.7.1. Company Overview
- 12.1.7.2. Products
- 12.1.7.3. Company Financials
- 12.1.7.4. SWOT Analysis
- 12.1.8 Hitachi
- 12.1.8.1. Company Overview
- 12.1.8.2. Products
- 12.1.8.3. Company Financials
- 12.1.8.4. SWOT Analysis
- 12.1.9 Genee
- 12.1.9.1. Company Overview
- 12.1.9.2. Products
- 12.1.9.3. Company Financials
- 12.1.9.4. SWOT Analysis
- 12.1.10 Hitevision
- 12.1.10.1. Company Overview
- 12.1.10.2. Products
- 12.1.10.3. Company Financials
- 12.1.10.4. SWOT Analysis
- 12.1.11 CVTE
- 12.1.11.1. Company Overview
- 12.1.11.2. Products
- 12.1.11.3. Company Financials
- 12.1.11.4. SWOT Analysis
- 12.1.12 Changhong
- 12.1.12.1. Company Overview
- 12.1.12.2. Products
- 12.1.12.3. Company Financials
- 12.1.12.4. SWOT Analysis
- 12.1.13 Julong
- 12.1.13.1. Company Overview
- 12.1.13.2. Products
- 12.1.13.3. Company Financials
- 12.1.13.4. SWOT Analysis
- 12.1.14 Returnstar
- 12.1.14.1. Company Overview
- 12.1.14.2. Products
- 12.1.14.3. Company Financials
- 12.1.14.4. SWOT Analysis
- 12.1.15 Seewo
- 12.1.15.1. Company Overview
- 12.1.15.2. Products
- 12.1.15.3. Company Financials
- 12.1.15.4. SWOT Analysis
- 12.1.16 Skyworth
- 12.1.16.1. Company Overview
- 12.1.16.2. Products
- 12.1.16.3. Company Financials
- 12.1.16.4. SWOT Analysis
- 12.1.17 CreateView
- 12.1.17.1. Company Overview
- 12.1.17.2. Products
- 12.1.17.3. Company Financials
- 12.1.17.4. SWOT Analysis
- 12.1.18 MAXHUB
- 12.1.18.1. Company Overview
- 12.1.18.2. Products
- 12.1.18.3. Company Financials
- 12.1.18.4. SWOT Analysis
- 12.1.19 Horion
- 12.1.19.1. Company Overview
- 12.1.19.2. Products
- 12.1.19.3. Company Financials
- 12.1.19.4. SWOT Analysis
- 12.1.20 Hisense
- 12.1.20.1. Company Overview
- 12.1.20.2. Products
- 12.1.20.3. Company Financials
- 12.1.20.4. SWOT Analysis
- 12.1.21 Huawei
- 12.1.21.1. Company Overview
- 12.1.21.2. Products
- 12.1.21.3. Company Financials
- 12.1.21.4. SWOT Analysis
- 12.1.22 INTECH
- 12.1.22.1. Company Overview
- 12.1.22.2. Products
- 12.1.22.3. Company Financials
- 12.1.22.4. SWOT Analysis
- 12.1.23 Haiya
- 12.1.23.1. Company Overview
- 12.1.23.2. Products
- 12.1.23.3. Company Financials
- 12.1.23.4. SWOT Analysis
- 12.1.1 SMART Technologies (Foxconn)
- 12.2. Market Entropy
- 12.2.1 Company's Key Areas Served
- 12.2.2 Recent Developments
- 12.3. Company Market Share Analysis 2025
- 12.3.1 Top 5 Companies Market Share Analysis
- 12.3.2 Top 3 Companies Market Share Analysis
- 12.4. List of Potential Customers
- 13. Research Methodology
List of Figures
- Figure 1: Global Interactive Whiteboards and Smartboards Revenue Breakdown (billion, %) by Region 2025 & 2033
- Figure 2: North America Interactive Whiteboards and Smartboards Revenue (billion), by Application 2025 & 2033
- Figure 3: North America Interactive Whiteboards and Smartboards Revenue Share (%), by Application 2025 & 2033
- Figure 4: North America Interactive Whiteboards and Smartboards Revenue (billion), by Types 2025 & 2033
- Figure 5: North America Interactive Whiteboards and Smartboards Revenue Share (%), by Types 2025 & 2033
- Figure 6: North America Interactive Whiteboards and Smartboards Revenue (billion), by Country 2025 & 2033
- Figure 7: North America Interactive Whiteboards and Smartboards Revenue Share (%), by Country 2025 & 2033
- Figure 8: South America Interactive Whiteboards and Smartboards Revenue (billion), by Application 2025 & 2033
- Figure 9: South America Interactive Whiteboards and Smartboards Revenue Share (%), by Application 2025 & 2033
- Figure 10: South America Interactive Whiteboards and Smartboards Revenue (billion), by Types 2025 & 2033
- Figure 11: South America Interactive Whiteboards and Smartboards Revenue Share (%), by Types 2025 & 2033
- Figure 12: South America Interactive Whiteboards and Smartboards Revenue (billion), by Country 2025 & 2033
- Figure 13: South America Interactive Whiteboards and Smartboards Revenue Share (%), by Country 2025 & 2033
- Figure 14: Europe Interactive Whiteboards and Smartboards Revenue (billion), by Application 2025 & 2033
- Figure 15: Europe Interactive Whiteboards and Smartboards Revenue Share (%), by Application 2025 & 2033
- Figure 16: Europe Interactive Whiteboards and Smartboards Revenue (billion), by Types 2025 & 2033
- Figure 17: Europe Interactive Whiteboards and Smartboards Revenue Share (%), by Types 2025 & 2033
- Figure 18: Europe Interactive Whiteboards and Smartboards Revenue (billion), by Country 2025 & 2033
- Figure 19: Europe Interactive Whiteboards and Smartboards Revenue Share (%), by Country 2025 & 2033
- Figure 20: Middle East & Africa Interactive Whiteboards and Smartboards Revenue (billion), by Application 2025 & 2033
- Figure 21: Middle East & Africa Interactive Whiteboards and Smartboards Revenue Share (%), by Application 2025 & 2033
- Figure 22: Middle East & Africa Interactive Whiteboards and Smartboards Revenue (billion), by Types 2025 & 2033
- Figure 23: Middle East & Africa Interactive Whiteboards and Smartboards Revenue Share (%), by Types 2025 & 2033
- Figure 24: Middle East & Africa Interactive Whiteboards and Smartboards Revenue (billion), by Country 2025 & 2033
- Figure 25: Middle East & Africa Interactive Whiteboards and Smartboards Revenue Share (%), by Country 2025 & 2033
- Figure 26: Asia Pacific Interactive Whiteboards and Smartboards Revenue (billion), by Application 2025 & 2033
- Figure 27: Asia Pacific Interactive Whiteboards and Smartboards Revenue Share (%), by Application 2025 & 2033
- Figure 28: Asia Pacific Interactive Whiteboards and Smartboards Revenue (billion), by Types 2025 & 2033
- Figure 29: Asia Pacific Interactive Whiteboards and Smartboards Revenue Share (%), by Types 2025 & 2033
- Figure 30: Asia Pacific Interactive Whiteboards and Smartboards Revenue (billion), by Country 2025 & 2033
- Figure 31: Asia Pacific Interactive Whiteboards and Smartboards Revenue Share (%), by Country 2025 & 2033
List of Tables
- Table 1: Global Interactive Whiteboards and Smartboards Revenue billion Forecast, by Application 2020 & 2033
- Table 2: Global Interactive Whiteboards and Smartboards Revenue billion Forecast, by Types 2020 & 2033
- Table 3: Global Interactive Whiteboards and Smartboards Revenue billion Forecast, by Region 2020 & 2033
- Table 4: Global Interactive Whiteboards and Smartboards Revenue billion Forecast, by Application 2020 & 2033
- Table 5: Global Interactive Whiteboards and Smartboards Revenue billion Forecast, by Types 2020 & 2033
- Table 6: Global Interactive Whiteboards and Smartboards Revenue billion Forecast, by Country 2020 & 2033
- Table 7: United States Interactive Whiteboards and Smartboards Revenue (billion) Forecast, by Application 2020 & 2033
- Table 8: Canada Interactive Whiteboards and Smartboards Revenue (billion) Forecast, by Application 2020 & 2033
- Table 9: Mexico Interactive Whiteboards and Smartboards Revenue (billion) Forecast, by Application 2020 & 2033
- Table 10: Global Interactive Whiteboards and Smartboards Revenue billion Forecast, by Application 2020 & 2033
- Table 11: Global Interactive Whiteboards and Smartboards Revenue billion Forecast, by Types 2020 & 2033
- Table 12: Global Interactive Whiteboards and Smartboards Revenue billion Forecast, by Country 2020 & 2033
- Table 13: Brazil Interactive Whiteboards and Smartboards Revenue (billion) Forecast, by Application 2020 & 2033
- Table 14: Argentina Interactive Whiteboards and Smartboards Revenue (billion) Forecast, by Application 2020 & 2033
- Table 15: Rest of South America Interactive Whiteboards and Smartboards Revenue (billion) Forecast, by Application 2020 & 2033
- Table 16: Global Interactive Whiteboards and Smartboards Revenue billion Forecast, by Application 2020 & 2033
- Table 17: Global Interactive Whiteboards and Smartboards Revenue billion Forecast, by Types 2020 & 2033
- Table 18: Global Interactive Whiteboards and Smartboards Revenue billion Forecast, by Country 2020 & 2033
- Table 19: United Kingdom Interactive Whiteboards and Smartboards Revenue (billion) Forecast, by Application 2020 & 2033
- Table 20: Germany Interactive Whiteboards and Smartboards Revenue (billion) Forecast, by Application 2020 & 2033
- Table 21: France Interactive Whiteboards and Smartboards Revenue (billion) Forecast, by Application 2020 & 2033
- Table 22: Italy Interactive Whiteboards and Smartboards Revenue (billion) Forecast, by Application 2020 & 2033
- Table 23: Spain Interactive Whiteboards and Smartboards Revenue (billion) Forecast, by Application 2020 & 2033
- Table 24: Russia Interactive Whiteboards and Smartboards Revenue (billion) Forecast, by Application 2020 & 2033
- Table 25: Benelux Interactive Whiteboards and Smartboards Revenue (billion) Forecast, by Application 2020 & 2033
- Table 26: Nordics Interactive Whiteboards and Smartboards Revenue (billion) Forecast, by Application 2020 & 2033
- Table 27: Rest of Europe Interactive Whiteboards and Smartboards Revenue (billion) Forecast, by Application 2020 & 2033
- Table 28: Global Interactive Whiteboards and Smartboards Revenue billion Forecast, by Application 2020 & 2033
- Table 29: Global Interactive Whiteboards and Smartboards Revenue billion Forecast, by Types 2020 & 2033
- Table 30: Global Interactive Whiteboards and Smartboards Revenue billion Forecast, by Country 2020 & 2033
- Table 31: Turkey Interactive Whiteboards and Smartboards Revenue (billion) Forecast, by Application 2020 & 2033
- Table 32: Israel Interactive Whiteboards and Smartboards Revenue (billion) Forecast, by Application 2020 & 2033
- Table 33: GCC Interactive Whiteboards and Smartboards Revenue (billion) Forecast, by Application 2020 & 2033
- Table 34: North Africa Interactive Whiteboards and Smartboards Revenue (billion) Forecast, by Application 2020 & 2033
- Table 35: South Africa Interactive Whiteboards and Smartboards Revenue (billion) Forecast, by Application 2020 & 2033
- Table 36: Rest of Middle East & Africa Interactive Whiteboards and Smartboards Revenue (billion) Forecast, by Application 2020 & 2033
- Table 37: Global Interactive Whiteboards and Smartboards Revenue billion Forecast, by Application 2020 & 2033
- Table 38: Global Interactive Whiteboards and Smartboards Revenue billion Forecast, by Types 2020 & 2033
- Table 39: Global Interactive Whiteboards and Smartboards Revenue billion Forecast, by Country 2020 & 2033
- Table 40: China Interactive Whiteboards and Smartboards Revenue (billion) Forecast, by Application 2020 & 2033
- Table 41: India Interactive Whiteboards and Smartboards Revenue (billion) Forecast, by Application 2020 & 2033
- Table 42: Japan Interactive Whiteboards and Smartboards Revenue (billion) Forecast, by Application 2020 & 2033
- Table 43: South Korea Interactive Whiteboards and Smartboards Revenue (billion) Forecast, by Application 2020 & 2033
- Table 44: ASEAN Interactive Whiteboards and Smartboards Revenue (billion) Forecast, by Application 2020 & 2033
- Table 45: Oceania Interactive Whiteboards and Smartboards Revenue (billion) Forecast, by Application 2020 & 2033
- Table 46: Rest of Asia Pacific Interactive Whiteboards and Smartboards Revenue (billion) Forecast, by Application 2020 & 2033
Frequently Asked Questions
1. What is the projected Compound Annual Growth Rate (CAGR) of the Interactive Whiteboards and Smartboards?
The projected CAGR is approximately 9.7%.
2. Which companies are prominent players in the Interactive Whiteboards and Smartboards?
Key companies in the market include SMART Technologies (Foxconn), Plus, Promethean, Turning Technologies, Sharp, Panasonic, Ricoh, Hitachi, Genee, Hitevision, CVTE, Changhong, Julong, Returnstar, Seewo, Skyworth, CreateView, MAXHUB, Horion, Hisense, Huawei, INTECH, Haiya.
3. What are the main segments of the Interactive Whiteboards and Smartboards?
The market segments include Application, Types.
4. Can you provide details about the market size?
The market size is estimated to be USD 5.6 billion as of 2022.
5. What are some drivers contributing to market growth?
N/A
6. What are the notable trends driving market growth?
N/A
7. Are there any restraints impacting market growth?
N/A
8. Can you provide examples of recent developments in the market?
N/A
9. What pricing options are available for accessing the report?
Pricing options include single-user, multi-user, and enterprise licenses priced at USD 2900.00, USD 4350.00, and USD 5800.00 respectively.
10. Is the market size provided in terms of value or volume?
The market size is provided in terms of value, measured in billion.
11. Are there any specific market keywords associated with the report?
Yes, the market keyword associated with the report is "Interactive Whiteboards and Smartboards," which aids in identifying and referencing the specific market segment covered.
12. How do I determine which pricing option suits my needs best?
The pricing options vary based on user requirements and access needs. Individual users may opt for single-user licenses, while businesses requiring broader access may choose multi-user or enterprise licenses for cost-effective access to the report.
13. Are there any additional resources or data provided in the Interactive Whiteboards and Smartboards report?
While the report offers comprehensive insights, it's advisable to review the specific contents or supplementary materials provided to ascertain if additional resources or data are available.
14. How can I stay updated on further developments or reports in the Interactive Whiteboards and Smartboards?
To stay informed about further developments, trends, and reports in the Interactive Whiteboards and Smartboards, consider subscribing to industry newsletters, following relevant companies and organizations, or regularly checking reputable industry news sources and publications.
Methodology
Step 1 - Identification of Relevant Samples Size from Population Database


Step 2 - Approaches for Defining Global Market Size (Value, Volume* & Price*)

Note*: In applicable scenarios
Step 3 - Data Sources
Primary Research
- Web Analytics
- Survey Reports
- Research Institute
- Latest Research Reports
- Opinion Leaders
Secondary Research
- Annual Reports
- White Paper
- Latest Press Release
- Industry Association
- Paid Database
- Investor Presentations

Step 4 - Data Triangulation
Involves using different sources of information in order to increase the validity of a study
These sources are likely to be stakeholders in a program - participants, other researchers, program staff, other community members, and so on.
Then we put all data in single framework & apply various statistical tools to find out the dynamic on the market.
During the analysis stage, feedback from the stakeholder groups would be compared to determine areas of agreement as well as areas of divergence