

Key Insights
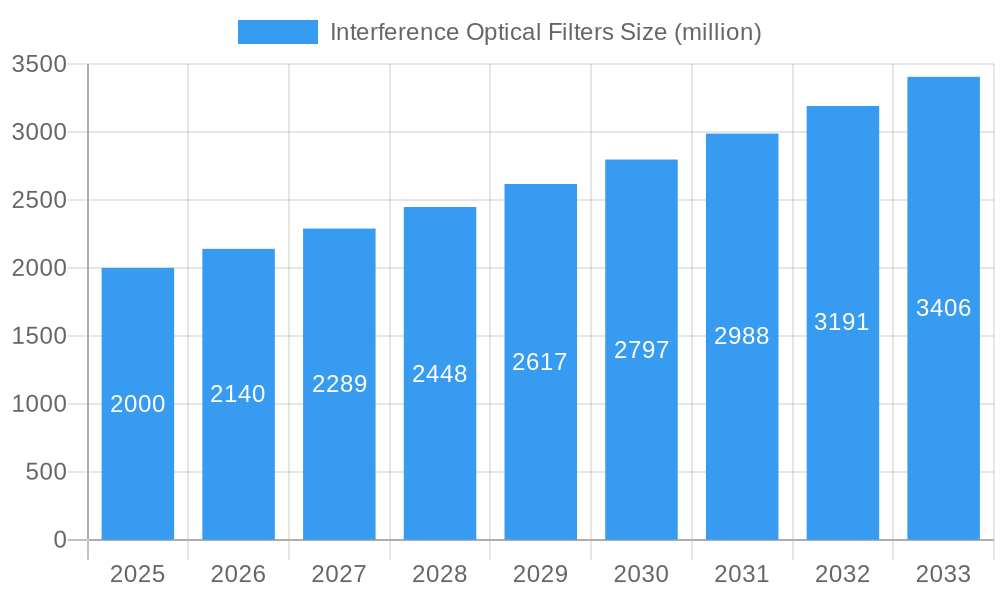
The global interference optical filter market is poised for significant expansion, propelled by escalating demand across critical sectors including telecommunications, life sciences, and environmental monitoring. Projected to reach $14.13 billion by 2025, the market is forecast to experience a Compound Annual Growth Rate (CAGR) of 8.48% from the base year 2025 through 2033. This growth trajectory is underpinned by several pivotal drivers. Technological advancements in filter design are yielding enhanced precision, superior spectral purity, and increased durability, thereby stimulating widespread adoption. Concurrently, the trend towards miniaturization in diverse applications necessitates compact and highly efficient filters, fostering innovation and market momentum. Substantial investments in research and development, particularly within spectral imaging and laser technologies, are also major contributors. Furthermore, the increasing integration of advanced analytical instrumentation in scientific research and industrial processes is amplifying market demand.
Interference Optical Filters Market Size (In Billion)
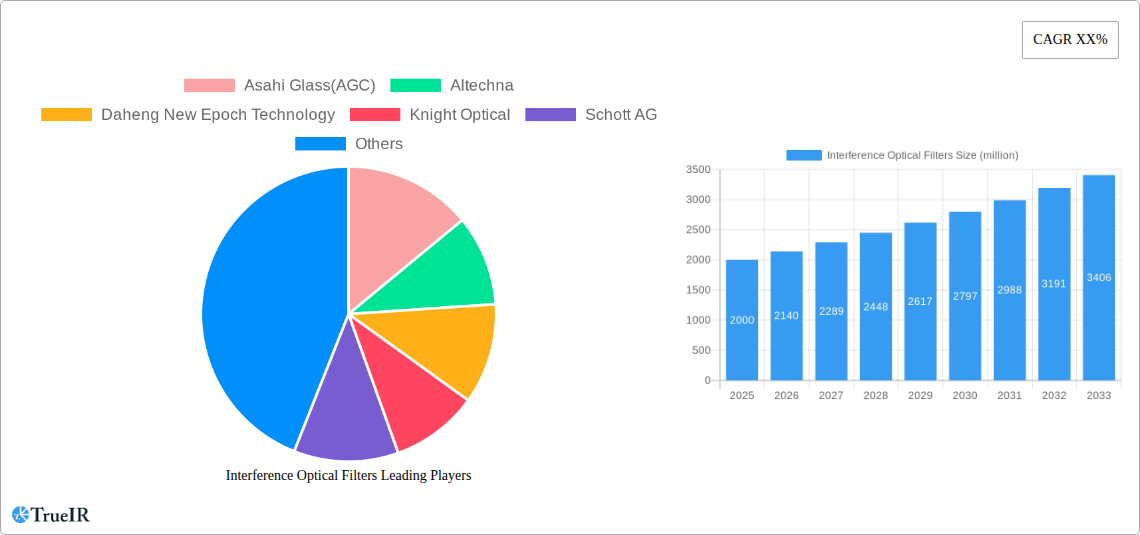
Leading market participants, including Asahi Glass (AGC), Schott AG, and HORIBA, are actively pursuing strategic initiatives focused on expanding their product offerings and global presence, reinforcing their competitive positions. Nevertheless, the market encounters certain challenges, such as the considerable manufacturing costs associated with advanced filters and the intricate design processes for customized solutions, which may present barriers to entry and adoption in specific segments. The market is also subject to volatility stemming from fluctuations in raw material prices and rapid technological evolution that could lead to the obsolescence of current technologies. Segment-wise, the market is characterized by diverse filter types, including bandpass, notch, longpass, and shortpass filters. Bandpass filters currently hold a dominant market share owing to their broad range of applications. Regionally, North America and Europe are expected to maintain substantial market shares, while the Asia-Pacific region is anticipated to exhibit the most dynamic growth potential.
Interference Optical Filters Company Market Share
Interference Optical Filters Market Report: A Comprehensive Analysis (2019-2033)
This dynamic report delivers a comprehensive analysis of the Interference Optical Filters market, projecting a market valuation exceeding $XX million by 2033. Leveraging extensive research across the historical period (2019-2024), base year (2025), and forecast period (2025-2033), this report provides invaluable insights for stakeholders seeking to navigate this rapidly evolving landscape. Key players such as Asahi Glass (AGC), Altechna, Daheng New Epoch Technology, Knight Optical, Schott AG, Alluxa, Chroma Technology Corporation, HORIBA, Ltd (Glen Spectra), Omega Optical, Spectrogon, Sydor Optics, and others are profiled, showcasing their strategies and market share within a total market exceeding $XX million in 2025.
Interference Optical Filters Market Structure & Competitive Landscape
The Interference Optical Filters market exhibits a moderately concentrated structure, with the top five players accounting for approximately XX% of the total market revenue in 2025. Innovation is a key driver, with companies continuously developing filters with enhanced performance characteristics, such as improved spectral selectivity and durability. Regulatory impacts, particularly those related to environmental concerns and safety standards, are significant. Product substitutes, such as dichroic mirrors and other filtering technologies, exert competitive pressure. The end-user segmentation is diverse, encompassing various industries, including medical, telecommunications, defense, and scientific research.
- Market Concentration: The Herfindahl-Hirschman Index (HHI) is estimated at XX in 2025, indicating a moderately concentrated market.
- M&A Activity: A total of XX M&A transactions were recorded in the interference optical filters sector between 2019 and 2024, valued at approximately $XX million. These deals primarily involved smaller companies being acquired by larger players seeking to expand their product portfolios and market reach.
- Innovation Drivers: Advancements in thin-film deposition techniques, such as atomic layer deposition (ALD) and magnetron sputtering, are driving the development of higher-performance interference filters.
- Regulatory Impacts: Stringent environmental regulations regarding the use of certain materials in filter production are shaping manufacturing processes and material selection.
Interference Optical Filters Market Trends & Opportunities
The Interference Optical Filters market is experiencing robust growth, with a projected Compound Annual Growth Rate (CAGR) of XX% during the forecast period (2025-2033). This growth is fueled by several factors, including increasing demand from diverse end-user segments, technological advancements leading to improved filter performance and cost reduction, and favorable government policies promoting the adoption of advanced optical technologies in specific sectors like telecommunications and medical equipment. Market penetration rates in emerging economies are expected to increase significantly, driven by rising disposable income and the adoption of advanced technologies. Competitive dynamics are intense, with companies focusing on product differentiation, strategic partnerships, and technological innovation to gain a competitive edge. The market size is expected to reach $XX million by 2033.
Dominant Markets & Segments in Interference Optical Filters
The North American region holds the largest market share in 2025, driven by strong demand from the medical and telecommunications sectors. Within North America, the United States is the leading market, driven by substantial investments in research and development.
- Key Growth Drivers in North America:
- Robust investment in R&D within the optical technology sector.
- Stringent regulatory frameworks supporting the adoption of advanced optical technologies.
- Strong demand from the healthcare industry for high-precision filters in medical imaging equipment.
- Large-scale adoption in the telecommunications sector for optical communication networks.
- Market Dominance: The dominance of North America stems from a combination of factors, including a mature technological base, robust regulatory frameworks that encourage innovation, and significant investments in research and development.
Asia-Pacific is expected to exhibit the fastest growth rate during the forecast period, driven by expanding applications in emerging economies and increasing government investments in infrastructure development.
Interference Optical Filters Product Analysis
Recent innovations focus on developing filters with enhanced spectral characteristics, broader bandwidths, and improved durability. These advancements have expanded the applications of interference filters across various industries, enabling more precise spectral selection and improved performance in imaging, sensing, and optical communication systems. Competitive advantages lie in achieving superior spectral performance, cost-effectiveness, and shorter manufacturing lead times. The market is witnessing the rise of customized filters designed to meet specific application requirements, further enhancing the competitive landscape.
Key Drivers, Barriers & Challenges in Interference Optical Filters
Key Drivers: Technological advancements in thin-film deposition, rising demand from emerging applications in areas like environmental monitoring and biomedical imaging, and government initiatives supporting the development of advanced optical technologies are key drivers for market growth.
Challenges & Restraints: The market faces challenges from stringent regulatory compliance requirements, fluctuations in raw material prices, and intense competition from both established players and new entrants. Supply chain disruptions also pose a significant risk, particularly considering the reliance on specific rare-earth elements in some filter manufacturing processes. These challenges can result in increased production costs, reduced profit margins and potential delays in project completion.
Growth Drivers in the Interference Optical Filters Market
The increasing demand for high-precision optical filters in various sectors like medical imaging, telecommunications, and environmental monitoring are primary drivers. Advancements in materials science and manufacturing techniques are leading to the development of more efficient and cost-effective filters. Government initiatives promoting technological advancements also contribute significantly to market growth.
Challenges Impacting Interference Optical Filters Growth
Significant challenges include fluctuations in raw material costs, stringent regulatory compliance requirements, and intense competition from alternative filtering technologies. Supply chain disruptions can lead to production delays and increased costs. These factors can impede market growth and negatively affect profitability.
Key Players Shaping the Interference Optical Filters Market
Significant Interference Optical Filters Industry Milestones
- 2020, Q4: Asahi Glass (AGC) announced the development of a new high-performance interference filter with improved durability and spectral selectivity.
- 2022, Q1: Altechna launched a new line of customized interference filters designed for specific applications in biomedical imaging.
- 2023, Q3: Chroma Technology Corporation acquired a smaller competitor, expanding its product portfolio and market share. (Further milestones would be added here for a complete report).
Future Outlook for Interference Optical Filters Market
The Interference Optical Filters market is poised for continued growth, driven by technological advancements, expanding applications, and rising demand across diverse sectors. Strategic partnerships and collaborations are likely to become more prevalent, leading to further innovation and market expansion. The market offers significant opportunities for players with a strong focus on research and development, efficient manufacturing capabilities, and effective market strategies. The demand for customized filters tailored to specific application requirements will also drive growth and segmentation within the market.
Interference Optical Filters Segmentation
-
1. Application
- 1.1. LIDAR
- 1.2. Sensor Processing
- 1.3. Free Space Communications
- 1.4. Others
-
2. Types
- 2.1. High-Pass Type
- 2.2. Low-Pass Type
- 2.3. Band-Pass Type
Interference Optical Filters Segmentation By Geography
-
1. North America
- 1.1. United States
- 1.2. Canada
- 1.3. Mexico
-
2. South America
- 2.1. Brazil
- 2.2. Argentina
- 2.3. Rest of South America
-
3. Europe
- 3.1. United Kingdom
- 3.2. Germany
- 3.3. France
- 3.4. Italy
- 3.5. Spain
- 3.6. Russia
- 3.7. Benelux
- 3.8. Nordics
- 3.9. Rest of Europe
-
4. Middle East & Africa
- 4.1. Turkey
- 4.2. Israel
- 4.3. GCC
- 4.4. North Africa
- 4.5. South Africa
- 4.6. Rest of Middle East & Africa
-
5. Asia Pacific
- 5.1. China
- 5.2. India
- 5.3. Japan
- 5.4. South Korea
- 5.5. ASEAN
- 5.6. Oceania
- 5.7. Rest of Asia Pacific

Interference Optical Filters Regional Market Share
Geographic Coverage of Interference Optical Filters
Interference Optical Filters REPORT HIGHLIGHTS
| Aspects | Details |
|---|---|
| Study Period | 2020-2034 |
| Base Year | 2025 |
| Estimated Year | 2026 |
| Forecast Period | 2026-2034 |
| Historical Period | 2020-2025 |
| Growth Rate | CAGR of 8.48% from 2020-2034 |
| Segmentation |
|
Table of Contents
- 1. Introduction
- 1.1. Research Scope
- 1.2. Market Segmentation
- 1.3. Research Objective
- 1.4. Definitions and Assumptions
- 2. Executive Summary
- 2.1. Market Snapshot
- 3. Market Dynamics
- 3.1. Market Drivers
- 3.2. Market Restrains
- 3.3. Market Trends
- 3.4. Market Opportunities
- 4. Market Factor Analysis
- 4.1. Porters Five Forces
- 4.1.1. Bargaining Power of Suppliers
- 4.1.2. Bargaining Power of Buyers
- 4.1.3. Threat of New Entrants
- 4.1.4. Threat of Substitutes
- 4.1.5. Competitive Rivalry
- 4.2. PESTEL analysis
- 4.3. BCG Analysis
- 4.3.1. Stars (High Growth, High Market Share)
- 4.3.2. Cash Cows (Low Growth, High Market Share)
- 4.3.3. Question Mark (High Growth, Low Market Share)
- 4.3.4. Dogs (Low Growth, Low Market Share)
- 4.4. Ansoff Matrix Analysis
- 4.5. Supply Chain Analysis
- 4.6. Regulatory Landscape
- 4.7. Current Market Potential and Opportunity Assessment (TAM–SAM–SOM Framework)
- 4.8. TIR Analyst Note
- 4.1. Porters Five Forces
- 5. Market Analysis, Insights and Forecast 2021-2033
- 5.1. Market Analysis, Insights and Forecast - by Application
- 5.1.1. LIDAR
- 5.1.2. Sensor Processing
- 5.1.3. Free Space Communications
- 5.1.4. Others
- 5.2. Market Analysis, Insights and Forecast - by Types
- 5.2.1. High-Pass Type
- 5.2.2. Low-Pass Type
- 5.2.3. Band-Pass Type
- 5.3. Market Analysis, Insights and Forecast - by Region
- 5.3.1. North America
- 5.3.2. South America
- 5.3.3. Europe
- 5.3.4. Middle East & Africa
- 5.3.5. Asia Pacific
- 5.1. Market Analysis, Insights and Forecast - by Application
- 6. Global Interference Optical Filters Analysis, Insights and Forecast, 2021-2033
- 6.1. Market Analysis, Insights and Forecast - by Application
- 6.1.1. LIDAR
- 6.1.2. Sensor Processing
- 6.1.3. Free Space Communications
- 6.1.4. Others
- 6.2. Market Analysis, Insights and Forecast - by Types
- 6.2.1. High-Pass Type
- 6.2.2. Low-Pass Type
- 6.2.3. Band-Pass Type
- 6.1. Market Analysis, Insights and Forecast - by Application
- 7. North America Interference Optical Filters Analysis, Insights and Forecast, 2020-2032
- 7.1. Market Analysis, Insights and Forecast - by Application
- 7.1.1. LIDAR
- 7.1.2. Sensor Processing
- 7.1.3. Free Space Communications
- 7.1.4. Others
- 7.2. Market Analysis, Insights and Forecast - by Types
- 7.2.1. High-Pass Type
- 7.2.2. Low-Pass Type
- 7.2.3. Band-Pass Type
- 7.1. Market Analysis, Insights and Forecast - by Application
- 8. South America Interference Optical Filters Analysis, Insights and Forecast, 2020-2032
- 8.1. Market Analysis, Insights and Forecast - by Application
- 8.1.1. LIDAR
- 8.1.2. Sensor Processing
- 8.1.3. Free Space Communications
- 8.1.4. Others
- 8.2. Market Analysis, Insights and Forecast - by Types
- 8.2.1. High-Pass Type
- 8.2.2. Low-Pass Type
- 8.2.3. Band-Pass Type
- 8.1. Market Analysis, Insights and Forecast - by Application
- 9. Europe Interference Optical Filters Analysis, Insights and Forecast, 2020-2032
- 9.1. Market Analysis, Insights and Forecast - by Application
- 9.1.1. LIDAR
- 9.1.2. Sensor Processing
- 9.1.3. Free Space Communications
- 9.1.4. Others
- 9.2. Market Analysis, Insights and Forecast - by Types
- 9.2.1. High-Pass Type
- 9.2.2. Low-Pass Type
- 9.2.3. Band-Pass Type
- 9.1. Market Analysis, Insights and Forecast - by Application
- 10. Middle East & Africa Interference Optical Filters Analysis, Insights and Forecast, 2020-2032
- 10.1. Market Analysis, Insights and Forecast - by Application
- 10.1.1. LIDAR
- 10.1.2. Sensor Processing
- 10.1.3. Free Space Communications
- 10.1.4. Others
- 10.2. Market Analysis, Insights and Forecast - by Types
- 10.2.1. High-Pass Type
- 10.2.2. Low-Pass Type
- 10.2.3. Band-Pass Type
- 10.1. Market Analysis, Insights and Forecast - by Application
- 11. Asia Pacific Interference Optical Filters Analysis, Insights and Forecast, 2020-2032
- 11.1. Market Analysis, Insights and Forecast - by Application
- 11.1.1. LIDAR
- 11.1.2. Sensor Processing
- 11.1.3. Free Space Communications
- 11.1.4. Others
- 11.2. Market Analysis, Insights and Forecast - by Types
- 11.2.1. High-Pass Type
- 11.2.2. Low-Pass Type
- 11.2.3. Band-Pass Type
- 11.1. Market Analysis, Insights and Forecast - by Application
- 12. Competitive Analysis
- 12.1. Company Profiles
- 12.1.1 Asahi Glass(AGC)
- 12.1.1.1. Company Overview
- 12.1.1.2. Products
- 12.1.1.3. Company Financials
- 12.1.1.4. SWOT Analysis
- 12.1.2 Altechna
- 12.1.2.1. Company Overview
- 12.1.2.2. Products
- 12.1.2.3. Company Financials
- 12.1.2.4. SWOT Analysis
- 12.1.3 Daheng New Epoch Technology
- 12.1.3.1. Company Overview
- 12.1.3.2. Products
- 12.1.3.3. Company Financials
- 12.1.3.4. SWOT Analysis
- 12.1.4 Knight Optical
- 12.1.4.1. Company Overview
- 12.1.4.2. Products
- 12.1.4.3. Company Financials
- 12.1.4.4. SWOT Analysis
- 12.1.5 Schott AG
- 12.1.5.1. Company Overview
- 12.1.5.2. Products
- 12.1.5.3. Company Financials
- 12.1.5.4. SWOT Analysis
- 12.1.6 Alluxa
- 12.1.6.1. Company Overview
- 12.1.6.2. Products
- 12.1.6.3. Company Financials
- 12.1.6.4. SWOT Analysis
- 12.1.7 Chroma Technology Corporation
- 12.1.7.1. Company Overview
- 12.1.7.2. Products
- 12.1.7.3. Company Financials
- 12.1.7.4. SWOT Analysis
- 12.1.8 HORIBA
- 12.1.8.1. Company Overview
- 12.1.8.2. Products
- 12.1.8.3. Company Financials
- 12.1.8.4. SWOT Analysis
- 12.1.9 Ltd (Glen Spectra)
- 12.1.9.1. Company Overview
- 12.1.9.2. Products
- 12.1.9.3. Company Financials
- 12.1.9.4. SWOT Analysis
- 12.1.10 Omega Optical
- 12.1.10.1. Company Overview
- 12.1.10.2. Products
- 12.1.10.3. Company Financials
- 12.1.10.4. SWOT Analysis
- 12.1.11 Spectrogon
- 12.1.11.1. Company Overview
- 12.1.11.2. Products
- 12.1.11.3. Company Financials
- 12.1.11.4. SWOT Analysis
- 12.1.12 Sydor Optics
- 12.1.12.1. Company Overview
- 12.1.12.2. Products
- 12.1.12.3. Company Financials
- 12.1.12.4. SWOT Analysis
- 12.1.1 Asahi Glass(AGC)
- 12.2. Market Entropy
- 12.2.1 Company's Key Areas Served
- 12.2.2 Recent Developments
- 12.3. Company Market Share Analysis 2025
- 12.3.1 Top 5 Companies Market Share Analysis
- 12.3.2 Top 3 Companies Market Share Analysis
- 12.4. List of Potential Customers
- 13. Research Methodology
List of Figures
- Figure 1: Global Interference Optical Filters Revenue Breakdown (billion, %) by Region 2025 & 2033
- Figure 2: North America Interference Optical Filters Revenue (billion), by Application 2025 & 2033
- Figure 3: North America Interference Optical Filters Revenue Share (%), by Application 2025 & 2033
- Figure 4: North America Interference Optical Filters Revenue (billion), by Types 2025 & 2033
- Figure 5: North America Interference Optical Filters Revenue Share (%), by Types 2025 & 2033
- Figure 6: North America Interference Optical Filters Revenue (billion), by Country 2025 & 2033
- Figure 7: North America Interference Optical Filters Revenue Share (%), by Country 2025 & 2033
- Figure 8: South America Interference Optical Filters Revenue (billion), by Application 2025 & 2033
- Figure 9: South America Interference Optical Filters Revenue Share (%), by Application 2025 & 2033
- Figure 10: South America Interference Optical Filters Revenue (billion), by Types 2025 & 2033
- Figure 11: South America Interference Optical Filters Revenue Share (%), by Types 2025 & 2033
- Figure 12: South America Interference Optical Filters Revenue (billion), by Country 2025 & 2033
- Figure 13: South America Interference Optical Filters Revenue Share (%), by Country 2025 & 2033
- Figure 14: Europe Interference Optical Filters Revenue (billion), by Application 2025 & 2033
- Figure 15: Europe Interference Optical Filters Revenue Share (%), by Application 2025 & 2033
- Figure 16: Europe Interference Optical Filters Revenue (billion), by Types 2025 & 2033
- Figure 17: Europe Interference Optical Filters Revenue Share (%), by Types 2025 & 2033
- Figure 18: Europe Interference Optical Filters Revenue (billion), by Country 2025 & 2033
- Figure 19: Europe Interference Optical Filters Revenue Share (%), by Country 2025 & 2033
- Figure 20: Middle East & Africa Interference Optical Filters Revenue (billion), by Application 2025 & 2033
- Figure 21: Middle East & Africa Interference Optical Filters Revenue Share (%), by Application 2025 & 2033
- Figure 22: Middle East & Africa Interference Optical Filters Revenue (billion), by Types 2025 & 2033
- Figure 23: Middle East & Africa Interference Optical Filters Revenue Share (%), by Types 2025 & 2033
- Figure 24: Middle East & Africa Interference Optical Filters Revenue (billion), by Country 2025 & 2033
- Figure 25: Middle East & Africa Interference Optical Filters Revenue Share (%), by Country 2025 & 2033
- Figure 26: Asia Pacific Interference Optical Filters Revenue (billion), by Application 2025 & 2033
- Figure 27: Asia Pacific Interference Optical Filters Revenue Share (%), by Application 2025 & 2033
- Figure 28: Asia Pacific Interference Optical Filters Revenue (billion), by Types 2025 & 2033
- Figure 29: Asia Pacific Interference Optical Filters Revenue Share (%), by Types 2025 & 2033
- Figure 30: Asia Pacific Interference Optical Filters Revenue (billion), by Country 2025 & 2033
- Figure 31: Asia Pacific Interference Optical Filters Revenue Share (%), by Country 2025 & 2033
List of Tables
- Table 1: Global Interference Optical Filters Revenue billion Forecast, by Application 2020 & 2033
- Table 2: Global Interference Optical Filters Revenue billion Forecast, by Types 2020 & 2033
- Table 3: Global Interference Optical Filters Revenue billion Forecast, by Region 2020 & 2033
- Table 4: Global Interference Optical Filters Revenue billion Forecast, by Application 2020 & 2033
- Table 5: Global Interference Optical Filters Revenue billion Forecast, by Types 2020 & 2033
- Table 6: Global Interference Optical Filters Revenue billion Forecast, by Country 2020 & 2033
- Table 7: United States Interference Optical Filters Revenue (billion) Forecast, by Application 2020 & 2033
- Table 8: Canada Interference Optical Filters Revenue (billion) Forecast, by Application 2020 & 2033
- Table 9: Mexico Interference Optical Filters Revenue (billion) Forecast, by Application 2020 & 2033
- Table 10: Global Interference Optical Filters Revenue billion Forecast, by Application 2020 & 2033
- Table 11: Global Interference Optical Filters Revenue billion Forecast, by Types 2020 & 2033
- Table 12: Global Interference Optical Filters Revenue billion Forecast, by Country 2020 & 2033
- Table 13: Brazil Interference Optical Filters Revenue (billion) Forecast, by Application 2020 & 2033
- Table 14: Argentina Interference Optical Filters Revenue (billion) Forecast, by Application 2020 & 2033
- Table 15: Rest of South America Interference Optical Filters Revenue (billion) Forecast, by Application 2020 & 2033
- Table 16: Global Interference Optical Filters Revenue billion Forecast, by Application 2020 & 2033
- Table 17: Global Interference Optical Filters Revenue billion Forecast, by Types 2020 & 2033
- Table 18: Global Interference Optical Filters Revenue billion Forecast, by Country 2020 & 2033
- Table 19: United Kingdom Interference Optical Filters Revenue (billion) Forecast, by Application 2020 & 2033
- Table 20: Germany Interference Optical Filters Revenue (billion) Forecast, by Application 2020 & 2033
- Table 21: France Interference Optical Filters Revenue (billion) Forecast, by Application 2020 & 2033
- Table 22: Italy Interference Optical Filters Revenue (billion) Forecast, by Application 2020 & 2033
- Table 23: Spain Interference Optical Filters Revenue (billion) Forecast, by Application 2020 & 2033
- Table 24: Russia Interference Optical Filters Revenue (billion) Forecast, by Application 2020 & 2033
- Table 25: Benelux Interference Optical Filters Revenue (billion) Forecast, by Application 2020 & 2033
- Table 26: Nordics Interference Optical Filters Revenue (billion) Forecast, by Application 2020 & 2033
- Table 27: Rest of Europe Interference Optical Filters Revenue (billion) Forecast, by Application 2020 & 2033
- Table 28: Global Interference Optical Filters Revenue billion Forecast, by Application 2020 & 2033
- Table 29: Global Interference Optical Filters Revenue billion Forecast, by Types 2020 & 2033
- Table 30: Global Interference Optical Filters Revenue billion Forecast, by Country 2020 & 2033
- Table 31: Turkey Interference Optical Filters Revenue (billion) Forecast, by Application 2020 & 2033
- Table 32: Israel Interference Optical Filters Revenue (billion) Forecast, by Application 2020 & 2033
- Table 33: GCC Interference Optical Filters Revenue (billion) Forecast, by Application 2020 & 2033
- Table 34: North Africa Interference Optical Filters Revenue (billion) Forecast, by Application 2020 & 2033
- Table 35: South Africa Interference Optical Filters Revenue (billion) Forecast, by Application 2020 & 2033
- Table 36: Rest of Middle East & Africa Interference Optical Filters Revenue (billion) Forecast, by Application 2020 & 2033
- Table 37: Global Interference Optical Filters Revenue billion Forecast, by Application 2020 & 2033
- Table 38: Global Interference Optical Filters Revenue billion Forecast, by Types 2020 & 2033
- Table 39: Global Interference Optical Filters Revenue billion Forecast, by Country 2020 & 2033
- Table 40: China Interference Optical Filters Revenue (billion) Forecast, by Application 2020 & 2033
- Table 41: India Interference Optical Filters Revenue (billion) Forecast, by Application 2020 & 2033
- Table 42: Japan Interference Optical Filters Revenue (billion) Forecast, by Application 2020 & 2033
- Table 43: South Korea Interference Optical Filters Revenue (billion) Forecast, by Application 2020 & 2033
- Table 44: ASEAN Interference Optical Filters Revenue (billion) Forecast, by Application 2020 & 2033
- Table 45: Oceania Interference Optical Filters Revenue (billion) Forecast, by Application 2020 & 2033
- Table 46: Rest of Asia Pacific Interference Optical Filters Revenue (billion) Forecast, by Application 2020 & 2033
Frequently Asked Questions
1. What is the projected Compound Annual Growth Rate (CAGR) of the Interference Optical Filters?
The projected CAGR is approximately 8.48%.
2. Which companies are prominent players in the Interference Optical Filters?
Key companies in the market include Asahi Glass(AGC), Altechna, Daheng New Epoch Technology, Knight Optical, Schott AG, Alluxa, Chroma Technology Corporation, HORIBA, Ltd (Glen Spectra), Omega Optical, Spectrogon, Sydor Optics.
3. What are the main segments of the Interference Optical Filters?
The market segments include Application, Types.
4. Can you provide details about the market size?
The market size is estimated to be USD 14.13 billion as of 2022.
5. What are some drivers contributing to market growth?
N/A
6. What are the notable trends driving market growth?
N/A
7. Are there any restraints impacting market growth?
N/A
8. Can you provide examples of recent developments in the market?
N/A
9. What pricing options are available for accessing the report?
Pricing options include single-user, multi-user, and enterprise licenses priced at USD 2900.00, USD 4350.00, and USD 5800.00 respectively.
10. Is the market size provided in terms of value or volume?
The market size is provided in terms of value, measured in billion.
11. Are there any specific market keywords associated with the report?
Yes, the market keyword associated with the report is "Interference Optical Filters," which aids in identifying and referencing the specific market segment covered.
12. How do I determine which pricing option suits my needs best?
The pricing options vary based on user requirements and access needs. Individual users may opt for single-user licenses, while businesses requiring broader access may choose multi-user or enterprise licenses for cost-effective access to the report.
13. Are there any additional resources or data provided in the Interference Optical Filters report?
While the report offers comprehensive insights, it's advisable to review the specific contents or supplementary materials provided to ascertain if additional resources or data are available.
14. How can I stay updated on further developments or reports in the Interference Optical Filters?
To stay informed about further developments, trends, and reports in the Interference Optical Filters, consider subscribing to industry newsletters, following relevant companies and organizations, or regularly checking reputable industry news sources and publications.
Methodology
Step 1 - Identification of Relevant Samples Size from Population Database


Step 2 - Approaches for Defining Global Market Size (Value, Volume* & Price*)

Note*: In applicable scenarios
Step 3 - Data Sources
Primary Research
- Web Analytics
- Survey Reports
- Research Institute
- Latest Research Reports
- Opinion Leaders
Secondary Research
- Annual Reports
- White Paper
- Latest Press Release
- Industry Association
- Paid Database
- Investor Presentations

Step 4 - Data Triangulation
Involves using different sources of information in order to increase the validity of a study
These sources are likely to be stakeholders in a program - participants, other researchers, program staff, other community members, and so on.
Then we put all data in single framework & apply various statistical tools to find out the dynamic on the market.
During the analysis stage, feedback from the stakeholder groups would be compared to determine areas of agreement as well as areas of divergence