

Key Insights
The liquid-cooled charging cable market is experiencing significant expansion, driven by the escalating demand for high-power electric vehicle (EV) charging solutions. The imperative for faster charging times and the capacity to manage considerably higher power outputs than conventional air-cooled cables are primary catalysts for this growth. The market's Compound Annual Growth Rate (CAGR) is projected at 15.5% from 2024 to 2033, signifying substantial growth potential. This expansion is predominantly fueled by the accelerating global adoption of EVs and the widespread deployment of high-power charging infrastructure to mitigate range anxiety and enable rapid charging.
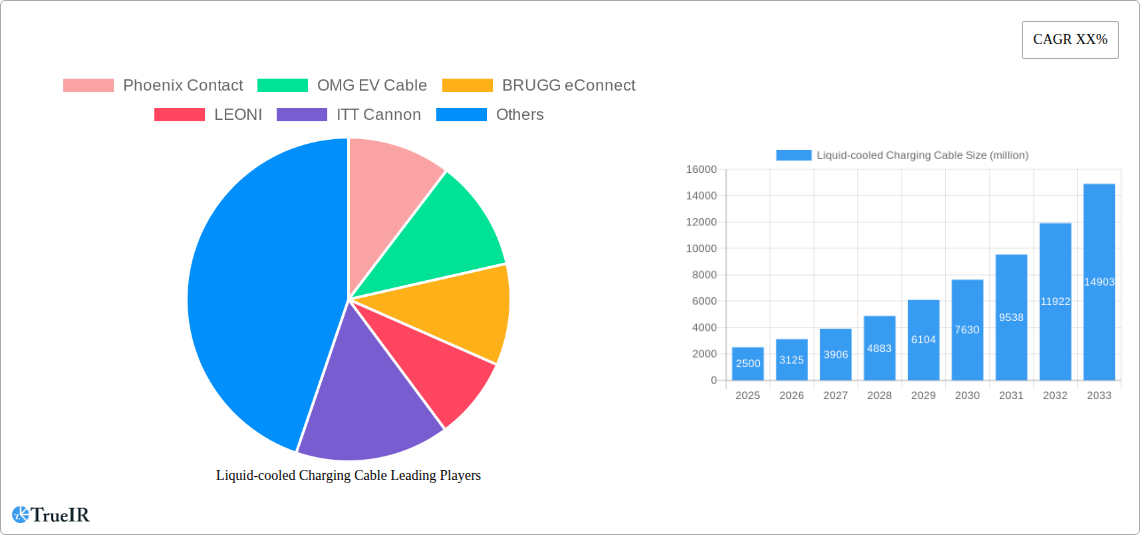
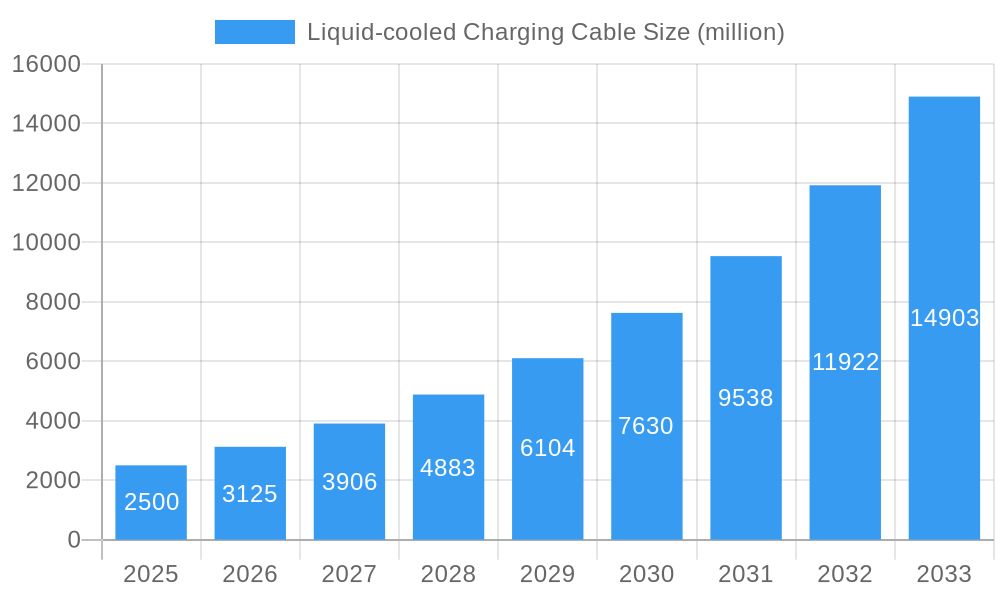
Liquid-cooled Charging Cable Market Size (In Billion)
Key industry players, including Phoenix Contact, ABB, and Tesla, are actively investing in research and development and broadening their product offerings to leverage this burgeoning market opportunity. Market segmentation encompasses cable types (AC vs. DC), voltage levels, and connector configurations. Regional dynamics are evident, with North America and Europe currently leading adoption, followed by Asia-Pacific, propelled by supportive government policies and rising EV sales. Nevertheless, challenges persist, notably the relatively high initial cost of liquid-cooled cables and the requirement for specialized installation expertise.
Liquid-cooled Charging Cable Company Market Share
The market size in 2024 is forecasted to be approximately $1.5 billion, derived from an analysis of related market segments and prevailing growth trends within the EV charging infrastructure sector. This valuation is anticipated to grow considerably throughout the forecast period, driven by factors such as increasing EV penetration, advancements in charging technology, and the global expansion of charging networks. Furthermore, technological innovations, including the development of more efficient and durable liquid-cooling systems, will contribute to sustained growth. Primary growth constraints are associated with infrastructure development and the cost of these specialized cables, though these are expected to diminish with economies of scale and technological progress. Growth will remain heavily influenced by governmental regulations, public charging infrastructure investments, and advancements in battery technology, which directly impact charging requirements.
Liquid-Cooled Charging Cable Market Report: A Comprehensive Analysis (2019-2033)
This comprehensive report provides a detailed analysis of the global liquid-cooled charging cable market, projecting a market value exceeding $XX million by 2033. The study covers the period from 2019 to 2033, with 2025 serving as both the base and estimated year. This in-depth examination leverages extensive market research to forecast market trends, identify key players, and analyze growth drivers and challenges within this rapidly evolving sector.
Liquid-cooled Charging Cable Market Structure & Competitive Landscape
The global liquid-cooled charging cable market is characterized by a moderately concentrated competitive landscape. While a few major players like Tesla, Aptiv, and LEONI hold significant market share, numerous smaller companies are actively participating, driving innovation and competition. The market concentration ratio (CR5) is estimated at XX%, indicating a relatively fragmented but consolidating market. Innovation is a key driver, with companies continually developing higher-power, more efficient, and durable liquid-cooled cables. Regulatory pressures, particularly regarding safety and standardization, influence market dynamics. Product substitutes, such as air-cooled cables, exist but offer inferior performance for high-power charging applications. The market is segmented primarily by end-user (e.g., electric vehicle manufacturers, charging station operators). M&A activity has been moderate in recent years, with approximately XX merger and acquisition deals recorded between 2019 and 2024, primarily focused on consolidating manufacturing capacity and expanding technological capabilities.
- Market Concentration: CR5 estimated at XX%
- Innovation Drivers: Higher power handling, improved efficiency, enhanced durability
- Regulatory Impacts: Safety standards, standardization efforts
- Product Substitutes: Air-cooled cables (limited market share for high-power applications)
- End-User Segmentation: Electric vehicle manufacturers, charging station operators
- M&A Trends: Approximately XX deals between 2019-2024
Liquid-cooled Charging Cable Market Trends & Opportunities
The global liquid-cooled charging cable market is experiencing robust growth, with a projected Compound Annual Growth Rate (CAGR) of XX% during the forecast period (2025-2033). This expansion is fueled by several factors, including the exponential rise in electric vehicle adoption worldwide, the increasing demand for fast charging infrastructure, and technological advancements enhancing cable efficiency and power handling capacity. Market penetration rates are expected to rise significantly, driven by the falling cost of electric vehicles and government incentives promoting EV adoption. The market is witnessing a shift toward higher-power charging solutions, demanding more advanced liquid-cooled cable technologies. Competitive dynamics are intense, with companies focusing on product differentiation, cost optimization, and strategic partnerships to secure market share. The market size is expected to reach $XX million by 2033, driven by increased demand for high-power charging infrastructure.
Dominant Markets & Segments in Liquid-cooled Charging Cable
The North American and European markets currently dominate the liquid-cooled charging cable market, driven by strong EV adoption rates and supportive government policies. China is experiencing rapid growth and is expected to become a major market in the coming years. Within segments, the high-power charging cable segment holds the largest market share and is expected to witness the fastest growth due to the increasing demand for rapid charging solutions.
- Key Growth Drivers (North America & Europe):
- Extensive EV adoption
- Favorable government policies (subsidies, tax credits)
- Well-developed charging infrastructure
- Key Growth Drivers (China):
- Rapidly expanding EV market
- Government initiatives promoting electric mobility
- Investments in charging infrastructure
- Dominant Segment: High-power charging cables
Liquid-cooled Charging Cable Product Analysis
Recent product innovations in liquid-cooled charging cables focus on maximizing power transfer efficiency, minimizing heat generation, and enhancing durability. These improvements involve advancements in materials science, utilizing novel conductors and insulating materials, resulting in lighter, more flexible, and more efficient cables. Key competitive advantages lie in superior power handling capacity, reduced energy losses, extended lifespan, and enhanced safety features. This aligns with market demands for faster and more reliable charging solutions.
Key Drivers, Barriers & Challenges in Liquid-cooled Charging Cable
Key Drivers: The primary drivers include the growing adoption of electric vehicles, the need for faster charging infrastructure, and advancements in liquid cooling technology leading to increased power handling capabilities. Government regulations promoting EV adoption further fuel this market.
Challenges: Supply chain disruptions, particularly regarding rare earth elements used in some cable components, pose a significant challenge. The high initial investment cost for liquid-cooled charging infrastructure can hinder market penetration. Stringent safety and regulatory compliance requirements also represent a barrier. Furthermore, intense competition and potential price wars among manufacturers can impact profitability.
Growth Drivers in the Liquid-cooled Charging Cable Market
The escalating demand for electric vehicles is the primary growth driver. Technological advancements, such as improved cooling systems and materials, also boost market expansion. Government incentives and supportive policies worldwide are crucial catalysts, along with the growing need for high-power fast-charging stations.
Challenges Impacting Liquid-cooled Charging Cable Growth
The main challenges include the high cost of production and installation, potential supply chain bottlenecks, and the need for strict safety regulations. Competition from alternative technologies and the availability of less expensive charging solutions also present difficulties.
Key Players Shaping the Liquid-cooled Charging Cable Market
- Phoenix Contact
- OMG EV Cable
- BRUGG eConnect
- LEONI
- ITT Cannon
- Huber+Suhner
- LS Cable
- Kempower
- Aein-cable
- Southwire
- Tesla
- Aptiv
- CPC
- Sumitomo
- Conductix
- BTC Power
Significant Liquid-cooled Charging Cable Industry Milestones
- 2020-Q4: Tesla introduces a new liquid-cooled charging cable with enhanced power handling capacity.
- 2021-Q2: Aptiv announces a strategic partnership to develop next-generation liquid-cooled charging solutions.
- 2022-Q3: Several major manufacturers announce investments in expanded production capacity for liquid-cooled cables.
- 2023-Q1: New safety standards for liquid-cooled charging cables are implemented in major markets.
Future Outlook for Liquid-cooled Charging Cable Market
The future of the liquid-cooled charging cable market looks exceptionally promising. Continued growth in electric vehicle sales, coupled with a global shift toward faster charging technologies, will drive significant market expansion. Strategic partnerships, technological advancements (such as improved materials and cooling methods), and increased investments in manufacturing capabilities will be key to future success. The market is poised for significant growth, with potential for disruption from innovative players and technologies.
Liquid-cooled Charging Cable Segmentation
-
1. Application
- 1.1. AC Charger
- 1.2. DC Charger
-
2. Types
- 2.1. Below 500KW
- 2.2. Above 500KW
Liquid-cooled Charging Cable Segmentation By Geography
-
1. North America
- 1.1. United States
- 1.2. Canada
- 1.3. Mexico
-
2. South America
- 2.1. Brazil
- 2.2. Argentina
- 2.3. Rest of South America
-
3. Europe
- 3.1. United Kingdom
- 3.2. Germany
- 3.3. France
- 3.4. Italy
- 3.5. Spain
- 3.6. Russia
- 3.7. Benelux
- 3.8. Nordics
- 3.9. Rest of Europe
-
4. Middle East & Africa
- 4.1. Turkey
- 4.2. Israel
- 4.3. GCC
- 4.4. North Africa
- 4.5. South Africa
- 4.6. Rest of Middle East & Africa
-
5. Asia Pacific
- 5.1. China
- 5.2. India
- 5.3. Japan
- 5.4. South Korea
- 5.5. ASEAN
- 5.6. Oceania
- 5.7. Rest of Asia Pacific

Liquid-cooled Charging Cable Regional Market Share
Geographic Coverage of Liquid-cooled Charging Cable
Liquid-cooled Charging Cable REPORT HIGHLIGHTS
| Aspects | Details |
|---|---|
| Study Period | 2020-2034 |
| Base Year | 2025 |
| Estimated Year | 2026 |
| Forecast Period | 2026-2034 |
| Historical Period | 2020-2025 |
| Growth Rate | CAGR of 15.5% from 2020-2034 |
| Segmentation |
|
Table of Contents
- 1. Introduction
- 1.1. Research Scope
- 1.2. Market Segmentation
- 1.3. Research Objective
- 1.4. Definitions and Assumptions
- 2. Executive Summary
- 2.1. Market Snapshot
- 3. Market Dynamics
- 3.1. Market Drivers
- 3.2. Market Restrains
- 3.3. Market Trends
- 3.4. Market Opportunities
- 4. Market Factor Analysis
- 4.1. Porters Five Forces
- 4.1.1. Bargaining Power of Suppliers
- 4.1.2. Bargaining Power of Buyers
- 4.1.3. Threat of New Entrants
- 4.1.4. Threat of Substitutes
- 4.1.5. Competitive Rivalry
- 4.2. PESTEL analysis
- 4.3. BCG Analysis
- 4.3.1. Stars (High Growth, High Market Share)
- 4.3.2. Cash Cows (Low Growth, High Market Share)
- 4.3.3. Question Mark (High Growth, Low Market Share)
- 4.3.4. Dogs (Low Growth, Low Market Share)
- 4.4. Ansoff Matrix Analysis
- 4.5. Supply Chain Analysis
- 4.6. Regulatory Landscape
- 4.7. Current Market Potential and Opportunity Assessment (TAM–SAM–SOM Framework)
- 4.8. TIR Analyst Note
- 4.1. Porters Five Forces
- 5. Market Analysis, Insights and Forecast 2021-2033
- 5.1. Market Analysis, Insights and Forecast - by Application
- 5.1.1. AC Charger
- 5.1.2. DC Charger
- 5.2. Market Analysis, Insights and Forecast - by Types
- 5.2.1. Below 500KW
- 5.2.2. Above 500KW
- 5.3. Market Analysis, Insights and Forecast - by Region
- 5.3.1. North America
- 5.3.2. South America
- 5.3.3. Europe
- 5.3.4. Middle East & Africa
- 5.3.5. Asia Pacific
- 5.1. Market Analysis, Insights and Forecast - by Application
- 6. Global Liquid-cooled Charging Cable Analysis, Insights and Forecast, 2021-2033
- 6.1. Market Analysis, Insights and Forecast - by Application
- 6.1.1. AC Charger
- 6.1.2. DC Charger
- 6.2. Market Analysis, Insights and Forecast - by Types
- 6.2.1. Below 500KW
- 6.2.2. Above 500KW
- 6.1. Market Analysis, Insights and Forecast - by Application
- 7. North America Liquid-cooled Charging Cable Analysis, Insights and Forecast, 2020-2032
- 7.1. Market Analysis, Insights and Forecast - by Application
- 7.1.1. AC Charger
- 7.1.2. DC Charger
- 7.2. Market Analysis, Insights and Forecast - by Types
- 7.2.1. Below 500KW
- 7.2.2. Above 500KW
- 7.1. Market Analysis, Insights and Forecast - by Application
- 8. South America Liquid-cooled Charging Cable Analysis, Insights and Forecast, 2020-2032
- 8.1. Market Analysis, Insights and Forecast - by Application
- 8.1.1. AC Charger
- 8.1.2. DC Charger
- 8.2. Market Analysis, Insights and Forecast - by Types
- 8.2.1. Below 500KW
- 8.2.2. Above 500KW
- 8.1. Market Analysis, Insights and Forecast - by Application
- 9. Europe Liquid-cooled Charging Cable Analysis, Insights and Forecast, 2020-2032
- 9.1. Market Analysis, Insights and Forecast - by Application
- 9.1.1. AC Charger
- 9.1.2. DC Charger
- 9.2. Market Analysis, Insights and Forecast - by Types
- 9.2.1. Below 500KW
- 9.2.2. Above 500KW
- 9.1. Market Analysis, Insights and Forecast - by Application
- 10. Middle East & Africa Liquid-cooled Charging Cable Analysis, Insights and Forecast, 2020-2032
- 10.1. Market Analysis, Insights and Forecast - by Application
- 10.1.1. AC Charger
- 10.1.2. DC Charger
- 10.2. Market Analysis, Insights and Forecast - by Types
- 10.2.1. Below 500KW
- 10.2.2. Above 500KW
- 10.1. Market Analysis, Insights and Forecast - by Application
- 11. Asia Pacific Liquid-cooled Charging Cable Analysis, Insights and Forecast, 2020-2032
- 11.1. Market Analysis, Insights and Forecast - by Application
- 11.1.1. AC Charger
- 11.1.2. DC Charger
- 11.2. Market Analysis, Insights and Forecast - by Types
- 11.2.1. Below 500KW
- 11.2.2. Above 500KW
- 11.1. Market Analysis, Insights and Forecast - by Application
- 12. Competitive Analysis
- 12.1. Company Profiles
- 12.1.1 Phoenix Contact
- 12.1.1.1. Company Overview
- 12.1.1.2. Products
- 12.1.1.3. Company Financials
- 12.1.1.4. SWOT Analysis
- 12.1.2 OMG EV Cable
- 12.1.2.1. Company Overview
- 12.1.2.2. Products
- 12.1.2.3. Company Financials
- 12.1.2.4. SWOT Analysis
- 12.1.3 BRUGG eConnect
- 12.1.3.1. Company Overview
- 12.1.3.2. Products
- 12.1.3.3. Company Financials
- 12.1.3.4. SWOT Analysis
- 12.1.4 LEONI
- 12.1.4.1. Company Overview
- 12.1.4.2. Products
- 12.1.4.3. Company Financials
- 12.1.4.4. SWOT Analysis
- 12.1.5 ITT Cannon
- 12.1.5.1. Company Overview
- 12.1.5.2. Products
- 12.1.5.3. Company Financials
- 12.1.5.4. SWOT Analysis
- 12.1.6 Huber+Suhner
- 12.1.6.1. Company Overview
- 12.1.6.2. Products
- 12.1.6.3. Company Financials
- 12.1.6.4. SWOT Analysis
- 12.1.7 LS Cable
- 12.1.7.1. Company Overview
- 12.1.7.2. Products
- 12.1.7.3. Company Financials
- 12.1.7.4. SWOT Analysis
- 12.1.8 Kempower
- 12.1.8.1. Company Overview
- 12.1.8.2. Products
- 12.1.8.3. Company Financials
- 12.1.8.4. SWOT Analysis
- 12.1.9 Aein-cable
- 12.1.9.1. Company Overview
- 12.1.9.2. Products
- 12.1.9.3. Company Financials
- 12.1.9.4. SWOT Analysis
- 12.1.10 Southwire
- 12.1.10.1. Company Overview
- 12.1.10.2. Products
- 12.1.10.3. Company Financials
- 12.1.10.4. SWOT Analysis
- 12.1.11 Tesla
- 12.1.11.1. Company Overview
- 12.1.11.2. Products
- 12.1.11.3. Company Financials
- 12.1.11.4. SWOT Analysis
- 12.1.12 Aptiv
- 12.1.12.1. Company Overview
- 12.1.12.2. Products
- 12.1.12.3. Company Financials
- 12.1.12.4. SWOT Analysis
- 12.1.13 CPC
- 12.1.13.1. Company Overview
- 12.1.13.2. Products
- 12.1.13.3. Company Financials
- 12.1.13.4. SWOT Analysis
- 12.1.14 Sumitomo
- 12.1.14.1. Company Overview
- 12.1.14.2. Products
- 12.1.14.3. Company Financials
- 12.1.14.4. SWOT Analysis
- 12.1.15 Conductix
- 12.1.15.1. Company Overview
- 12.1.15.2. Products
- 12.1.15.3. Company Financials
- 12.1.15.4. SWOT Analysis
- 12.1.16 BTC Power
- 12.1.16.1. Company Overview
- 12.1.16.2. Products
- 12.1.16.3. Company Financials
- 12.1.16.4. SWOT Analysis
- 12.1.1 Phoenix Contact
- 12.2. Market Entropy
- 12.2.1 Company's Key Areas Served
- 12.2.2 Recent Developments
- 12.3. Company Market Share Analysis 2025
- 12.3.1 Top 5 Companies Market Share Analysis
- 12.3.2 Top 3 Companies Market Share Analysis
- 12.4. List of Potential Customers
- 13. Research Methodology
List of Figures
- Figure 1: Global Liquid-cooled Charging Cable Revenue Breakdown (billion, %) by Region 2025 & 2033
- Figure 2: North America Liquid-cooled Charging Cable Revenue (billion), by Application 2025 & 2033
- Figure 3: North America Liquid-cooled Charging Cable Revenue Share (%), by Application 2025 & 2033
- Figure 4: North America Liquid-cooled Charging Cable Revenue (billion), by Types 2025 & 2033
- Figure 5: North America Liquid-cooled Charging Cable Revenue Share (%), by Types 2025 & 2033
- Figure 6: North America Liquid-cooled Charging Cable Revenue (billion), by Country 2025 & 2033
- Figure 7: North America Liquid-cooled Charging Cable Revenue Share (%), by Country 2025 & 2033
- Figure 8: South America Liquid-cooled Charging Cable Revenue (billion), by Application 2025 & 2033
- Figure 9: South America Liquid-cooled Charging Cable Revenue Share (%), by Application 2025 & 2033
- Figure 10: South America Liquid-cooled Charging Cable Revenue (billion), by Types 2025 & 2033
- Figure 11: South America Liquid-cooled Charging Cable Revenue Share (%), by Types 2025 & 2033
- Figure 12: South America Liquid-cooled Charging Cable Revenue (billion), by Country 2025 & 2033
- Figure 13: South America Liquid-cooled Charging Cable Revenue Share (%), by Country 2025 & 2033
- Figure 14: Europe Liquid-cooled Charging Cable Revenue (billion), by Application 2025 & 2033
- Figure 15: Europe Liquid-cooled Charging Cable Revenue Share (%), by Application 2025 & 2033
- Figure 16: Europe Liquid-cooled Charging Cable Revenue (billion), by Types 2025 & 2033
- Figure 17: Europe Liquid-cooled Charging Cable Revenue Share (%), by Types 2025 & 2033
- Figure 18: Europe Liquid-cooled Charging Cable Revenue (billion), by Country 2025 & 2033
- Figure 19: Europe Liquid-cooled Charging Cable Revenue Share (%), by Country 2025 & 2033
- Figure 20: Middle East & Africa Liquid-cooled Charging Cable Revenue (billion), by Application 2025 & 2033
- Figure 21: Middle East & Africa Liquid-cooled Charging Cable Revenue Share (%), by Application 2025 & 2033
- Figure 22: Middle East & Africa Liquid-cooled Charging Cable Revenue (billion), by Types 2025 & 2033
- Figure 23: Middle East & Africa Liquid-cooled Charging Cable Revenue Share (%), by Types 2025 & 2033
- Figure 24: Middle East & Africa Liquid-cooled Charging Cable Revenue (billion), by Country 2025 & 2033
- Figure 25: Middle East & Africa Liquid-cooled Charging Cable Revenue Share (%), by Country 2025 & 2033
- Figure 26: Asia Pacific Liquid-cooled Charging Cable Revenue (billion), by Application 2025 & 2033
- Figure 27: Asia Pacific Liquid-cooled Charging Cable Revenue Share (%), by Application 2025 & 2033
- Figure 28: Asia Pacific Liquid-cooled Charging Cable Revenue (billion), by Types 2025 & 2033
- Figure 29: Asia Pacific Liquid-cooled Charging Cable Revenue Share (%), by Types 2025 & 2033
- Figure 30: Asia Pacific Liquid-cooled Charging Cable Revenue (billion), by Country 2025 & 2033
- Figure 31: Asia Pacific Liquid-cooled Charging Cable Revenue Share (%), by Country 2025 & 2033
List of Tables
- Table 1: Global Liquid-cooled Charging Cable Revenue billion Forecast, by Application 2020 & 2033
- Table 2: Global Liquid-cooled Charging Cable Revenue billion Forecast, by Types 2020 & 2033
- Table 3: Global Liquid-cooled Charging Cable Revenue billion Forecast, by Region 2020 & 2033
- Table 4: Global Liquid-cooled Charging Cable Revenue billion Forecast, by Application 2020 & 2033
- Table 5: Global Liquid-cooled Charging Cable Revenue billion Forecast, by Types 2020 & 2033
- Table 6: Global Liquid-cooled Charging Cable Revenue billion Forecast, by Country 2020 & 2033
- Table 7: United States Liquid-cooled Charging Cable Revenue (billion) Forecast, by Application 2020 & 2033
- Table 8: Canada Liquid-cooled Charging Cable Revenue (billion) Forecast, by Application 2020 & 2033
- Table 9: Mexico Liquid-cooled Charging Cable Revenue (billion) Forecast, by Application 2020 & 2033
- Table 10: Global Liquid-cooled Charging Cable Revenue billion Forecast, by Application 2020 & 2033
- Table 11: Global Liquid-cooled Charging Cable Revenue billion Forecast, by Types 2020 & 2033
- Table 12: Global Liquid-cooled Charging Cable Revenue billion Forecast, by Country 2020 & 2033
- Table 13: Brazil Liquid-cooled Charging Cable Revenue (billion) Forecast, by Application 2020 & 2033
- Table 14: Argentina Liquid-cooled Charging Cable Revenue (billion) Forecast, by Application 2020 & 2033
- Table 15: Rest of South America Liquid-cooled Charging Cable Revenue (billion) Forecast, by Application 2020 & 2033
- Table 16: Global Liquid-cooled Charging Cable Revenue billion Forecast, by Application 2020 & 2033
- Table 17: Global Liquid-cooled Charging Cable Revenue billion Forecast, by Types 2020 & 2033
- Table 18: Global Liquid-cooled Charging Cable Revenue billion Forecast, by Country 2020 & 2033
- Table 19: United Kingdom Liquid-cooled Charging Cable Revenue (billion) Forecast, by Application 2020 & 2033
- Table 20: Germany Liquid-cooled Charging Cable Revenue (billion) Forecast, by Application 2020 & 2033
- Table 21: France Liquid-cooled Charging Cable Revenue (billion) Forecast, by Application 2020 & 2033
- Table 22: Italy Liquid-cooled Charging Cable Revenue (billion) Forecast, by Application 2020 & 2033
- Table 23: Spain Liquid-cooled Charging Cable Revenue (billion) Forecast, by Application 2020 & 2033
- Table 24: Russia Liquid-cooled Charging Cable Revenue (billion) Forecast, by Application 2020 & 2033
- Table 25: Benelux Liquid-cooled Charging Cable Revenue (billion) Forecast, by Application 2020 & 2033
- Table 26: Nordics Liquid-cooled Charging Cable Revenue (billion) Forecast, by Application 2020 & 2033
- Table 27: Rest of Europe Liquid-cooled Charging Cable Revenue (billion) Forecast, by Application 2020 & 2033
- Table 28: Global Liquid-cooled Charging Cable Revenue billion Forecast, by Application 2020 & 2033
- Table 29: Global Liquid-cooled Charging Cable Revenue billion Forecast, by Types 2020 & 2033
- Table 30: Global Liquid-cooled Charging Cable Revenue billion Forecast, by Country 2020 & 2033
- Table 31: Turkey Liquid-cooled Charging Cable Revenue (billion) Forecast, by Application 2020 & 2033
- Table 32: Israel Liquid-cooled Charging Cable Revenue (billion) Forecast, by Application 2020 & 2033
- Table 33: GCC Liquid-cooled Charging Cable Revenue (billion) Forecast, by Application 2020 & 2033
- Table 34: North Africa Liquid-cooled Charging Cable Revenue (billion) Forecast, by Application 2020 & 2033
- Table 35: South Africa Liquid-cooled Charging Cable Revenue (billion) Forecast, by Application 2020 & 2033
- Table 36: Rest of Middle East & Africa Liquid-cooled Charging Cable Revenue (billion) Forecast, by Application 2020 & 2033
- Table 37: Global Liquid-cooled Charging Cable Revenue billion Forecast, by Application 2020 & 2033
- Table 38: Global Liquid-cooled Charging Cable Revenue billion Forecast, by Types 2020 & 2033
- Table 39: Global Liquid-cooled Charging Cable Revenue billion Forecast, by Country 2020 & 2033
- Table 40: China Liquid-cooled Charging Cable Revenue (billion) Forecast, by Application 2020 & 2033
- Table 41: India Liquid-cooled Charging Cable Revenue (billion) Forecast, by Application 2020 & 2033
- Table 42: Japan Liquid-cooled Charging Cable Revenue (billion) Forecast, by Application 2020 & 2033
- Table 43: South Korea Liquid-cooled Charging Cable Revenue (billion) Forecast, by Application 2020 & 2033
- Table 44: ASEAN Liquid-cooled Charging Cable Revenue (billion) Forecast, by Application 2020 & 2033
- Table 45: Oceania Liquid-cooled Charging Cable Revenue (billion) Forecast, by Application 2020 & 2033
- Table 46: Rest of Asia Pacific Liquid-cooled Charging Cable Revenue (billion) Forecast, by Application 2020 & 2033
Frequently Asked Questions
1. What is the projected Compound Annual Growth Rate (CAGR) of the Liquid-cooled Charging Cable?
The projected CAGR is approximately 15.5%.
2. Which companies are prominent players in the Liquid-cooled Charging Cable?
Key companies in the market include Phoenix Contact, OMG EV Cable, BRUGG eConnect, LEONI, ITT Cannon, Huber+Suhner, LS Cable, Kempower, Aein-cable, Southwire, Tesla, Aptiv, CPC, Sumitomo, Conductix, BTC Power.
3. What are the main segments of the Liquid-cooled Charging Cable?
The market segments include Application, Types.
4. Can you provide details about the market size?
The market size is estimated to be USD 1.5 billion as of 2022.
5. What are some drivers contributing to market growth?
N/A
6. What are the notable trends driving market growth?
N/A
7. Are there any restraints impacting market growth?
N/A
8. Can you provide examples of recent developments in the market?
N/A
9. What pricing options are available for accessing the report?
Pricing options include single-user, multi-user, and enterprise licenses priced at USD 2900.00, USD 4350.00, and USD 5800.00 respectively.
10. Is the market size provided in terms of value or volume?
The market size is provided in terms of value, measured in billion.
11. Are there any specific market keywords associated with the report?
Yes, the market keyword associated with the report is "Liquid-cooled Charging Cable," which aids in identifying and referencing the specific market segment covered.
12. How do I determine which pricing option suits my needs best?
The pricing options vary based on user requirements and access needs. Individual users may opt for single-user licenses, while businesses requiring broader access may choose multi-user or enterprise licenses for cost-effective access to the report.
13. Are there any additional resources or data provided in the Liquid-cooled Charging Cable report?
While the report offers comprehensive insights, it's advisable to review the specific contents or supplementary materials provided to ascertain if additional resources or data are available.
14. How can I stay updated on further developments or reports in the Liquid-cooled Charging Cable?
To stay informed about further developments, trends, and reports in the Liquid-cooled Charging Cable, consider subscribing to industry newsletters, following relevant companies and organizations, or regularly checking reputable industry news sources and publications.
Methodology
Step 1 - Identification of Relevant Samples Size from Population Database


Step 2 - Approaches for Defining Global Market Size (Value, Volume* & Price*)

Note*: In applicable scenarios
Step 3 - Data Sources
Primary Research
- Web Analytics
- Survey Reports
- Research Institute
- Latest Research Reports
- Opinion Leaders
Secondary Research
- Annual Reports
- White Paper
- Latest Press Release
- Industry Association
- Paid Database
- Investor Presentations

Step 4 - Data Triangulation
Involves using different sources of information in order to increase the validity of a study
These sources are likely to be stakeholders in a program - participants, other researchers, program staff, other community members, and so on.
Then we put all data in single framework & apply various statistical tools to find out the dynamic on the market.
During the analysis stage, feedback from the stakeholder groups would be compared to determine areas of agreement as well as areas of divergence