

Key Insights
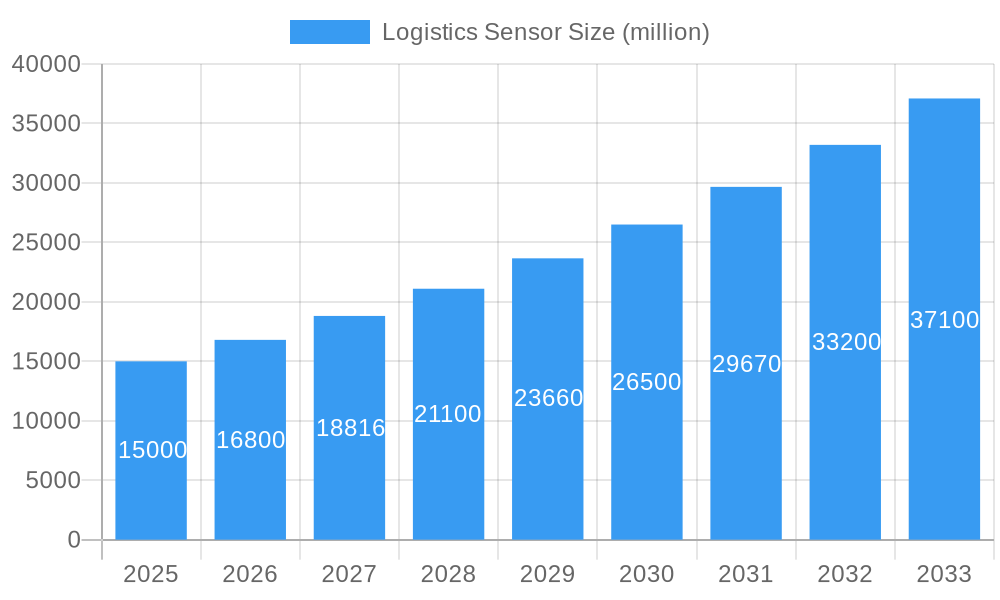
The global logistics sensor market is poised for substantial expansion, driven by the imperative for real-time supply chain visibility and operational efficiency. The market, estimated at $9.02 billion in the 2025 base year, is forecasted to grow at a Compound Annual Growth Rate (CAGR) of 5.4% through 2033. Key growth drivers include the escalating adoption of IoT and smart logistics, the demand for enhanced inventory management to minimize losses, and the burgeoning e-commerce sector's need for faster, more dependable deliveries. Technological advancements, resulting in more compact, energy-efficient, and cost-effective sensors, are also facilitating broader implementation in temperature monitoring, location tracking, and in-transit goods condition monitoring.
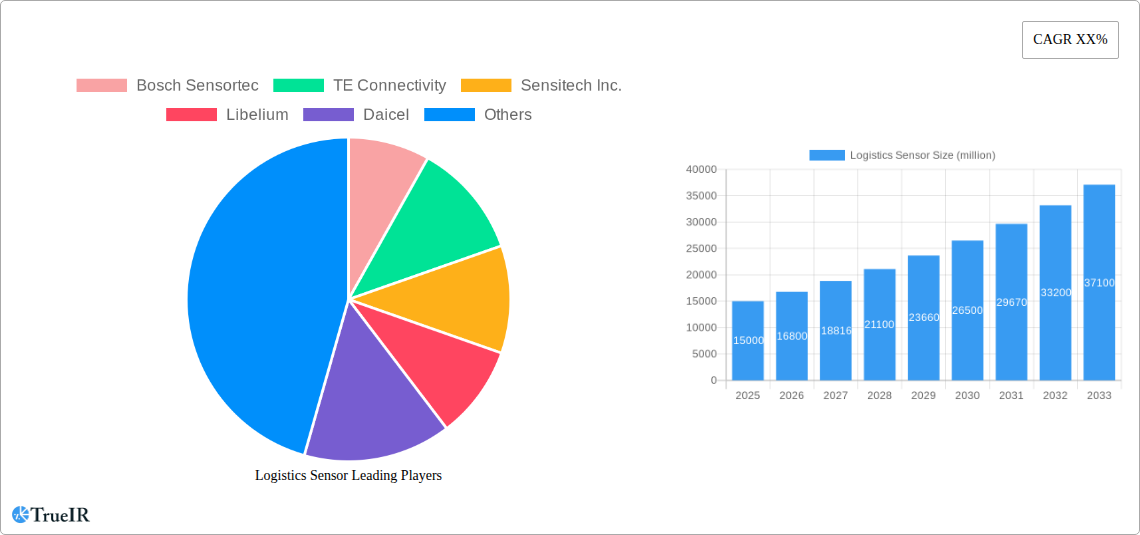
Logistics Sensor Market Size (In Billion)
Leading companies such as Bosch Sensortec, TE Connectivity, and Honeywell are instrumental in market growth through innovation and strategic alliances. However, challenges such as high initial deployment costs, data security concerns, and the necessity for robust communication infrastructure persist. Notwithstanding these obstacles, the logistics sensor market presents exceptionally positive long-term prospects, propelled by the ongoing digitalization of logistics and the heightened emphasis on supply chain resilience. Market segments encompass diverse sensor types, application areas (including cold chain logistics, freight tracking, and warehouse management), and deployment scenarios (fixed and mobile).
Logistics Sensor Company Market Share
Logistics Sensor Market Report: A Comprehensive Analysis 2019-2033
This dynamic report provides a comprehensive analysis of the global Logistics Sensor market, projecting a robust growth trajectory fueled by technological advancements and increasing demand across diverse industries. The study period covers 2019-2033, with 2025 as the base and estimated year. The forecast period spans 2025-2033, and the historical period encompasses 2019-2024. This in-depth analysis leverages millions of data points to deliver actionable insights for businesses operating in this rapidly evolving sector. The report's detailed segmentation and analysis of key players equip stakeholders with the knowledge necessary to navigate this exciting landscape.
Logistics Sensor Market Structure & Competitive Landscape
The global logistics sensor market is characterized by a moderately concentrated structure, with several major players commanding significant market share. The market concentration ratio (CR4) is estimated at 35% in 2025, indicating the presence of both established giants and emerging competitors. Innovation in sensor technology, particularly in miniaturization, power efficiency, and data analytics capabilities, drives considerable market growth. Stringent regulatory compliance requirements regarding data security and transportation safety significantly influence market dynamics. Substitutes, such as traditional manual tracking methods, are gradually losing ground due to the superior efficiency and cost-effectiveness of sensor-based solutions. End-user segmentation across various industries like transportation, warehousing, and retail fuels market growth, with varied demand levels across each segment.
- Key Players: Bosch Sensortec, TE Connectivity, Sensitech Inc., Libelium, Daicel, Datalogic S.p.A., Honeywell, Ingersoll Rand, Schneider Electric, Emerson, Sick, Hanwei Electronics Group Corporation, Shanghai Lanbao Sensing Technology Co., Ltd., Huagong Tech Company Limited.
- Market Concentration: CR4 estimated at 35% in 2025, with a projected increase to 40% by 2033.
- M&A Activity: An average of xx M&A deals annually were observed during the historical period (2019-2024), driven by companies seeking to expand their product portfolios and geographic reach.
- Regulatory Impact: Stringent data privacy regulations and increasing emphasis on supply chain transparency are shaping market developments.
Logistics Sensor Market Trends & Opportunities
The global logistics sensor market is poised for substantial growth, with a projected Compound Annual Growth Rate (CAGR) of xx% during the forecast period (2025-2033). This growth is driven by the increasing adoption of IoT technologies, the need for real-time visibility in supply chains, and the rising demand for improved efficiency and reduced costs in logistics operations. Market penetration rates are expected to increase significantly, driven by the increasing affordability of sensor technologies and the rising awareness of their benefits among logistics companies. Key technological shifts include the adoption of advanced sensor types like LiDAR and RFID, coupled with improvements in data analytics capabilities allowing for predictive maintenance and optimized route planning. Consumer preferences are shifting toward increased transparency and traceability in the supply chain, leading to higher demand for reliable and accurate sensor data. Competitive dynamics are shaped by continuous innovation and strategic partnerships between sensor manufacturers and logistics service providers. The market size is estimated to reach $xx million by 2033.
Dominant Markets & Segments in Logistics Sensor
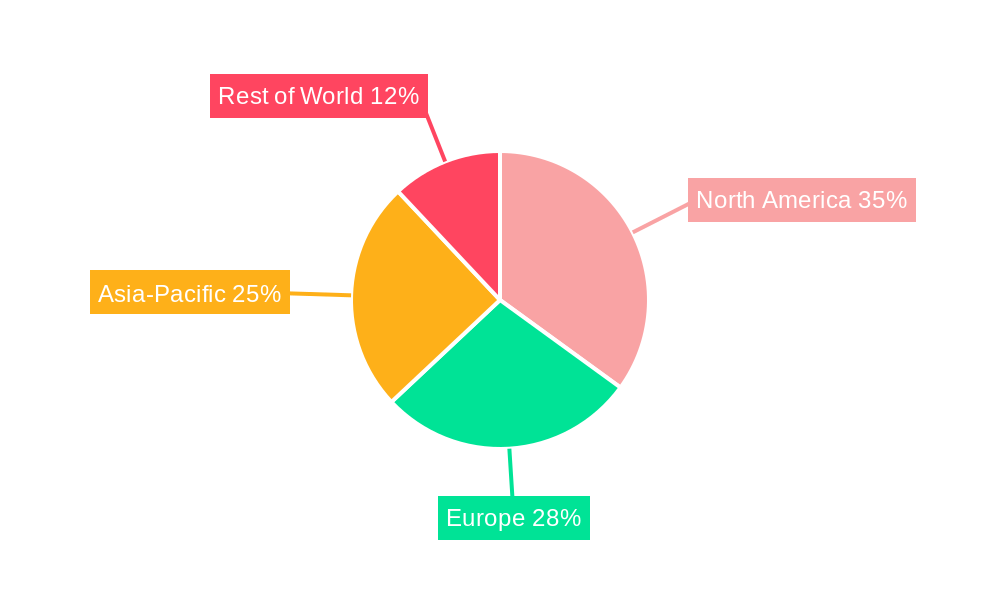
The North American market currently holds the largest share of the global logistics sensor market, primarily due to the region's advanced logistics infrastructure, high adoption of automation technologies, and stringent regulatory environment. However, the Asia-Pacific region is expected to witness the highest growth rate during the forecast period, driven by rapid industrialization, expanding e-commerce sector, and supportive government policies.
- Key Growth Drivers in North America: Advanced logistics infrastructure, high technological adoption rates, and stringent regulatory frameworks promoting safety and efficiency.
- Key Growth Drivers in Asia-Pacific: Rapid industrialization, burgeoning e-commerce market, and increasing government investment in logistics infrastructure.
- Key Growth Drivers in Europe: Focus on sustainable logistics, increasing demand for real-time tracking and monitoring solutions, and adoption of smart city initiatives.
Logistics Sensor Product Analysis
Logistics sensor products are rapidly evolving, integrating advanced technologies like AI and machine learning for enhanced data analytics. This enables real-time monitoring of temperature, humidity, shock, and location, facilitating predictive maintenance and optimized supply chain management. Products are tailored to various applications, including temperature monitoring for pharmaceuticals, shock detection for fragile goods, and location tracking for valuable assets. Competitive advantages stem from enhanced accuracy, longer battery life, and advanced data communication capabilities. The integration of sensors with IoT platforms provides seamless data integration and visibility throughout the supply chain.
Key Drivers, Barriers & Challenges in Logistics Sensor
Key Drivers: Technological advancements in sensor technology, the increasing demand for improved supply chain visibility and efficiency, and government regulations promoting safety and security are key drivers in the Logistics Sensor market. The integration of IoT and AI technologies enables real-time data analysis and predictive capabilities.
Challenges: High initial investment costs, concerns regarding data security and privacy, and the complexity of integrating various sensor systems across different platforms pose significant challenges. Supply chain disruptions can impact the availability of components and increase costs.
Growth Drivers in the Logistics Sensor Market
The market is propelled by the increasing adoption of IoT in logistics, the rise of e-commerce, and the need for enhanced supply chain visibility. Government regulations pushing for improved transportation safety and supply chain security also stimulate growth. Technological advancements like miniaturization, improved power efficiency, and advanced data analytics further accelerate market expansion.
Challenges Impacting Logistics Sensor Growth
High upfront costs associated with sensor implementation and integration can deter adoption, particularly among smaller businesses. Data security concerns and potential breaches remain a significant barrier. The complexity of managing large amounts of data from diverse sensor systems also presents a challenge. Furthermore, supply chain disruptions and fluctuating raw material prices can impact production costs and profitability.
Key Players Shaping the Logistics Sensor Market
- Bosch Sensortec
- TE Connectivity
- Sensitech Inc.
- Libelium
- Daicel
- Datalogic S.p.A.
- Honeywell
- Ingersoll Rand
- Schneider Electric
- Emerson
- Sick
- Hanwei Electronics Group Corporation
- Shanghai Lanbao Sensing Technology Co., Ltd.
- Huagong Tech Company Limited
Significant Logistics Sensor Industry Milestones
- 2020: Several major logistics companies announced significant investments in IoT-based sensor technologies for enhanced supply chain visibility.
- 2021: Introduction of new sensor technologies with improved accuracy and longer battery life.
- 2022: Increased regulatory scrutiny on data security in the logistics sector.
- 2023: Strategic partnerships formed between sensor manufacturers and logistics providers.
- 2024: Significant advancements in AI and machine learning algorithms for data analysis from logistics sensors.
Future Outlook for Logistics Sensor Market
The logistics sensor market is predicted to experience sustained growth, driven by increasing automation, rising demand for real-time data, and the growing importance of supply chain optimization. Strategic opportunities exist for companies that can offer innovative solutions addressing data security concerns and providing seamless integration with existing logistics systems. The market's potential is substantial, with continued expansion expected across all major regions.
Logistics Sensor Segmentation
-
1. Application
- 1.1. Logistics Location Tracking
- 1.2. Vibration and Shock Monitoring
- 1.3. Temperature Monitoring
- 1.4. Others
-
2. Types
- 2.1. Humidity Sensor
- 2.2. Pressure Sensor
- 2.3. Position Sensor
- 2.4. Others
Logistics Sensor Segmentation By Geography
-
1. North America
- 1.1. United States
- 1.2. Canada
- 1.3. Mexico
-
2. South America
- 2.1. Brazil
- 2.2. Argentina
- 2.3. Rest of South America
-
3. Europe
- 3.1. United Kingdom
- 3.2. Germany
- 3.3. France
- 3.4. Italy
- 3.5. Spain
- 3.6. Russia
- 3.7. Benelux
- 3.8. Nordics
- 3.9. Rest of Europe
-
4. Middle East & Africa
- 4.1. Turkey
- 4.2. Israel
- 4.3. GCC
- 4.4. North Africa
- 4.5. South Africa
- 4.6. Rest of Middle East & Africa
-
5. Asia Pacific
- 5.1. China
- 5.2. India
- 5.3. Japan
- 5.4. South Korea
- 5.5. ASEAN
- 5.6. Oceania
- 5.7. Rest of Asia Pacific
Logistics Sensor Regional Market Share
Geographic Coverage of Logistics Sensor
Logistics Sensor REPORT HIGHLIGHTS
| Aspects | Details |
|---|---|
| Study Period | 2020-2034 |
| Base Year | 2025 |
| Estimated Year | 2026 |
| Forecast Period | 2026-2034 |
| Historical Period | 2020-2025 |
| Growth Rate | CAGR of 5.4% from 2020-2034 |
| Segmentation |
|
Table of Contents
- 1. Introduction
- 1.1. Research Scope
- 1.2. Market Segmentation
- 1.3. Research Objective
- 1.4. Definitions and Assumptions
- 2. Executive Summary
- 2.1. Market Snapshot
- 3. Market Dynamics
- 3.1. Market Drivers
- 3.2. Market Restrains
- 3.3. Market Trends
- 3.4. Market Opportunities
- 4. Market Factor Analysis
- 4.1. Porters Five Forces
- 4.1.1. Bargaining Power of Suppliers
- 4.1.2. Bargaining Power of Buyers
- 4.1.3. Threat of New Entrants
- 4.1.4. Threat of Substitutes
- 4.1.5. Competitive Rivalry
- 4.2. PESTEL analysis
- 4.3. BCG Analysis
- 4.3.1. Stars (High Growth, High Market Share)
- 4.3.2. Cash Cows (Low Growth, High Market Share)
- 4.3.3. Question Mark (High Growth, Low Market Share)
- 4.3.4. Dogs (Low Growth, Low Market Share)
- 4.4. Ansoff Matrix Analysis
- 4.5. Supply Chain Analysis
- 4.6. Regulatory Landscape
- 4.7. Current Market Potential and Opportunity Assessment (TAM–SAM–SOM Framework)
- 4.8. TIR Analyst Note
- 4.1. Porters Five Forces
- 5. Market Analysis, Insights and Forecast 2021-2033
- 5.1. Market Analysis, Insights and Forecast - by Application
- 5.1.1. Logistics Location Tracking
- 5.1.2. Vibration and Shock Monitoring
- 5.1.3. Temperature Monitoring
- 5.1.4. Others
- 5.2. Market Analysis, Insights and Forecast - by Types
- 5.2.1. Humidity Sensor
- 5.2.2. Pressure Sensor
- 5.2.3. Position Sensor
- 5.2.4. Others
- 5.3. Market Analysis, Insights and Forecast - by Region
- 5.3.1. North America
- 5.3.2. South America
- 5.3.3. Europe
- 5.3.4. Middle East & Africa
- 5.3.5. Asia Pacific
- 5.1. Market Analysis, Insights and Forecast - by Application
- 6. Global Logistics Sensor Analysis, Insights and Forecast, 2021-2033
- 6.1. Market Analysis, Insights and Forecast - by Application
- 6.1.1. Logistics Location Tracking
- 6.1.2. Vibration and Shock Monitoring
- 6.1.3. Temperature Monitoring
- 6.1.4. Others
- 6.2. Market Analysis, Insights and Forecast - by Types
- 6.2.1. Humidity Sensor
- 6.2.2. Pressure Sensor
- 6.2.3. Position Sensor
- 6.2.4. Others
- 6.1. Market Analysis, Insights and Forecast - by Application
- 7. North America Logistics Sensor Analysis, Insights and Forecast, 2020-2032
- 7.1. Market Analysis, Insights and Forecast - by Application
- 7.1.1. Logistics Location Tracking
- 7.1.2. Vibration and Shock Monitoring
- 7.1.3. Temperature Monitoring
- 7.1.4. Others
- 7.2. Market Analysis, Insights and Forecast - by Types
- 7.2.1. Humidity Sensor
- 7.2.2. Pressure Sensor
- 7.2.3. Position Sensor
- 7.2.4. Others
- 7.1. Market Analysis, Insights and Forecast - by Application
- 8. South America Logistics Sensor Analysis, Insights and Forecast, 2020-2032
- 8.1. Market Analysis, Insights and Forecast - by Application
- 8.1.1. Logistics Location Tracking
- 8.1.2. Vibration and Shock Monitoring
- 8.1.3. Temperature Monitoring
- 8.1.4. Others
- 8.2. Market Analysis, Insights and Forecast - by Types
- 8.2.1. Humidity Sensor
- 8.2.2. Pressure Sensor
- 8.2.3. Position Sensor
- 8.2.4. Others
- 8.1. Market Analysis, Insights and Forecast - by Application
- 9. Europe Logistics Sensor Analysis, Insights and Forecast, 2020-2032
- 9.1. Market Analysis, Insights and Forecast - by Application
- 9.1.1. Logistics Location Tracking
- 9.1.2. Vibration and Shock Monitoring
- 9.1.3. Temperature Monitoring
- 9.1.4. Others
- 9.2. Market Analysis, Insights and Forecast - by Types
- 9.2.1. Humidity Sensor
- 9.2.2. Pressure Sensor
- 9.2.3. Position Sensor
- 9.2.4. Others
- 9.1. Market Analysis, Insights and Forecast - by Application
- 10. Middle East & Africa Logistics Sensor Analysis, Insights and Forecast, 2020-2032
- 10.1. Market Analysis, Insights and Forecast - by Application
- 10.1.1. Logistics Location Tracking
- 10.1.2. Vibration and Shock Monitoring
- 10.1.3. Temperature Monitoring
- 10.1.4. Others
- 10.2. Market Analysis, Insights and Forecast - by Types
- 10.2.1. Humidity Sensor
- 10.2.2. Pressure Sensor
- 10.2.3. Position Sensor
- 10.2.4. Others
- 10.1. Market Analysis, Insights and Forecast - by Application
- 11. Asia Pacific Logistics Sensor Analysis, Insights and Forecast, 2020-2032
- 11.1. Market Analysis, Insights and Forecast - by Application
- 11.1.1. Logistics Location Tracking
- 11.1.2. Vibration and Shock Monitoring
- 11.1.3. Temperature Monitoring
- 11.1.4. Others
- 11.2. Market Analysis, Insights and Forecast - by Types
- 11.2.1. Humidity Sensor
- 11.2.2. Pressure Sensor
- 11.2.3. Position Sensor
- 11.2.4. Others
- 11.1. Market Analysis, Insights and Forecast - by Application
- 12. Competitive Analysis
- 12.1. Company Profiles
- 12.1.1 Bosch Sensortec
- 12.1.1.1. Company Overview
- 12.1.1.2. Products
- 12.1.1.3. Company Financials
- 12.1.1.4. SWOT Analysis
- 12.1.2 TE Connectivity
- 12.1.2.1. Company Overview
- 12.1.2.2. Products
- 12.1.2.3. Company Financials
- 12.1.2.4. SWOT Analysis
- 12.1.3 Sensitech Inc.
- 12.1.3.1. Company Overview
- 12.1.3.2. Products
- 12.1.3.3. Company Financials
- 12.1.3.4. SWOT Analysis
- 12.1.4 Libelium
- 12.1.4.1. Company Overview
- 12.1.4.2. Products
- 12.1.4.3. Company Financials
- 12.1.4.4. SWOT Analysis
- 12.1.5 Daicel
- 12.1.5.1. Company Overview
- 12.1.5.2. Products
- 12.1.5.3. Company Financials
- 12.1.5.4. SWOT Analysis
- 12.1.6 Datalogic S.p.A.
- 12.1.6.1. Company Overview
- 12.1.6.2. Products
- 12.1.6.3. Company Financials
- 12.1.6.4. SWOT Analysis
- 12.1.7 Honeywell
- 12.1.7.1. Company Overview
- 12.1.7.2. Products
- 12.1.7.3. Company Financials
- 12.1.7.4. SWOT Analysis
- 12.1.8 Ingersoll Rand
- 12.1.8.1. Company Overview
- 12.1.8.2. Products
- 12.1.8.3. Company Financials
- 12.1.8.4. SWOT Analysis
- 12.1.9 Schneider Electric
- 12.1.9.1. Company Overview
- 12.1.9.2. Products
- 12.1.9.3. Company Financials
- 12.1.9.4. SWOT Analysis
- 12.1.10 Emerson
- 12.1.10.1. Company Overview
- 12.1.10.2. Products
- 12.1.10.3. Company Financials
- 12.1.10.4. SWOT Analysis
- 12.1.11 Sick
- 12.1.11.1. Company Overview
- 12.1.11.2. Products
- 12.1.11.3. Company Financials
- 12.1.11.4. SWOT Analysis
- 12.1.12 Hanwei Electronics Group Corporation
- 12.1.12.1. Company Overview
- 12.1.12.2. Products
- 12.1.12.3. Company Financials
- 12.1.12.4. SWOT Analysis
- 12.1.13 Shanghai Lanbao Sensing Technology Co.
- 12.1.13.1. Company Overview
- 12.1.13.2. Products
- 12.1.13.3. Company Financials
- 12.1.13.4. SWOT Analysis
- 12.1.14 Ltd.
- 12.1.14.1. Company Overview
- 12.1.14.2. Products
- 12.1.14.3. Company Financials
- 12.1.14.4. SWOT Analysis
- 12.1.15 Huagong Tech Company Limited
- 12.1.15.1. Company Overview
- 12.1.15.2. Products
- 12.1.15.3. Company Financials
- 12.1.15.4. SWOT Analysis
- 12.1.1 Bosch Sensortec
- 12.2. Market Entropy
- 12.2.1 Company's Key Areas Served
- 12.2.2 Recent Developments
- 12.3. Company Market Share Analysis 2025
- 12.3.1 Top 5 Companies Market Share Analysis
- 12.3.2 Top 3 Companies Market Share Analysis
- 12.4. List of Potential Customers
- 13. Research Methodology
List of Figures
- Figure 1: Global Logistics Sensor Revenue Breakdown (billion, %) by Region 2025 & 2033
- Figure 2: Global Logistics Sensor Volume Breakdown (K, %) by Region 2025 & 2033
- Figure 3: North America Logistics Sensor Revenue (billion), by Application 2025 & 2033
- Figure 4: North America Logistics Sensor Volume (K), by Application 2025 & 2033
- Figure 5: North America Logistics Sensor Revenue Share (%), by Application 2025 & 2033
- Figure 6: North America Logistics Sensor Volume Share (%), by Application 2025 & 2033
- Figure 7: North America Logistics Sensor Revenue (billion), by Types 2025 & 2033
- Figure 8: North America Logistics Sensor Volume (K), by Types 2025 & 2033
- Figure 9: North America Logistics Sensor Revenue Share (%), by Types 2025 & 2033
- Figure 10: North America Logistics Sensor Volume Share (%), by Types 2025 & 2033
- Figure 11: North America Logistics Sensor Revenue (billion), by Country 2025 & 2033
- Figure 12: North America Logistics Sensor Volume (K), by Country 2025 & 2033
- Figure 13: North America Logistics Sensor Revenue Share (%), by Country 2025 & 2033
- Figure 14: North America Logistics Sensor Volume Share (%), by Country 2025 & 2033
- Figure 15: South America Logistics Sensor Revenue (billion), by Application 2025 & 2033
- Figure 16: South America Logistics Sensor Volume (K), by Application 2025 & 2033
- Figure 17: South America Logistics Sensor Revenue Share (%), by Application 2025 & 2033
- Figure 18: South America Logistics Sensor Volume Share (%), by Application 2025 & 2033
- Figure 19: South America Logistics Sensor Revenue (billion), by Types 2025 & 2033
- Figure 20: South America Logistics Sensor Volume (K), by Types 2025 & 2033
- Figure 21: South America Logistics Sensor Revenue Share (%), by Types 2025 & 2033
- Figure 22: South America Logistics Sensor Volume Share (%), by Types 2025 & 2033
- Figure 23: South America Logistics Sensor Revenue (billion), by Country 2025 & 2033
- Figure 24: South America Logistics Sensor Volume (K), by Country 2025 & 2033
- Figure 25: South America Logistics Sensor Revenue Share (%), by Country 2025 & 2033
- Figure 26: South America Logistics Sensor Volume Share (%), by Country 2025 & 2033
- Figure 27: Europe Logistics Sensor Revenue (billion), by Application 2025 & 2033
- Figure 28: Europe Logistics Sensor Volume (K), by Application 2025 & 2033
- Figure 29: Europe Logistics Sensor Revenue Share (%), by Application 2025 & 2033
- Figure 30: Europe Logistics Sensor Volume Share (%), by Application 2025 & 2033
- Figure 31: Europe Logistics Sensor Revenue (billion), by Types 2025 & 2033
- Figure 32: Europe Logistics Sensor Volume (K), by Types 2025 & 2033
- Figure 33: Europe Logistics Sensor Revenue Share (%), by Types 2025 & 2033
- Figure 34: Europe Logistics Sensor Volume Share (%), by Types 2025 & 2033
- Figure 35: Europe Logistics Sensor Revenue (billion), by Country 2025 & 2033
- Figure 36: Europe Logistics Sensor Volume (K), by Country 2025 & 2033
- Figure 37: Europe Logistics Sensor Revenue Share (%), by Country 2025 & 2033
- Figure 38: Europe Logistics Sensor Volume Share (%), by Country 2025 & 2033
- Figure 39: Middle East & Africa Logistics Sensor Revenue (billion), by Application 2025 & 2033
- Figure 40: Middle East & Africa Logistics Sensor Volume (K), by Application 2025 & 2033
- Figure 41: Middle East & Africa Logistics Sensor Revenue Share (%), by Application 2025 & 2033
- Figure 42: Middle East & Africa Logistics Sensor Volume Share (%), by Application 2025 & 2033
- Figure 43: Middle East & Africa Logistics Sensor Revenue (billion), by Types 2025 & 2033
- Figure 44: Middle East & Africa Logistics Sensor Volume (K), by Types 2025 & 2033
- Figure 45: Middle East & Africa Logistics Sensor Revenue Share (%), by Types 2025 & 2033
- Figure 46: Middle East & Africa Logistics Sensor Volume Share (%), by Types 2025 & 2033
- Figure 47: Middle East & Africa Logistics Sensor Revenue (billion), by Country 2025 & 2033
- Figure 48: Middle East & Africa Logistics Sensor Volume (K), by Country 2025 & 2033
- Figure 49: Middle East & Africa Logistics Sensor Revenue Share (%), by Country 2025 & 2033
- Figure 50: Middle East & Africa Logistics Sensor Volume Share (%), by Country 2025 & 2033
- Figure 51: Asia Pacific Logistics Sensor Revenue (billion), by Application 2025 & 2033
- Figure 52: Asia Pacific Logistics Sensor Volume (K), by Application 2025 & 2033
- Figure 53: Asia Pacific Logistics Sensor Revenue Share (%), by Application 2025 & 2033
- Figure 54: Asia Pacific Logistics Sensor Volume Share (%), by Application 2025 & 2033
- Figure 55: Asia Pacific Logistics Sensor Revenue (billion), by Types 2025 & 2033
- Figure 56: Asia Pacific Logistics Sensor Volume (K), by Types 2025 & 2033
- Figure 57: Asia Pacific Logistics Sensor Revenue Share (%), by Types 2025 & 2033
- Figure 58: Asia Pacific Logistics Sensor Volume Share (%), by Types 2025 & 2033
- Figure 59: Asia Pacific Logistics Sensor Revenue (billion), by Country 2025 & 2033
- Figure 60: Asia Pacific Logistics Sensor Volume (K), by Country 2025 & 2033
- Figure 61: Asia Pacific Logistics Sensor Revenue Share (%), by Country 2025 & 2033
- Figure 62: Asia Pacific Logistics Sensor Volume Share (%), by Country 2025 & 2033
List of Tables
- Table 1: Global Logistics Sensor Revenue billion Forecast, by Application 2020 & 2033
- Table 2: Global Logistics Sensor Volume K Forecast, by Application 2020 & 2033
- Table 3: Global Logistics Sensor Revenue billion Forecast, by Types 2020 & 2033
- Table 4: Global Logistics Sensor Volume K Forecast, by Types 2020 & 2033
- Table 5: Global Logistics Sensor Revenue billion Forecast, by Region 2020 & 2033
- Table 6: Global Logistics Sensor Volume K Forecast, by Region 2020 & 2033
- Table 7: Global Logistics Sensor Revenue billion Forecast, by Application 2020 & 2033
- Table 8: Global Logistics Sensor Volume K Forecast, by Application 2020 & 2033
- Table 9: Global Logistics Sensor Revenue billion Forecast, by Types 2020 & 2033
- Table 10: Global Logistics Sensor Volume K Forecast, by Types 2020 & 2033
- Table 11: Global Logistics Sensor Revenue billion Forecast, by Country 2020 & 2033
- Table 12: Global Logistics Sensor Volume K Forecast, by Country 2020 & 2033
- Table 13: United States Logistics Sensor Revenue (billion) Forecast, by Application 2020 & 2033
- Table 14: United States Logistics Sensor Volume (K) Forecast, by Application 2020 & 2033
- Table 15: Canada Logistics Sensor Revenue (billion) Forecast, by Application 2020 & 2033
- Table 16: Canada Logistics Sensor Volume (K) Forecast, by Application 2020 & 2033
- Table 17: Mexico Logistics Sensor Revenue (billion) Forecast, by Application 2020 & 2033
- Table 18: Mexico Logistics Sensor Volume (K) Forecast, by Application 2020 & 2033
- Table 19: Global Logistics Sensor Revenue billion Forecast, by Application 2020 & 2033
- Table 20: Global Logistics Sensor Volume K Forecast, by Application 2020 & 2033
- Table 21: Global Logistics Sensor Revenue billion Forecast, by Types 2020 & 2033
- Table 22: Global Logistics Sensor Volume K Forecast, by Types 2020 & 2033
- Table 23: Global Logistics Sensor Revenue billion Forecast, by Country 2020 & 2033
- Table 24: Global Logistics Sensor Volume K Forecast, by Country 2020 & 2033
- Table 25: Brazil Logistics Sensor Revenue (billion) Forecast, by Application 2020 & 2033
- Table 26: Brazil Logistics Sensor Volume (K) Forecast, by Application 2020 & 2033
- Table 27: Argentina Logistics Sensor Revenue (billion) Forecast, by Application 2020 & 2033
- Table 28: Argentina Logistics Sensor Volume (K) Forecast, by Application 2020 & 2033
- Table 29: Rest of South America Logistics Sensor Revenue (billion) Forecast, by Application 2020 & 2033
- Table 30: Rest of South America Logistics Sensor Volume (K) Forecast, by Application 2020 & 2033
- Table 31: Global Logistics Sensor Revenue billion Forecast, by Application 2020 & 2033
- Table 32: Global Logistics Sensor Volume K Forecast, by Application 2020 & 2033
- Table 33: Global Logistics Sensor Revenue billion Forecast, by Types 2020 & 2033
- Table 34: Global Logistics Sensor Volume K Forecast, by Types 2020 & 2033
- Table 35: Global Logistics Sensor Revenue billion Forecast, by Country 2020 & 2033
- Table 36: Global Logistics Sensor Volume K Forecast, by Country 2020 & 2033
- Table 37: United Kingdom Logistics Sensor Revenue (billion) Forecast, by Application 2020 & 2033
- Table 38: United Kingdom Logistics Sensor Volume (K) Forecast, by Application 2020 & 2033
- Table 39: Germany Logistics Sensor Revenue (billion) Forecast, by Application 2020 & 2033
- Table 40: Germany Logistics Sensor Volume (K) Forecast, by Application 2020 & 2033
- Table 41: France Logistics Sensor Revenue (billion) Forecast, by Application 2020 & 2033
- Table 42: France Logistics Sensor Volume (K) Forecast, by Application 2020 & 2033
- Table 43: Italy Logistics Sensor Revenue (billion) Forecast, by Application 2020 & 2033
- Table 44: Italy Logistics Sensor Volume (K) Forecast, by Application 2020 & 2033
- Table 45: Spain Logistics Sensor Revenue (billion) Forecast, by Application 2020 & 2033
- Table 46: Spain Logistics Sensor Volume (K) Forecast, by Application 2020 & 2033
- Table 47: Russia Logistics Sensor Revenue (billion) Forecast, by Application 2020 & 2033
- Table 48: Russia Logistics Sensor Volume (K) Forecast, by Application 2020 & 2033
- Table 49: Benelux Logistics Sensor Revenue (billion) Forecast, by Application 2020 & 2033
- Table 50: Benelux Logistics Sensor Volume (K) Forecast, by Application 2020 & 2033
- Table 51: Nordics Logistics Sensor Revenue (billion) Forecast, by Application 2020 & 2033
- Table 52: Nordics Logistics Sensor Volume (K) Forecast, by Application 2020 & 2033
- Table 53: Rest of Europe Logistics Sensor Revenue (billion) Forecast, by Application 2020 & 2033
- Table 54: Rest of Europe Logistics Sensor Volume (K) Forecast, by Application 2020 & 2033
- Table 55: Global Logistics Sensor Revenue billion Forecast, by Application 2020 & 2033
- Table 56: Global Logistics Sensor Volume K Forecast, by Application 2020 & 2033
- Table 57: Global Logistics Sensor Revenue billion Forecast, by Types 2020 & 2033
- Table 58: Global Logistics Sensor Volume K Forecast, by Types 2020 & 2033
- Table 59: Global Logistics Sensor Revenue billion Forecast, by Country 2020 & 2033
- Table 60: Global Logistics Sensor Volume K Forecast, by Country 2020 & 2033
- Table 61: Turkey Logistics Sensor Revenue (billion) Forecast, by Application 2020 & 2033
- Table 62: Turkey Logistics Sensor Volume (K) Forecast, by Application 2020 & 2033
- Table 63: Israel Logistics Sensor Revenue (billion) Forecast, by Application 2020 & 2033
- Table 64: Israel Logistics Sensor Volume (K) Forecast, by Application 2020 & 2033
- Table 65: GCC Logistics Sensor Revenue (billion) Forecast, by Application 2020 & 2033
- Table 66: GCC Logistics Sensor Volume (K) Forecast, by Application 2020 & 2033
- Table 67: North Africa Logistics Sensor Revenue (billion) Forecast, by Application 2020 & 2033
- Table 68: North Africa Logistics Sensor Volume (K) Forecast, by Application 2020 & 2033
- Table 69: South Africa Logistics Sensor Revenue (billion) Forecast, by Application 2020 & 2033
- Table 70: South Africa Logistics Sensor Volume (K) Forecast, by Application 2020 & 2033
- Table 71: Rest of Middle East & Africa Logistics Sensor Revenue (billion) Forecast, by Application 2020 & 2033
- Table 72: Rest of Middle East & Africa Logistics Sensor Volume (K) Forecast, by Application 2020 & 2033
- Table 73: Global Logistics Sensor Revenue billion Forecast, by Application 2020 & 2033
- Table 74: Global Logistics Sensor Volume K Forecast, by Application 2020 & 2033
- Table 75: Global Logistics Sensor Revenue billion Forecast, by Types 2020 & 2033
- Table 76: Global Logistics Sensor Volume K Forecast, by Types 2020 & 2033
- Table 77: Global Logistics Sensor Revenue billion Forecast, by Country 2020 & 2033
- Table 78: Global Logistics Sensor Volume K Forecast, by Country 2020 & 2033
- Table 79: China Logistics Sensor Revenue (billion) Forecast, by Application 2020 & 2033
- Table 80: China Logistics Sensor Volume (K) Forecast, by Application 2020 & 2033
- Table 81: India Logistics Sensor Revenue (billion) Forecast, by Application 2020 & 2033
- Table 82: India Logistics Sensor Volume (K) Forecast, by Application 2020 & 2033
- Table 83: Japan Logistics Sensor Revenue (billion) Forecast, by Application 2020 & 2033
- Table 84: Japan Logistics Sensor Volume (K) Forecast, by Application 2020 & 2033
- Table 85: South Korea Logistics Sensor Revenue (billion) Forecast, by Application 2020 & 2033
- Table 86: South Korea Logistics Sensor Volume (K) Forecast, by Application 2020 & 2033
- Table 87: ASEAN Logistics Sensor Revenue (billion) Forecast, by Application 2020 & 2033
- Table 88: ASEAN Logistics Sensor Volume (K) Forecast, by Application 2020 & 2033
- Table 89: Oceania Logistics Sensor Revenue (billion) Forecast, by Application 2020 & 2033
- Table 90: Oceania Logistics Sensor Volume (K) Forecast, by Application 2020 & 2033
- Table 91: Rest of Asia Pacific Logistics Sensor Revenue (billion) Forecast, by Application 2020 & 2033
- Table 92: Rest of Asia Pacific Logistics Sensor Volume (K) Forecast, by Application 2020 & 2033
Frequently Asked Questions
1. What is the projected Compound Annual Growth Rate (CAGR) of the Logistics Sensor?
The projected CAGR is approximately 5.4%.
2. Which companies are prominent players in the Logistics Sensor?
Key companies in the market include Bosch Sensortec, TE Connectivity, Sensitech Inc., Libelium, Daicel, Datalogic S.p.A., Honeywell, Ingersoll Rand, Schneider Electric, Emerson, Sick, Hanwei Electronics Group Corporation, Shanghai Lanbao Sensing Technology Co., Ltd., Huagong Tech Company Limited.
3. What are the main segments of the Logistics Sensor?
The market segments include Application, Types.
4. Can you provide details about the market size?
The market size is estimated to be USD 9.02 billion as of 2022.
5. What are some drivers contributing to market growth?
N/A
6. What are the notable trends driving market growth?
N/A
7. Are there any restraints impacting market growth?
N/A
8. Can you provide examples of recent developments in the market?
N/A
9. What pricing options are available for accessing the report?
Pricing options include single-user, multi-user, and enterprise licenses priced at USD 4350.00, USD 6525.00, and USD 8700.00 respectively.
10. Is the market size provided in terms of value or volume?
The market size is provided in terms of value, measured in billion and volume, measured in K.
11. Are there any specific market keywords associated with the report?
Yes, the market keyword associated with the report is "Logistics Sensor," which aids in identifying and referencing the specific market segment covered.
12. How do I determine which pricing option suits my needs best?
The pricing options vary based on user requirements and access needs. Individual users may opt for single-user licenses, while businesses requiring broader access may choose multi-user or enterprise licenses for cost-effective access to the report.
13. Are there any additional resources or data provided in the Logistics Sensor report?
While the report offers comprehensive insights, it's advisable to review the specific contents or supplementary materials provided to ascertain if additional resources or data are available.
14. How can I stay updated on further developments or reports in the Logistics Sensor?
To stay informed about further developments, trends, and reports in the Logistics Sensor, consider subscribing to industry newsletters, following relevant companies and organizations, or regularly checking reputable industry news sources and publications.
Methodology
Step 1 - Identification of Relevant Samples Size from Population Database


Step 2 - Approaches for Defining Global Market Size (Value, Volume* & Price*)

Note*: In applicable scenarios
Step 3 - Data Sources
Primary Research
- Web Analytics
- Survey Reports
- Research Institute
- Latest Research Reports
- Opinion Leaders
Secondary Research
- Annual Reports
- White Paper
- Latest Press Release
- Industry Association
- Paid Database
- Investor Presentations

Step 4 - Data Triangulation
Involves using different sources of information in order to increase the validity of a study
These sources are likely to be stakeholders in a program - participants, other researchers, program staff, other community members, and so on.
Then we put all data in single framework & apply various statistical tools to find out the dynamic on the market.
During the analysis stage, feedback from the stakeholder groups would be compared to determine areas of agreement as well as areas of divergence