

Key Insights
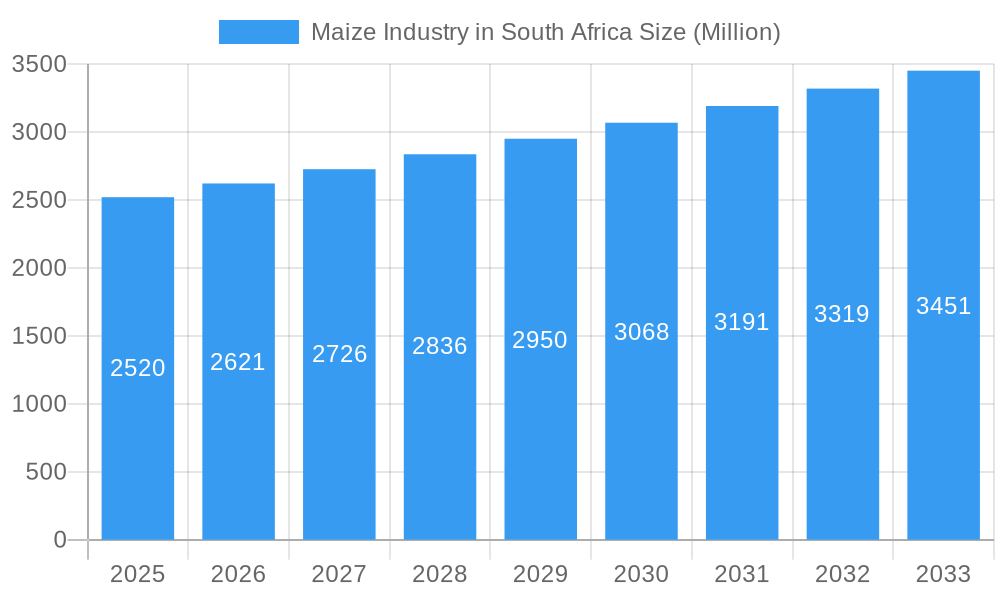
The South African maize industry is poised for steady growth, with a projected market size of R2.52 billion and an anticipated Compound Annual Growth Rate (CAGR) of 4.00% from 2025 to 2033. This expansion is primarily fueled by a rising domestic and regional demand for maize as a staple food, animal feed, and an industrial ingredient. South Africa's robust agricultural infrastructure and its position as a significant producer and exporter in the African continent provide a strong foundation for this growth trajectory. Key drivers include increasing population, growing middle-class consumption patterns, and government initiatives aimed at enhancing food security and agricultural productivity. The industry's value chain, encompassing production, consumption, import, export, and pricing, will see dynamic shifts as these factors play out, offering significant opportunities for stakeholders.
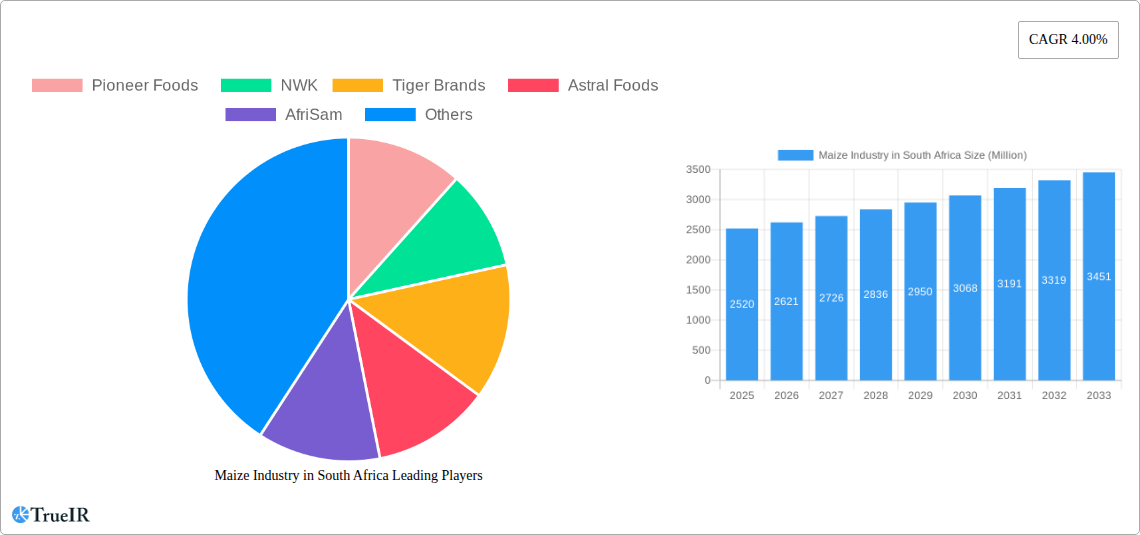
Maize Industry in South Africa Market Size (In Billion)
While growth is robust, the industry faces several restraints. These include the susceptibility of maize production to climate change, leading to volatile yields and price fluctuations. Furthermore, challenges related to logistics and infrastructure, particularly in transporting produce from rural farming areas to markets, can impact profitability and market access. The competitive landscape, featuring established players like Pioneer Foods, NWK, Tiger Brands, Astral Foods, and AfriSam, alongside emerging smaller enterprises, will necessitate strategic innovation and efficiency to maintain market share. The industry's ability to navigate these challenges through technological advancements in farming, improved supply chain management, and diversified end-use applications will be crucial for sustained and profitable growth. The distinct performance across various market segments and geographical regions will offer tailored investment and operational strategies.
Maize Industry in South Africa Company Market Share
South African Maize Market: Comprehensive Analysis & Future Projections (2019-2033)
Unlock critical insights into South Africa's dynamic maize industry with this in-depth market report. Covering a study period from 2019 to 2033, with a base and estimated year of 2025, this analysis provides an unparalleled view of market structure, trends, competitive landscape, and future growth trajectories. Delve into production, consumption, import, export, and price analyses, alongside an examination of key industry developments and emerging opportunities. This report is essential for stakeholders seeking to navigate and capitalize on the evolving South African maize market.
Maize Industry in South Africa Market Structure & Competitive Landscape
The South African maize industry exhibits a moderately concentrated market structure, with key players like Pioneer Foods, NWK, Tiger Brands, Astral Foods, and AfriSam holding significant market share. Innovation drivers are primarily focused on enhancing crop yields, improving pest and disease resistance, and developing higher nutritional value maize varieties. Regulatory impacts, including government policies on agricultural subsidies, land reform, and food security initiatives, play a crucial role in shaping the competitive environment. Product substitutes, such as other staple grains and alternative protein sources, exert a degree of influence on demand. End-user segmentation reveals a strong reliance on the animal feed sector, followed by human consumption (maize meal), industrial uses (biofuels, starch), and brewing. Mergers and Acquisitions (M&A) trends are driven by the pursuit of vertical integration, market expansion, and the acquisition of technological capabilities. For instance, the acquisition of smaller regional players by larger agribusinesses has been observed, contributing to market consolidation. Concentration ratios in key segments are estimated to be around 60-70% for the top five players. Investment in research and development for drought-resistant and insect-resistant maize varieties remains a key competitive advantage. The evolving landscape necessitates strategic alliances and partnerships to enhance market reach and technological adoption.
Maize Industry in South Africa Market Trends & Opportunities
The South African maize market is projected for robust growth, driven by increasing domestic demand for both human and animal consumption. The market size is anticipated to reach XX Million by 2033, exhibiting a Compound Annual Growth Rate (CAGR) of approximately X.X% from 2025 to 2033. Technological advancements are at the forefront of this expansion, with a significant uptake in genetically modified (GM) seeds engineered for enhanced pest resistance and drought tolerance. These innovations, such as those launched by Corteva Agriscience with their PowerCore technology, are crucial for improving farm productivity and mitigating the impact of climate variability. Consumer preferences are gradually shifting towards more nutritious and fortified maize products, creating opportunities for value-added processing and product development. The competitive dynamics are characterized by a blend of established agribusiness giants and emerging innovative seed companies. Market penetration rates for advanced seed technologies are expected to climb, particularly in regions with higher agricultural investment.
The Feed Industry remains the largest consumer of maize, driven by the expanding livestock sector in South Africa. This sustained demand creates a consistent market for maize producers and suppliers. Furthermore, the growing middle class and increasing awareness of health and nutrition are fostering a demand for higher-quality maize meal and fortified products. Government initiatives aimed at boosting local food production and ensuring food security are also significant growth catalysts. Opportunities abound in the development of specialized maize varieties for niche markets, such as those with specific starch content for industrial applications or improved processing qualities for food manufacturers. The adoption of precision agriculture techniques, including the use of drones and data analytics for optimized irrigation and fertilization, is another key trend that will enhance efficiency and profitability within the sector. The increasing focus on sustainable agriculture practices also presents an opportunity for the development and promotion of environmentally friendly maize cultivation methods.
Dominant Markets & Segments in Maize Industry in South Africa
The Production Analysis (Volume) in South Africa is predominantly driven by the North West and Free State provinces, which consistently account for over 70% of the total national maize output. Key growth drivers in these regions include fertile land, favorable rainfall patterns, and established agricultural infrastructure. The Consumption Analysis (Value and Volume) shows a strong dominance in the animal feed segment, driven by the expanding poultry and livestock industries across the country. This segment alone accounts for an estimated XX Million Tonnes annually. The human consumption segment, primarily through maize meal, remains a vital cornerstone of the South African diet, particularly in lower-income households.
The Import Analysis (Value and Volume) is influenced by domestic production shortfalls and specific quality requirements. While South Africa is a net exporter of maize, imports can surge during periods of drought or when specialized maize varieties are needed for particular industries. The Export Analysis (Value and Volume) is typically strong, with neighboring African countries and international markets being key destinations. South Africa's position as a major maize producer makes it a significant player in regional and global food trade. The Price Trend Analysis is highly sensitive to global commodity prices, domestic supply and demand dynamics, currency fluctuations, and weather patterns. Volatility in maize prices directly impacts the profitability of farmers and the cost of downstream products.
The Production Analysis (Volume) in the Free State province is particularly dominant due to its extensive arable land and consistent water availability. Policies supporting large-scale commercial farming and investment in modern agricultural machinery have further cemented its leading position. In terms of Consumption Analysis (Value and Volume), the feed industry's dominance is a testament to the significant growth in South Africa's meat and dairy production. This sustained demand creates a stable market for maize producers. Furthermore, the Export Analysis (Value and Volume) is significantly bolstered by trade agreements with Southern African Development Community (SADC) countries, making them a primary export destination.
Maize Industry in South Africa Product Analysis
South African maize products are diverse, ranging from yellow and white maize for feed and human consumption to specialized varieties for industrial applications. Innovations are focused on improving kernel quality, enhancing milling efficiency, and increasing nutritional content, particularly for staple maize meal. Genetically modified (GM) seeds offering resistance to pests like the fall armyworm and drought tolerance are gaining traction, providing farmers with greater crop security and higher yields. The development of herbicide-resistant traits, such as Corteva Agriscience's PowerCore technology, further optimizes farming practices. These advancements directly translate into more resilient crops and a more stable supply chain, contributing to competitive advantages for farmers and the industry as a whole.
Key Drivers, Barriers & Challenges in Maize Industry in South Africa
Key Drivers:
- Growing Domestic Demand: Increasing population and expanding livestock sector fuel demand for maize.
- Technological Advancements: Adoption of GM seeds with pest and drought resistance enhances yields and resilience.
- Government Support: Policies promoting food security and local production provide a favorable environment.
- Export Opportunities: South Africa's strong production capacity allows for significant export revenue.
Key Barriers & Challenges:
- Climate Change & Weather Volatility: Droughts and unpredictable rainfall patterns pose significant risks to crop yields.
- Input Costs: Rising prices of fertilizer, fuel, and seeds can impact farmer profitability.
- Pest and Disease Outbreaks: The threat of new or resistant pests, like the fall armyworm, requires continuous innovation and management.
- Logistics and Infrastructure: Inefficient transportation networks and storage facilities can lead to post-harvest losses and increased costs.
- Regulatory Uncertainty: Evolving policies related to GMOs and land reform can create market instability.
- Market Price Volatility: Fluctuations in global and domestic maize prices can impact farmer incomes.
Growth Drivers in the Maize Industry in South Africa Market
Growth in the South African maize industry is propelled by a confluence of technological, economic, and regulatory factors. The increasing adoption of genetically modified (GM) seeds, such as those equipped with PowerCore technology for insect resistance and drought tolerance, is a significant economic driver, enabling farmers to achieve higher yields and reduce crop losses. Government policies aimed at bolstering food security and promoting local agricultural production act as crucial regulatory drivers, encouraging investment and expansion within the sector. The growing demand for animal feed, stemming from the expanding poultry and livestock industries, represents a sustained economic impetus. Furthermore, export market opportunities, particularly within the SADC region, provide an economic incentive for increased production and competitiveness. The ongoing research and development into innovative maize products, such as those being explored by the University of the Free State and Grain South Africa, also promises future growth by addressing nutritional needs and creating new market segments.
Challenges Impacting Maize Industry in South Africa Growth
The growth trajectory of the South African maize industry is significantly impacted by several barriers and restraints. Climate change poses a substantial threat, with increasing frequency and intensity of droughts and unpredictable rainfall patterns leading to reduced yields and increased farmer risk. The high cost of agricultural inputs, including fertilizers, pesticides, and fuel, continues to be a major economic pressure, eroding profit margins for farmers. Pest and disease outbreaks, exemplified by the threat of fall armyworms, necessitate continuous investment in research and effective control measures, adding to operational costs. Logistical challenges, including underdeveloped infrastructure for transportation and storage, result in significant post-harvest losses and increased costs throughout the supply chain. Regulatory complexities, particularly surrounding the approval and adoption of new technologies like GMOs, can create uncertainty and slow down innovation adoption. Finally, market price volatility, influenced by global commodity markets and domestic supply-demand imbalances, presents an ongoing financial risk for producers.
Key Players Shaping the Maize Industry in South Africa Market
- Pioneer Foods
- NWK
- Tiger Brands
- Astral Foods
- AfriSam
- Corteva Agriscience
Significant Maize Industry in South Africa Industry Milestones
- August 2022: The University of the Free State and Grain South Africa entered into a joint venture for developing innovative new food maize products that could boost the nutritional intake of people in South Africa with lower incomes. This collaboration signifies a focus on social impact and value-added product development.
- June 2022: The National Biotechnology Development Agency (NBDA) of Nigeria released a new variety of maize called the Tela, a genetically modified organisms (GMO) crop variety designed to resist insect pests like fall armyworms and stem-borers and to tolerate moderate drought. This variety is set for trials in South Africa and will soon be available in the commercial market, signaling potential for enhanced pest and drought resistance in the South African market.
- March 2022: Corteva Agriscience launched their leading seed brands, Pannar and Pioneer, with PowerCore technology for South Africa's maize farmers. This solution is a new high-performing, herbicide-resistant seed trait that effectively helps protect crops from damaging above-ground insects, such as the maize stalk borer and spotted maize stem borer, directly impacting crop yields and farmer profitability.
Future Outlook for Maize Industry in South Africa Market
The future outlook for the South African maize industry is characterized by sustained growth and significant transformation, driven by technological innovation and evolving market demands. The increasing adoption of advanced seed technologies, focused on pest resistance and drought tolerance, will be crucial in mitigating the impacts of climate change and ensuring production stability. Opportunities for market expansion lie in the development of value-added maize products, catering to growing consumer preferences for nutritious and fortified foods, particularly among lower-income populations. Furthermore, continued government support for local production and food security initiatives will foster investment and drive expansion. The export market, especially within the SADC region, will remain a key growth catalyst. Strategic focus on sustainable agricultural practices and efficient supply chain management will be paramount in navigating challenges and capitalizing on the industry's immense potential, projecting a market valued at XX Million by 2033.
Maize Industry in South Africa Segmentation
- 1. Production Analysis (Volume)
- 2. Consumption Analysis (Value and Volume)
- 3. Import Analysis (Value and Volume)
- 4. Export Analysis (Value and Volume)
- 5. Price Trend Analysis
- 6. Production Analysis (Volume)
- 7. Consumption Analysis (Value and Volume)
- 8. Import Analysis (Value and Volume)
- 9. Export Analysis (Value and Volume)
- 10. Price Trend Analysis
Maize Industry in South Africa Segmentation By Geography
-
1. North America
- 1.1. United States
- 1.2. Canada
- 1.3. Mexico
-
2. South America
- 2.1. Brazil
- 2.2. Argentina
- 2.3. Rest of South America
-
3. Europe
- 3.1. United Kingdom
- 3.2. Germany
- 3.3. France
- 3.4. Italy
- 3.5. Spain
- 3.6. Russia
- 3.7. Benelux
- 3.8. Nordics
- 3.9. Rest of Europe
-
4. Middle East & Africa
- 4.1. Turkey
- 4.2. Israel
- 4.3. GCC
- 4.4. North Africa
- 4.5. South Africa
- 4.6. Rest of Middle East & Africa
-
5. Asia Pacific
- 5.1. China
- 5.2. India
- 5.3. Japan
- 5.4. South Korea
- 5.5. ASEAN
- 5.6. Oceania
- 5.7. Rest of Asia Pacific
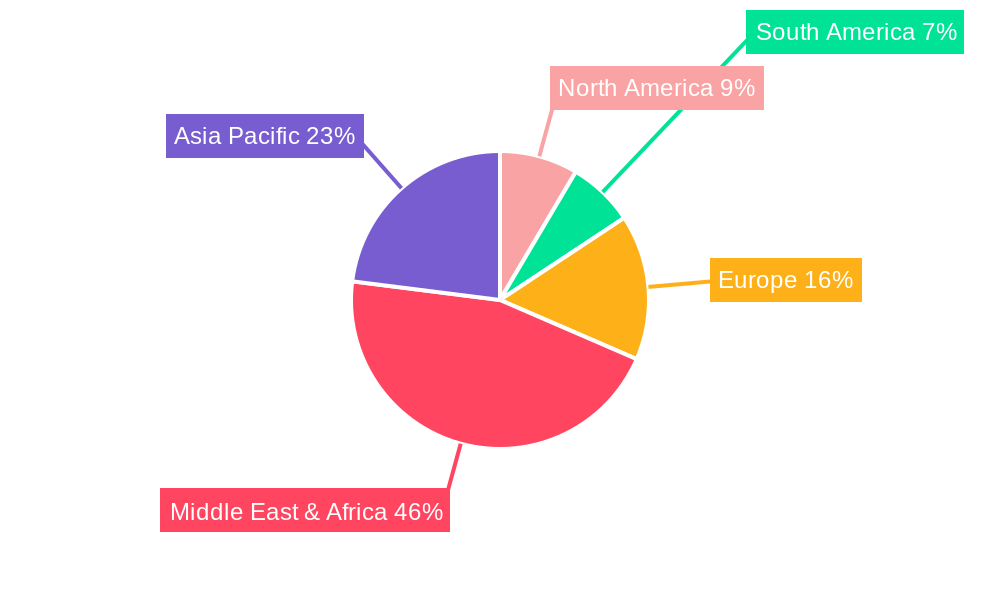
Maize Industry in South Africa Regional Market Share
Geographic Coverage of Maize Industry in South Africa
Maize Industry in South Africa REPORT HIGHLIGHTS
| Aspects | Details |
|---|---|
| Study Period | 2020-2034 |
| Base Year | 2025 |
| Estimated Year | 2026 |
| Forecast Period | 2026-2034 |
| Historical Period | 2020-2025 |
| Growth Rate | CAGR of 4.00% from 2020-2034 |
| Segmentation |
|
Table of Contents
- 1. Introduction
- 1.1. Research Scope
- 1.2. Market Segmentation
- 1.3. Research Objective
- 1.4. Definitions and Assumptions
- 2. Executive Summary
- 2.1. Market Snapshot
- 3. Market Dynamics
- 3.1. Market Drivers
- 3.2. Market Restrains
- 3.3. Market Trends
- 3.4. Market Opportunities
- 4. Market Factor Analysis
- 4.1. Porters Five Forces
- 4.1.1. Bargaining Power of Suppliers
- 4.1.2. Bargaining Power of Buyers
- 4.1.3. Threat of New Entrants
- 4.1.4. Threat of Substitutes
- 4.1.5. Competitive Rivalry
- 4.2. PESTEL analysis
- 4.3. BCG Analysis
- 4.3.1. Stars (High Growth, High Market Share)
- 4.3.2. Cash Cows (Low Growth, High Market Share)
- 4.3.3. Question Mark (High Growth, Low Market Share)
- 4.3.4. Dogs (Low Growth, Low Market Share)
- 4.4. Ansoff Matrix Analysis
- 4.5. Supply Chain Analysis
- 4.6. Regulatory Landscape
- 4.7. Current Market Potential and Opportunity Assessment (TAM–SAM–SOM Framework)
- 4.8. TIR Analyst Note
- 4.1. Porters Five Forces
- 5. Market Analysis, Insights and Forecast 2021-2033
- 5.1. Market Analysis, Insights and Forecast - by Production Analysis (Volume)
- 5.2. Market Analysis, Insights and Forecast - by Consumption Analysis (Value and Volume)
- 5.3. Market Analysis, Insights and Forecast - by Import Analysis (Value and Volume)
- 5.4. Market Analysis, Insights and Forecast - by Export Analysis (Value and Volume)
- 5.5. Market Analysis, Insights and Forecast - by Price Trend Analysis
- 5.6. Market Analysis, Insights and Forecast - by Production Analysis (Volume)
- 5.7. Market Analysis, Insights and Forecast - by Consumption Analysis (Value and Volume)
- 5.8. Market Analysis, Insights and Forecast - by Import Analysis (Value and Volume)
- 5.9. Market Analysis, Insights and Forecast - by Export Analysis (Value and Volume)
- 5.10. Market Analysis, Insights and Forecast - by Price Trend Analysis
- 5.11. Market Analysis, Insights and Forecast - by Region
- 5.11.1. North America
- 5.11.2. South America
- 5.11.3. Europe
- 5.11.4. Middle East & Africa
- 5.11.5. Asia Pacific
- 6. Global Maize Industry in South Africa Analysis, Insights and Forecast, 2021-2033
- 6.1. Market Analysis, Insights and Forecast - by Production Analysis (Volume)
- 6.2. Market Analysis, Insights and Forecast - by Consumption Analysis (Value and Volume)
- 6.3. Market Analysis, Insights and Forecast - by Import Analysis (Value and Volume)
- 6.4. Market Analysis, Insights and Forecast - by Export Analysis (Value and Volume)
- 6.5. Market Analysis, Insights and Forecast - by Price Trend Analysis
- 6.6. Market Analysis, Insights and Forecast - by Production Analysis (Volume)
- 6.7. Market Analysis, Insights and Forecast - by Consumption Analysis (Value and Volume)
- 6.8. Market Analysis, Insights and Forecast - by Import Analysis (Value and Volume)
- 6.9. Market Analysis, Insights and Forecast - by Export Analysis (Value and Volume)
- 6.10. Market Analysis, Insights and Forecast - by Price Trend Analysis
- 7. North America Maize Industry in South Africa Analysis, Insights and Forecast, 2020-2032
- 7.1. Market Analysis, Insights and Forecast - by Production Analysis (Volume)
- 7.2. Market Analysis, Insights and Forecast - by Consumption Analysis (Value and Volume)
- 7.3. Market Analysis, Insights and Forecast - by Import Analysis (Value and Volume)
- 7.4. Market Analysis, Insights and Forecast - by Export Analysis (Value and Volume)
- 7.5. Market Analysis, Insights and Forecast - by Price Trend Analysis
- 7.6. Market Analysis, Insights and Forecast - by Production Analysis (Volume)
- 7.7. Market Analysis, Insights and Forecast - by Consumption Analysis (Value and Volume)
- 7.8. Market Analysis, Insights and Forecast - by Import Analysis (Value and Volume)
- 7.9. Market Analysis, Insights and Forecast - by Export Analysis (Value and Volume)
- 7.10. Market Analysis, Insights and Forecast - by Price Trend Analysis
- 8. South America Maize Industry in South Africa Analysis, Insights and Forecast, 2020-2032
- 8.1. Market Analysis, Insights and Forecast - by Production Analysis (Volume)
- 8.2. Market Analysis, Insights and Forecast - by Consumption Analysis (Value and Volume)
- 8.3. Market Analysis, Insights and Forecast - by Import Analysis (Value and Volume)
- 8.4. Market Analysis, Insights and Forecast - by Export Analysis (Value and Volume)
- 8.5. Market Analysis, Insights and Forecast - by Price Trend Analysis
- 8.6. Market Analysis, Insights and Forecast - by Production Analysis (Volume)
- 8.7. Market Analysis, Insights and Forecast - by Consumption Analysis (Value and Volume)
- 8.8. Market Analysis, Insights and Forecast - by Import Analysis (Value and Volume)
- 8.9. Market Analysis, Insights and Forecast - by Export Analysis (Value and Volume)
- 8.10. Market Analysis, Insights and Forecast - by Price Trend Analysis
- 9. Europe Maize Industry in South Africa Analysis, Insights and Forecast, 2020-2032
- 9.1. Market Analysis, Insights and Forecast - by Production Analysis (Volume)
- 9.2. Market Analysis, Insights and Forecast - by Consumption Analysis (Value and Volume)
- 9.3. Market Analysis, Insights and Forecast - by Import Analysis (Value and Volume)
- 9.4. Market Analysis, Insights and Forecast - by Export Analysis (Value and Volume)
- 9.5. Market Analysis, Insights and Forecast - by Price Trend Analysis
- 9.6. Market Analysis, Insights and Forecast - by Production Analysis (Volume)
- 9.7. Market Analysis, Insights and Forecast - by Consumption Analysis (Value and Volume)
- 9.8. Market Analysis, Insights and Forecast - by Import Analysis (Value and Volume)
- 9.9. Market Analysis, Insights and Forecast - by Export Analysis (Value and Volume)
- 9.10. Market Analysis, Insights and Forecast - by Price Trend Analysis
- 10. Middle East & Africa Maize Industry in South Africa Analysis, Insights and Forecast, 2020-2032
- 10.1. Market Analysis, Insights and Forecast - by Production Analysis (Volume)
- 10.2. Market Analysis, Insights and Forecast - by Consumption Analysis (Value and Volume)
- 10.3. Market Analysis, Insights and Forecast - by Import Analysis (Value and Volume)
- 10.4. Market Analysis, Insights and Forecast - by Export Analysis (Value and Volume)
- 10.5. Market Analysis, Insights and Forecast - by Price Trend Analysis
- 10.6. Market Analysis, Insights and Forecast - by Production Analysis (Volume)
- 10.7. Market Analysis, Insights and Forecast - by Consumption Analysis (Value and Volume)
- 10.8. Market Analysis, Insights and Forecast - by Import Analysis (Value and Volume)
- 10.9. Market Analysis, Insights and Forecast - by Export Analysis (Value and Volume)
- 10.10. Market Analysis, Insights and Forecast - by Price Trend Analysis
- 11. Asia Pacific Maize Industry in South Africa Analysis, Insights and Forecast, 2020-2032
- 11.1. Market Analysis, Insights and Forecast - by Production Analysis (Volume)
- 11.2. Market Analysis, Insights and Forecast - by Consumption Analysis (Value and Volume)
- 11.3. Market Analysis, Insights and Forecast - by Import Analysis (Value and Volume)
- 11.4. Market Analysis, Insights and Forecast - by Export Analysis (Value and Volume)
- 11.5. Market Analysis, Insights and Forecast - by Price Trend Analysis
- 11.6. Market Analysis, Insights and Forecast - by Production Analysis (Volume)
- 11.7. Market Analysis, Insights and Forecast - by Consumption Analysis (Value and Volume)
- 11.8. Market Analysis, Insights and Forecast - by Import Analysis (Value and Volume)
- 11.9. Market Analysis, Insights and Forecast - by Export Analysis (Value and Volume)
- 11.10. Market Analysis, Insights and Forecast - by Price Trend Analysis
- 12. Competitive Analysis
- 12.1. Company Profiles
- 12.1.1 Pioneer Foods
- 12.1.1.1. Company Overview
- 12.1.1.2. Products
- 12.1.1.3. Company Financials
- 12.1.1.4. SWOT Analysis
- 12.1.2 NWK
- 12.1.2.1. Company Overview
- 12.1.2.2. Products
- 12.1.2.3. Company Financials
- 12.1.2.4. SWOT Analysis
- 12.1.3 Tiger Brands
- 12.1.3.1. Company Overview
- 12.1.3.2. Products
- 12.1.3.3. Company Financials
- 12.1.3.4. SWOT Analysis
- 12.1.4 Astral Foods
- 12.1.4.1. Company Overview
- 12.1.4.2. Products
- 12.1.4.3. Company Financials
- 12.1.4.4. SWOT Analysis
- 12.1.5 AfriSam
- 12.1.5.1. Company Overview
- 12.1.5.2. Products
- 12.1.5.3. Company Financials
- 12.1.5.4. SWOT Analysis
- 12.1.1 Pioneer Foods
- 12.2. Market Entropy
- 12.2.1 Company's Key Areas Served
- 12.2.2 Recent Developments
- 12.3. Company Market Share Analysis 2025
- 12.3.1 Top 5 Companies Market Share Analysis
- 12.3.2 Top 3 Companies Market Share Analysis
- 12.4. List of Potential Customers
- 13. Research Methodology
List of Figures
- Figure 1: Global Maize Industry in South Africa Revenue Breakdown (Million, %) by Region 2025 & 2033
- Figure 2: Global Maize Industry in South Africa Volume Breakdown (K Units, %) by Region 2025 & 2033
- Figure 3: North America Maize Industry in South Africa Revenue (Million), by Production Analysis (Volume) 2025 & 2033
- Figure 4: North America Maize Industry in South Africa Volume (K Units), by Production Analysis (Volume) 2025 & 2033
- Figure 5: North America Maize Industry in South Africa Revenue Share (%), by Production Analysis (Volume) 2025 & 2033
- Figure 6: North America Maize Industry in South Africa Volume Share (%), by Production Analysis (Volume) 2025 & 2033
- Figure 7: North America Maize Industry in South Africa Revenue (Million), by Consumption Analysis (Value and Volume) 2025 & 2033
- Figure 8: North America Maize Industry in South Africa Volume (K Units), by Consumption Analysis (Value and Volume) 2025 & 2033
- Figure 9: North America Maize Industry in South Africa Revenue Share (%), by Consumption Analysis (Value and Volume) 2025 & 2033
- Figure 10: North America Maize Industry in South Africa Volume Share (%), by Consumption Analysis (Value and Volume) 2025 & 2033
- Figure 11: North America Maize Industry in South Africa Revenue (Million), by Import Analysis (Value and Volume) 2025 & 2033
- Figure 12: North America Maize Industry in South Africa Volume (K Units), by Import Analysis (Value and Volume) 2025 & 2033
- Figure 13: North America Maize Industry in South Africa Revenue Share (%), by Import Analysis (Value and Volume) 2025 & 2033
- Figure 14: North America Maize Industry in South Africa Volume Share (%), by Import Analysis (Value and Volume) 2025 & 2033
- Figure 15: North America Maize Industry in South Africa Revenue (Million), by Export Analysis (Value and Volume) 2025 & 2033
- Figure 16: North America Maize Industry in South Africa Volume (K Units), by Export Analysis (Value and Volume) 2025 & 2033
- Figure 17: North America Maize Industry in South Africa Revenue Share (%), by Export Analysis (Value and Volume) 2025 & 2033
- Figure 18: North America Maize Industry in South Africa Volume Share (%), by Export Analysis (Value and Volume) 2025 & 2033
- Figure 19: North America Maize Industry in South Africa Revenue (Million), by Price Trend Analysis 2025 & 2033
- Figure 20: North America Maize Industry in South Africa Volume (K Units), by Price Trend Analysis 2025 & 2033
- Figure 21: North America Maize Industry in South Africa Revenue Share (%), by Price Trend Analysis 2025 & 2033
- Figure 22: North America Maize Industry in South Africa Volume Share (%), by Price Trend Analysis 2025 & 2033
- Figure 23: North America Maize Industry in South Africa Revenue (Million), by Production Analysis (Volume) 2025 & 2033
- Figure 24: North America Maize Industry in South Africa Volume (K Units), by Production Analysis (Volume) 2025 & 2033
- Figure 25: North America Maize Industry in South Africa Revenue Share (%), by Production Analysis (Volume) 2025 & 2033
- Figure 26: North America Maize Industry in South Africa Volume Share (%), by Production Analysis (Volume) 2025 & 2033
- Figure 27: North America Maize Industry in South Africa Revenue (Million), by Consumption Analysis (Value and Volume) 2025 & 2033
- Figure 28: North America Maize Industry in South Africa Volume (K Units), by Consumption Analysis (Value and Volume) 2025 & 2033
- Figure 29: North America Maize Industry in South Africa Revenue Share (%), by Consumption Analysis (Value and Volume) 2025 & 2033
- Figure 30: North America Maize Industry in South Africa Volume Share (%), by Consumption Analysis (Value and Volume) 2025 & 2033
- Figure 31: North America Maize Industry in South Africa Revenue (Million), by Import Analysis (Value and Volume) 2025 & 2033
- Figure 32: North America Maize Industry in South Africa Volume (K Units), by Import Analysis (Value and Volume) 2025 & 2033
- Figure 33: North America Maize Industry in South Africa Revenue Share (%), by Import Analysis (Value and Volume) 2025 & 2033
- Figure 34: North America Maize Industry in South Africa Volume Share (%), by Import Analysis (Value and Volume) 2025 & 2033
- Figure 35: North America Maize Industry in South Africa Revenue (Million), by Export Analysis (Value and Volume) 2025 & 2033
- Figure 36: North America Maize Industry in South Africa Volume (K Units), by Export Analysis (Value and Volume) 2025 & 2033
- Figure 37: North America Maize Industry in South Africa Revenue Share (%), by Export Analysis (Value and Volume) 2025 & 2033
- Figure 38: North America Maize Industry in South Africa Volume Share (%), by Export Analysis (Value and Volume) 2025 & 2033
- Figure 39: North America Maize Industry in South Africa Revenue (Million), by Price Trend Analysis 2025 & 2033
- Figure 40: North America Maize Industry in South Africa Volume (K Units), by Price Trend Analysis 2025 & 2033
- Figure 41: North America Maize Industry in South Africa Revenue Share (%), by Price Trend Analysis 2025 & 2033
- Figure 42: North America Maize Industry in South Africa Volume Share (%), by Price Trend Analysis 2025 & 2033
- Figure 43: North America Maize Industry in South Africa Revenue (Million), by Country 2025 & 2033
- Figure 44: North America Maize Industry in South Africa Volume (K Units), by Country 2025 & 2033
- Figure 45: North America Maize Industry in South Africa Revenue Share (%), by Country 2025 & 2033
- Figure 46: North America Maize Industry in South Africa Volume Share (%), by Country 2025 & 2033
- Figure 47: South America Maize Industry in South Africa Revenue (Million), by Production Analysis (Volume) 2025 & 2033
- Figure 48: South America Maize Industry in South Africa Volume (K Units), by Production Analysis (Volume) 2025 & 2033
- Figure 49: South America Maize Industry in South Africa Revenue Share (%), by Production Analysis (Volume) 2025 & 2033
- Figure 50: South America Maize Industry in South Africa Volume Share (%), by Production Analysis (Volume) 2025 & 2033
- Figure 51: South America Maize Industry in South Africa Revenue (Million), by Consumption Analysis (Value and Volume) 2025 & 2033
- Figure 52: South America Maize Industry in South Africa Volume (K Units), by Consumption Analysis (Value and Volume) 2025 & 2033
- Figure 53: South America Maize Industry in South Africa Revenue Share (%), by Consumption Analysis (Value and Volume) 2025 & 2033
- Figure 54: South America Maize Industry in South Africa Volume Share (%), by Consumption Analysis (Value and Volume) 2025 & 2033
- Figure 55: South America Maize Industry in South Africa Revenue (Million), by Import Analysis (Value and Volume) 2025 & 2033
- Figure 56: South America Maize Industry in South Africa Volume (K Units), by Import Analysis (Value and Volume) 2025 & 2033
- Figure 57: South America Maize Industry in South Africa Revenue Share (%), by Import Analysis (Value and Volume) 2025 & 2033
- Figure 58: South America Maize Industry in South Africa Volume Share (%), by Import Analysis (Value and Volume) 2025 & 2033
- Figure 59: South America Maize Industry in South Africa Revenue (Million), by Export Analysis (Value and Volume) 2025 & 2033
- Figure 60: South America Maize Industry in South Africa Volume (K Units), by Export Analysis (Value and Volume) 2025 & 2033
- Figure 61: South America Maize Industry in South Africa Revenue Share (%), by Export Analysis (Value and Volume) 2025 & 2033
- Figure 62: South America Maize Industry in South Africa Volume Share (%), by Export Analysis (Value and Volume) 2025 & 2033
- Figure 63: South America Maize Industry in South Africa Revenue (Million), by Price Trend Analysis 2025 & 2033
- Figure 64: South America Maize Industry in South Africa Volume (K Units), by Price Trend Analysis 2025 & 2033
- Figure 65: South America Maize Industry in South Africa Revenue Share (%), by Price Trend Analysis 2025 & 2033
- Figure 66: South America Maize Industry in South Africa Volume Share (%), by Price Trend Analysis 2025 & 2033
- Figure 67: South America Maize Industry in South Africa Revenue (Million), by Production Analysis (Volume) 2025 & 2033
- Figure 68: South America Maize Industry in South Africa Volume (K Units), by Production Analysis (Volume) 2025 & 2033
- Figure 69: South America Maize Industry in South Africa Revenue Share (%), by Production Analysis (Volume) 2025 & 2033
- Figure 70: South America Maize Industry in South Africa Volume Share (%), by Production Analysis (Volume) 2025 & 2033
- Figure 71: South America Maize Industry in South Africa Revenue (Million), by Consumption Analysis (Value and Volume) 2025 & 2033
- Figure 72: South America Maize Industry in South Africa Volume (K Units), by Consumption Analysis (Value and Volume) 2025 & 2033
- Figure 73: South America Maize Industry in South Africa Revenue Share (%), by Consumption Analysis (Value and Volume) 2025 & 2033
- Figure 74: South America Maize Industry in South Africa Volume Share (%), by Consumption Analysis (Value and Volume) 2025 & 2033
- Figure 75: South America Maize Industry in South Africa Revenue (Million), by Import Analysis (Value and Volume) 2025 & 2033
- Figure 76: South America Maize Industry in South Africa Volume (K Units), by Import Analysis (Value and Volume) 2025 & 2033
- Figure 77: South America Maize Industry in South Africa Revenue Share (%), by Import Analysis (Value and Volume) 2025 & 2033
- Figure 78: South America Maize Industry in South Africa Volume Share (%), by Import Analysis (Value and Volume) 2025 & 2033
- Figure 79: South America Maize Industry in South Africa Revenue (Million), by Export Analysis (Value and Volume) 2025 & 2033
- Figure 80: South America Maize Industry in South Africa Volume (K Units), by Export Analysis (Value and Volume) 2025 & 2033
- Figure 81: South America Maize Industry in South Africa Revenue Share (%), by Export Analysis (Value and Volume) 2025 & 2033
- Figure 82: South America Maize Industry in South Africa Volume Share (%), by Export Analysis (Value and Volume) 2025 & 2033
- Figure 83: South America Maize Industry in South Africa Revenue (Million), by Price Trend Analysis 2025 & 2033
- Figure 84: South America Maize Industry in South Africa Volume (K Units), by Price Trend Analysis 2025 & 2033
- Figure 85: South America Maize Industry in South Africa Revenue Share (%), by Price Trend Analysis 2025 & 2033
- Figure 86: South America Maize Industry in South Africa Volume Share (%), by Price Trend Analysis 2025 & 2033
- Figure 87: South America Maize Industry in South Africa Revenue (Million), by Country 2025 & 2033
- Figure 88: South America Maize Industry in South Africa Volume (K Units), by Country 2025 & 2033
- Figure 89: South America Maize Industry in South Africa Revenue Share (%), by Country 2025 & 2033
- Figure 90: South America Maize Industry in South Africa Volume Share (%), by Country 2025 & 2033
- Figure 91: Europe Maize Industry in South Africa Revenue (Million), by Production Analysis (Volume) 2025 & 2033
- Figure 92: Europe Maize Industry in South Africa Volume (K Units), by Production Analysis (Volume) 2025 & 2033
- Figure 93: Europe Maize Industry in South Africa Revenue Share (%), by Production Analysis (Volume) 2025 & 2033
- Figure 94: Europe Maize Industry in South Africa Volume Share (%), by Production Analysis (Volume) 2025 & 2033
- Figure 95: Europe Maize Industry in South Africa Revenue (Million), by Consumption Analysis (Value and Volume) 2025 & 2033
- Figure 96: Europe Maize Industry in South Africa Volume (K Units), by Consumption Analysis (Value and Volume) 2025 & 2033
- Figure 97: Europe Maize Industry in South Africa Revenue Share (%), by Consumption Analysis (Value and Volume) 2025 & 2033
- Figure 98: Europe Maize Industry in South Africa Volume Share (%), by Consumption Analysis (Value and Volume) 2025 & 2033
- Figure 99: Europe Maize Industry in South Africa Revenue (Million), by Import Analysis (Value and Volume) 2025 & 2033
- Figure 100: Europe Maize Industry in South Africa Volume (K Units), by Import Analysis (Value and Volume) 2025 & 2033
- Figure 101: Europe Maize Industry in South Africa Revenue Share (%), by Import Analysis (Value and Volume) 2025 & 2033
- Figure 102: Europe Maize Industry in South Africa Volume Share (%), by Import Analysis (Value and Volume) 2025 & 2033
- Figure 103: Europe Maize Industry in South Africa Revenue (Million), by Export Analysis (Value and Volume) 2025 & 2033
- Figure 104: Europe Maize Industry in South Africa Volume (K Units), by Export Analysis (Value and Volume) 2025 & 2033
- Figure 105: Europe Maize Industry in South Africa Revenue Share (%), by Export Analysis (Value and Volume) 2025 & 2033
- Figure 106: Europe Maize Industry in South Africa Volume Share (%), by Export Analysis (Value and Volume) 2025 & 2033
- Figure 107: Europe Maize Industry in South Africa Revenue (Million), by Price Trend Analysis 2025 & 2033
- Figure 108: Europe Maize Industry in South Africa Volume (K Units), by Price Trend Analysis 2025 & 2033
- Figure 109: Europe Maize Industry in South Africa Revenue Share (%), by Price Trend Analysis 2025 & 2033
- Figure 110: Europe Maize Industry in South Africa Volume Share (%), by Price Trend Analysis 2025 & 2033
- Figure 111: Europe Maize Industry in South Africa Revenue (Million), by Production Analysis (Volume) 2025 & 2033
- Figure 112: Europe Maize Industry in South Africa Volume (K Units), by Production Analysis (Volume) 2025 & 2033
- Figure 113: Europe Maize Industry in South Africa Revenue Share (%), by Production Analysis (Volume) 2025 & 2033
- Figure 114: Europe Maize Industry in South Africa Volume Share (%), by Production Analysis (Volume) 2025 & 2033
- Figure 115: Europe Maize Industry in South Africa Revenue (Million), by Consumption Analysis (Value and Volume) 2025 & 2033
- Figure 116: Europe Maize Industry in South Africa Volume (K Units), by Consumption Analysis (Value and Volume) 2025 & 2033
- Figure 117: Europe Maize Industry in South Africa Revenue Share (%), by Consumption Analysis (Value and Volume) 2025 & 2033
- Figure 118: Europe Maize Industry in South Africa Volume Share (%), by Consumption Analysis (Value and Volume) 2025 & 2033
- Figure 119: Europe Maize Industry in South Africa Revenue (Million), by Import Analysis (Value and Volume) 2025 & 2033
- Figure 120: Europe Maize Industry in South Africa Volume (K Units), by Import Analysis (Value and Volume) 2025 & 2033
- Figure 121: Europe Maize Industry in South Africa Revenue Share (%), by Import Analysis (Value and Volume) 2025 & 2033
- Figure 122: Europe Maize Industry in South Africa Volume Share (%), by Import Analysis (Value and Volume) 2025 & 2033
- Figure 123: Europe Maize Industry in South Africa Revenue (Million), by Export Analysis (Value and Volume) 2025 & 2033
- Figure 124: Europe Maize Industry in South Africa Volume (K Units), by Export Analysis (Value and Volume) 2025 & 2033
- Figure 125: Europe Maize Industry in South Africa Revenue Share (%), by Export Analysis (Value and Volume) 2025 & 2033
- Figure 126: Europe Maize Industry in South Africa Volume Share (%), by Export Analysis (Value and Volume) 2025 & 2033
- Figure 127: Europe Maize Industry in South Africa Revenue (Million), by Price Trend Analysis 2025 & 2033
- Figure 128: Europe Maize Industry in South Africa Volume (K Units), by Price Trend Analysis 2025 & 2033
- Figure 129: Europe Maize Industry in South Africa Revenue Share (%), by Price Trend Analysis 2025 & 2033
- Figure 130: Europe Maize Industry in South Africa Volume Share (%), by Price Trend Analysis 2025 & 2033
- Figure 131: Europe Maize Industry in South Africa Revenue (Million), by Country 2025 & 2033
- Figure 132: Europe Maize Industry in South Africa Volume (K Units), by Country 2025 & 2033
- Figure 133: Europe Maize Industry in South Africa Revenue Share (%), by Country 2025 & 2033
- Figure 134: Europe Maize Industry in South Africa Volume Share (%), by Country 2025 & 2033
- Figure 135: Middle East & Africa Maize Industry in South Africa Revenue (Million), by Production Analysis (Volume) 2025 & 2033
- Figure 136: Middle East & Africa Maize Industry in South Africa Volume (K Units), by Production Analysis (Volume) 2025 & 2033
- Figure 137: Middle East & Africa Maize Industry in South Africa Revenue Share (%), by Production Analysis (Volume) 2025 & 2033
- Figure 138: Middle East & Africa Maize Industry in South Africa Volume Share (%), by Production Analysis (Volume) 2025 & 2033
- Figure 139: Middle East & Africa Maize Industry in South Africa Revenue (Million), by Consumption Analysis (Value and Volume) 2025 & 2033
- Figure 140: Middle East & Africa Maize Industry in South Africa Volume (K Units), by Consumption Analysis (Value and Volume) 2025 & 2033
- Figure 141: Middle East & Africa Maize Industry in South Africa Revenue Share (%), by Consumption Analysis (Value and Volume) 2025 & 2033
- Figure 142: Middle East & Africa Maize Industry in South Africa Volume Share (%), by Consumption Analysis (Value and Volume) 2025 & 2033
- Figure 143: Middle East & Africa Maize Industry in South Africa Revenue (Million), by Import Analysis (Value and Volume) 2025 & 2033
- Figure 144: Middle East & Africa Maize Industry in South Africa Volume (K Units), by Import Analysis (Value and Volume) 2025 & 2033
- Figure 145: Middle East & Africa Maize Industry in South Africa Revenue Share (%), by Import Analysis (Value and Volume) 2025 & 2033
- Figure 146: Middle East & Africa Maize Industry in South Africa Volume Share (%), by Import Analysis (Value and Volume) 2025 & 2033
- Figure 147: Middle East & Africa Maize Industry in South Africa Revenue (Million), by Export Analysis (Value and Volume) 2025 & 2033
- Figure 148: Middle East & Africa Maize Industry in South Africa Volume (K Units), by Export Analysis (Value and Volume) 2025 & 2033
- Figure 149: Middle East & Africa Maize Industry in South Africa Revenue Share (%), by Export Analysis (Value and Volume) 2025 & 2033
- Figure 150: Middle East & Africa Maize Industry in South Africa Volume Share (%), by Export Analysis (Value and Volume) 2025 & 2033
- Figure 151: Middle East & Africa Maize Industry in South Africa Revenue (Million), by Price Trend Analysis 2025 & 2033
- Figure 152: Middle East & Africa Maize Industry in South Africa Volume (K Units), by Price Trend Analysis 2025 & 2033
- Figure 153: Middle East & Africa Maize Industry in South Africa Revenue Share (%), by Price Trend Analysis 2025 & 2033
- Figure 154: Middle East & Africa Maize Industry in South Africa Volume Share (%), by Price Trend Analysis 2025 & 2033
- Figure 155: Middle East & Africa Maize Industry in South Africa Revenue (Million), by Production Analysis (Volume) 2025 & 2033
- Figure 156: Middle East & Africa Maize Industry in South Africa Volume (K Units), by Production Analysis (Volume) 2025 & 2033
- Figure 157: Middle East & Africa Maize Industry in South Africa Revenue Share (%), by Production Analysis (Volume) 2025 & 2033
- Figure 158: Middle East & Africa Maize Industry in South Africa Volume Share (%), by Production Analysis (Volume) 2025 & 2033
- Figure 159: Middle East & Africa Maize Industry in South Africa Revenue (Million), by Consumption Analysis (Value and Volume) 2025 & 2033
- Figure 160: Middle East & Africa Maize Industry in South Africa Volume (K Units), by Consumption Analysis (Value and Volume) 2025 & 2033
- Figure 161: Middle East & Africa Maize Industry in South Africa Revenue Share (%), by Consumption Analysis (Value and Volume) 2025 & 2033
- Figure 162: Middle East & Africa Maize Industry in South Africa Volume Share (%), by Consumption Analysis (Value and Volume) 2025 & 2033
- Figure 163: Middle East & Africa Maize Industry in South Africa Revenue (Million), by Import Analysis (Value and Volume) 2025 & 2033
- Figure 164: Middle East & Africa Maize Industry in South Africa Volume (K Units), by Import Analysis (Value and Volume) 2025 & 2033
- Figure 165: Middle East & Africa Maize Industry in South Africa Revenue Share (%), by Import Analysis (Value and Volume) 2025 & 2033
- Figure 166: Middle East & Africa Maize Industry in South Africa Volume Share (%), by Import Analysis (Value and Volume) 2025 & 2033
- Figure 167: Middle East & Africa Maize Industry in South Africa Revenue (Million), by Export Analysis (Value and Volume) 2025 & 2033
- Figure 168: Middle East & Africa Maize Industry in South Africa Volume (K Units), by Export Analysis (Value and Volume) 2025 & 2033
- Figure 169: Middle East & Africa Maize Industry in South Africa Revenue Share (%), by Export Analysis (Value and Volume) 2025 & 2033
- Figure 170: Middle East & Africa Maize Industry in South Africa Volume Share (%), by Export Analysis (Value and Volume) 2025 & 2033
- Figure 171: Middle East & Africa Maize Industry in South Africa Revenue (Million), by Price Trend Analysis 2025 & 2033
- Figure 172: Middle East & Africa Maize Industry in South Africa Volume (K Units), by Price Trend Analysis 2025 & 2033
- Figure 173: Middle East & Africa Maize Industry in South Africa Revenue Share (%), by Price Trend Analysis 2025 & 2033
- Figure 174: Middle East & Africa Maize Industry in South Africa Volume Share (%), by Price Trend Analysis 2025 & 2033
- Figure 175: Middle East & Africa Maize Industry in South Africa Revenue (Million), by Country 2025 & 2033
- Figure 176: Middle East & Africa Maize Industry in South Africa Volume (K Units), by Country 2025 & 2033
- Figure 177: Middle East & Africa Maize Industry in South Africa Revenue Share (%), by Country 2025 & 2033
- Figure 178: Middle East & Africa Maize Industry in South Africa Volume Share (%), by Country 2025 & 2033
- Figure 179: Asia Pacific Maize Industry in South Africa Revenue (Million), by Production Analysis (Volume) 2025 & 2033
- Figure 180: Asia Pacific Maize Industry in South Africa Volume (K Units), by Production Analysis (Volume) 2025 & 2033
- Figure 181: Asia Pacific Maize Industry in South Africa Revenue Share (%), by Production Analysis (Volume) 2025 & 2033
- Figure 182: Asia Pacific Maize Industry in South Africa Volume Share (%), by Production Analysis (Volume) 2025 & 2033
- Figure 183: Asia Pacific Maize Industry in South Africa Revenue (Million), by Consumption Analysis (Value and Volume) 2025 & 2033
- Figure 184: Asia Pacific Maize Industry in South Africa Volume (K Units), by Consumption Analysis (Value and Volume) 2025 & 2033
- Figure 185: Asia Pacific Maize Industry in South Africa Revenue Share (%), by Consumption Analysis (Value and Volume) 2025 & 2033
- Figure 186: Asia Pacific Maize Industry in South Africa Volume Share (%), by Consumption Analysis (Value and Volume) 2025 & 2033
- Figure 187: Asia Pacific Maize Industry in South Africa Revenue (Million), by Import Analysis (Value and Volume) 2025 & 2033
- Figure 188: Asia Pacific Maize Industry in South Africa Volume (K Units), by Import Analysis (Value and Volume) 2025 & 2033
- Figure 189: Asia Pacific Maize Industry in South Africa Revenue Share (%), by Import Analysis (Value and Volume) 2025 & 2033
- Figure 190: Asia Pacific Maize Industry in South Africa Volume Share (%), by Import Analysis (Value and Volume) 2025 & 2033
- Figure 191: Asia Pacific Maize Industry in South Africa Revenue (Million), by Export Analysis (Value and Volume) 2025 & 2033
- Figure 192: Asia Pacific Maize Industry in South Africa Volume (K Units), by Export Analysis (Value and Volume) 2025 & 2033
- Figure 193: Asia Pacific Maize Industry in South Africa Revenue Share (%), by Export Analysis (Value and Volume) 2025 & 2033
- Figure 194: Asia Pacific Maize Industry in South Africa Volume Share (%), by Export Analysis (Value and Volume) 2025 & 2033
- Figure 195: Asia Pacific Maize Industry in South Africa Revenue (Million), by Price Trend Analysis 2025 & 2033
- Figure 196: Asia Pacific Maize Industry in South Africa Volume (K Units), by Price Trend Analysis 2025 & 2033
- Figure 197: Asia Pacific Maize Industry in South Africa Revenue Share (%), by Price Trend Analysis 2025 & 2033
- Figure 198: Asia Pacific Maize Industry in South Africa Volume Share (%), by Price Trend Analysis 2025 & 2033
- Figure 199: Asia Pacific Maize Industry in South Africa Revenue (Million), by Production Analysis (Volume) 2025 & 2033
- Figure 200: Asia Pacific Maize Industry in South Africa Volume (K Units), by Production Analysis (Volume) 2025 & 2033
- Figure 201: Asia Pacific Maize Industry in South Africa Revenue Share (%), by Production Analysis (Volume) 2025 & 2033
- Figure 202: Asia Pacific Maize Industry in South Africa Volume Share (%), by Production Analysis (Volume) 2025 & 2033
- Figure 203: Asia Pacific Maize Industry in South Africa Revenue (Million), by Consumption Analysis (Value and Volume) 2025 & 2033
- Figure 204: Asia Pacific Maize Industry in South Africa Volume (K Units), by Consumption Analysis (Value and Volume) 2025 & 2033
- Figure 205: Asia Pacific Maize Industry in South Africa Revenue Share (%), by Consumption Analysis (Value and Volume) 2025 & 2033
- Figure 206: Asia Pacific Maize Industry in South Africa Volume Share (%), by Consumption Analysis (Value and Volume) 2025 & 2033
- Figure 207: Asia Pacific Maize Industry in South Africa Revenue (Million), by Import Analysis (Value and Volume) 2025 & 2033
- Figure 208: Asia Pacific Maize Industry in South Africa Volume (K Units), by Import Analysis (Value and Volume) 2025 & 2033
- Figure 209: Asia Pacific Maize Industry in South Africa Revenue Share (%), by Import Analysis (Value and Volume) 2025 & 2033
- Figure 210: Asia Pacific Maize Industry in South Africa Volume Share (%), by Import Analysis (Value and Volume) 2025 & 2033
- Figure 211: Asia Pacific Maize Industry in South Africa Revenue (Million), by Export Analysis (Value and Volume) 2025 & 2033
- Figure 212: Asia Pacific Maize Industry in South Africa Volume (K Units), by Export Analysis (Value and Volume) 2025 & 2033
- Figure 213: Asia Pacific Maize Industry in South Africa Revenue Share (%), by Export Analysis (Value and Volume) 2025 & 2033
- Figure 214: Asia Pacific Maize Industry in South Africa Volume Share (%), by Export Analysis (Value and Volume) 2025 & 2033
- Figure 215: Asia Pacific Maize Industry in South Africa Revenue (Million), by Price Trend Analysis 2025 & 2033
- Figure 216: Asia Pacific Maize Industry in South Africa Volume (K Units), by Price Trend Analysis 2025 & 2033
- Figure 217: Asia Pacific Maize Industry in South Africa Revenue Share (%), by Price Trend Analysis 2025 & 2033
- Figure 218: Asia Pacific Maize Industry in South Africa Volume Share (%), by Price Trend Analysis 2025 & 2033
- Figure 219: Asia Pacific Maize Industry in South Africa Revenue (Million), by Country 2025 & 2033
- Figure 220: Asia Pacific Maize Industry in South Africa Volume (K Units), by Country 2025 & 2033
- Figure 221: Asia Pacific Maize Industry in South Africa Revenue Share (%), by Country 2025 & 2033
- Figure 222: Asia Pacific Maize Industry in South Africa Volume Share (%), by Country 2025 & 2033
List of Tables
- Table 1: Global Maize Industry in South Africa Revenue Million Forecast, by Production Analysis (Volume) 2020 & 2033
- Table 2: Global Maize Industry in South Africa Volume K Units Forecast, by Production Analysis (Volume) 2020 & 2033
- Table 3: Global Maize Industry in South Africa Revenue Million Forecast, by Consumption Analysis (Value and Volume) 2020 & 2033
- Table 4: Global Maize Industry in South Africa Volume K Units Forecast, by Consumption Analysis (Value and Volume) 2020 & 2033
- Table 5: Global Maize Industry in South Africa Revenue Million Forecast, by Import Analysis (Value and Volume) 2020 & 2033
- Table 6: Global Maize Industry in South Africa Volume K Units Forecast, by Import Analysis (Value and Volume) 2020 & 2033
- Table 7: Global Maize Industry in South Africa Revenue Million Forecast, by Export Analysis (Value and Volume) 2020 & 2033
- Table 8: Global Maize Industry in South Africa Volume K Units Forecast, by Export Analysis (Value and Volume) 2020 & 2033
- Table 9: Global Maize Industry in South Africa Revenue Million Forecast, by Price Trend Analysis 2020 & 2033
- Table 10: Global Maize Industry in South Africa Volume K Units Forecast, by Price Trend Analysis 2020 & 2033
- Table 11: Global Maize Industry in South Africa Revenue Million Forecast, by Production Analysis (Volume) 2020 & 2033
- Table 12: Global Maize Industry in South Africa Volume K Units Forecast, by Production Analysis (Volume) 2020 & 2033
- Table 13: Global Maize Industry in South Africa Revenue Million Forecast, by Consumption Analysis (Value and Volume) 2020 & 2033
- Table 14: Global Maize Industry in South Africa Volume K Units Forecast, by Consumption Analysis (Value and Volume) 2020 & 2033
- Table 15: Global Maize Industry in South Africa Revenue Million Forecast, by Import Analysis (Value and Volume) 2020 & 2033
- Table 16: Global Maize Industry in South Africa Volume K Units Forecast, by Import Analysis (Value and Volume) 2020 & 2033
- Table 17: Global Maize Industry in South Africa Revenue Million Forecast, by Export Analysis (Value and Volume) 2020 & 2033
- Table 18: Global Maize Industry in South Africa Volume K Units Forecast, by Export Analysis (Value and Volume) 2020 & 2033
- Table 19: Global Maize Industry in South Africa Revenue Million Forecast, by Price Trend Analysis 2020 & 2033
- Table 20: Global Maize Industry in South Africa Volume K Units Forecast, by Price Trend Analysis 2020 & 2033
- Table 21: Global Maize Industry in South Africa Revenue Million Forecast, by Region 2020 & 2033
- Table 22: Global Maize Industry in South Africa Volume K Units Forecast, by Region 2020 & 2033
- Table 23: Global Maize Industry in South Africa Revenue Million Forecast, by Production Analysis (Volume) 2020 & 2033
- Table 24: Global Maize Industry in South Africa Volume K Units Forecast, by Production Analysis (Volume) 2020 & 2033
- Table 25: Global Maize Industry in South Africa Revenue Million Forecast, by Consumption Analysis (Value and Volume) 2020 & 2033
- Table 26: Global Maize Industry in South Africa Volume K Units Forecast, by Consumption Analysis (Value and Volume) 2020 & 2033
- Table 27: Global Maize Industry in South Africa Revenue Million Forecast, by Import Analysis (Value and Volume) 2020 & 2033
- Table 28: Global Maize Industry in South Africa Volume K Units Forecast, by Import Analysis (Value and Volume) 2020 & 2033
- Table 29: Global Maize Industry in South Africa Revenue Million Forecast, by Export Analysis (Value and Volume) 2020 & 2033
- Table 30: Global Maize Industry in South Africa Volume K Units Forecast, by Export Analysis (Value and Volume) 2020 & 2033
- Table 31: Global Maize Industry in South Africa Revenue Million Forecast, by Price Trend Analysis 2020 & 2033
- Table 32: Global Maize Industry in South Africa Volume K Units Forecast, by Price Trend Analysis 2020 & 2033
- Table 33: Global Maize Industry in South Africa Revenue Million Forecast, by Production Analysis (Volume) 2020 & 2033
- Table 34: Global Maize Industry in South Africa Volume K Units Forecast, by Production Analysis (Volume) 2020 & 2033
- Table 35: Global Maize Industry in South Africa Revenue Million Forecast, by Consumption Analysis (Value and Volume) 2020 & 2033
- Table 36: Global Maize Industry in South Africa Volume K Units Forecast, by Consumption Analysis (Value and Volume) 2020 & 2033
- Table 37: Global Maize Industry in South Africa Revenue Million Forecast, by Import Analysis (Value and Volume) 2020 & 2033
- Table 38: Global Maize Industry in South Africa Volume K Units Forecast, by Import Analysis (Value and Volume) 2020 & 2033
- Table 39: Global Maize Industry in South Africa Revenue Million Forecast, by Export Analysis (Value and Volume) 2020 & 2033
- Table 40: Global Maize Industry in South Africa Volume K Units Forecast, by Export Analysis (Value and Volume) 2020 & 2033
- Table 41: Global Maize Industry in South Africa Revenue Million Forecast, by Price Trend Analysis 2020 & 2033
- Table 42: Global Maize Industry in South Africa Volume K Units Forecast, by Price Trend Analysis 2020 & 2033
- Table 43: Global Maize Industry in South Africa Revenue Million Forecast, by Country 2020 & 2033
- Table 44: Global Maize Industry in South Africa Volume K Units Forecast, by Country 2020 & 2033
- Table 45: United States Maize Industry in South Africa Revenue (Million) Forecast, by Application 2020 & 2033
- Table 46: United States Maize Industry in South Africa Volume (K Units) Forecast, by Application 2020 & 2033
- Table 47: Canada Maize Industry in South Africa Revenue (Million) Forecast, by Application 2020 & 2033
- Table 48: Canada Maize Industry in South Africa Volume (K Units) Forecast, by Application 2020 & 2033
- Table 49: Mexico Maize Industry in South Africa Revenue (Million) Forecast, by Application 2020 & 2033
- Table 50: Mexico Maize Industry in South Africa Volume (K Units) Forecast, by Application 2020 & 2033
- Table 51: Global Maize Industry in South Africa Revenue Million Forecast, by Production Analysis (Volume) 2020 & 2033
- Table 52: Global Maize Industry in South Africa Volume K Units Forecast, by Production Analysis (Volume) 2020 & 2033
- Table 53: Global Maize Industry in South Africa Revenue Million Forecast, by Consumption Analysis (Value and Volume) 2020 & 2033
- Table 54: Global Maize Industry in South Africa Volume K Units Forecast, by Consumption Analysis (Value and Volume) 2020 & 2033
- Table 55: Global Maize Industry in South Africa Revenue Million Forecast, by Import Analysis (Value and Volume) 2020 & 2033
- Table 56: Global Maize Industry in South Africa Volume K Units Forecast, by Import Analysis (Value and Volume) 2020 & 2033
- Table 57: Global Maize Industry in South Africa Revenue Million Forecast, by Export Analysis (Value and Volume) 2020 & 2033
- Table 58: Global Maize Industry in South Africa Volume K Units Forecast, by Export Analysis (Value and Volume) 2020 & 2033
- Table 59: Global Maize Industry in South Africa Revenue Million Forecast, by Price Trend Analysis 2020 & 2033
- Table 60: Global Maize Industry in South Africa Volume K Units Forecast, by Price Trend Analysis 2020 & 2033
- Table 61: Global Maize Industry in South Africa Revenue Million Forecast, by Production Analysis (Volume) 2020 & 2033
- Table 62: Global Maize Industry in South Africa Volume K Units Forecast, by Production Analysis (Volume) 2020 & 2033
- Table 63: Global Maize Industry in South Africa Revenue Million Forecast, by Consumption Analysis (Value and Volume) 2020 & 2033
- Table 64: Global Maize Industry in South Africa Volume K Units Forecast, by Consumption Analysis (Value and Volume) 2020 & 2033
- Table 65: Global Maize Industry in South Africa Revenue Million Forecast, by Import Analysis (Value and Volume) 2020 & 2033
- Table 66: Global Maize Industry in South Africa Volume K Units Forecast, by Import Analysis (Value and Volume) 2020 & 2033
- Table 67: Global Maize Industry in South Africa Revenue Million Forecast, by Export Analysis (Value and Volume) 2020 & 2033
- Table 68: Global Maize Industry in South Africa Volume K Units Forecast, by Export Analysis (Value and Volume) 2020 & 2033
- Table 69: Global Maize Industry in South Africa Revenue Million Forecast, by Price Trend Analysis 2020 & 2033
- Table 70: Global Maize Industry in South Africa Volume K Units Forecast, by Price Trend Analysis 2020 & 2033
- Table 71: Global Maize Industry in South Africa Revenue Million Forecast, by Country 2020 & 2033
- Table 72: Global Maize Industry in South Africa Volume K Units Forecast, by Country 2020 & 2033
- Table 73: Brazil Maize Industry in South Africa Revenue (Million) Forecast, by Application 2020 & 2033
- Table 74: Brazil Maize Industry in South Africa Volume (K Units) Forecast, by Application 2020 & 2033
- Table 75: Argentina Maize Industry in South Africa Revenue (Million) Forecast, by Application 2020 & 2033
- Table 76: Argentina Maize Industry in South Africa Volume (K Units) Forecast, by Application 2020 & 2033
- Table 77: Rest of South America Maize Industry in South Africa Revenue (Million) Forecast, by Application 2020 & 2033
- Table 78: Rest of South America Maize Industry in South Africa Volume (K Units) Forecast, by Application 2020 & 2033
- Table 79: Global Maize Industry in South Africa Revenue Million Forecast, by Production Analysis (Volume) 2020 & 2033
- Table 80: Global Maize Industry in South Africa Volume K Units Forecast, by Production Analysis (Volume) 2020 & 2033
- Table 81: Global Maize Industry in South Africa Revenue Million Forecast, by Consumption Analysis (Value and Volume) 2020 & 2033
- Table 82: Global Maize Industry in South Africa Volume K Units Forecast, by Consumption Analysis (Value and Volume) 2020 & 2033
- Table 83: Global Maize Industry in South Africa Revenue Million Forecast, by Import Analysis (Value and Volume) 2020 & 2033
- Table 84: Global Maize Industry in South Africa Volume K Units Forecast, by Import Analysis (Value and Volume) 2020 & 2033
- Table 85: Global Maize Industry in South Africa Revenue Million Forecast, by Export Analysis (Value and Volume) 2020 & 2033
- Table 86: Global Maize Industry in South Africa Volume K Units Forecast, by Export Analysis (Value and Volume) 2020 & 2033
- Table 87: Global Maize Industry in South Africa Revenue Million Forecast, by Price Trend Analysis 2020 & 2033
- Table 88: Global Maize Industry in South Africa Volume K Units Forecast, by Price Trend Analysis 2020 & 2033
- Table 89: Global Maize Industry in South Africa Revenue Million Forecast, by Production Analysis (Volume) 2020 & 2033
- Table 90: Global Maize Industry in South Africa Volume K Units Forecast, by Production Analysis (Volume) 2020 & 2033
- Table 91: Global Maize Industry in South Africa Revenue Million Forecast, by Consumption Analysis (Value and Volume) 2020 & 2033
- Table 92: Global Maize Industry in South Africa Volume K Units Forecast, by Consumption Analysis (Value and Volume) 2020 & 2033
- Table 93: Global Maize Industry in South Africa Revenue Million Forecast, by Import Analysis (Value and Volume) 2020 & 2033
- Table 94: Global Maize Industry in South Africa Volume K Units Forecast, by Import Analysis (Value and Volume) 2020 & 2033
- Table 95: Global Maize Industry in South Africa Revenue Million Forecast, by Export Analysis (Value and Volume) 2020 & 2033
- Table 96: Global Maize Industry in South Africa Volume K Units Forecast, by Export Analysis (Value and Volume) 2020 & 2033
- Table 97: Global Maize Industry in South Africa Revenue Million Forecast, by Price Trend Analysis 2020 & 2033
- Table 98: Global Maize Industry in South Africa Volume K Units Forecast, by Price Trend Analysis 2020 & 2033
- Table 99: Global Maize Industry in South Africa Revenue Million Forecast, by Country 2020 & 2033
- Table 100: Global Maize Industry in South Africa Volume K Units Forecast, by Country 2020 & 2033
- Table 101: United Kingdom Maize Industry in South Africa Revenue (Million) Forecast, by Application 2020 & 2033
- Table 102: United Kingdom Maize Industry in South Africa Volume (K Units) Forecast, by Application 2020 & 2033
- Table 103: Germany Maize Industry in South Africa Revenue (Million) Forecast, by Application 2020 & 2033
- Table 104: Germany Maize Industry in South Africa Volume (K Units) Forecast, by Application 2020 & 2033
- Table 105: France Maize Industry in South Africa Revenue (Million) Forecast, by Application 2020 & 2033
- Table 106: France Maize Industry in South Africa Volume (K Units) Forecast, by Application 2020 & 2033
- Table 107: Italy Maize Industry in South Africa Revenue (Million) Forecast, by Application 2020 & 2033
- Table 108: Italy Maize Industry in South Africa Volume (K Units) Forecast, by Application 2020 & 2033
- Table 109: Spain Maize Industry in South Africa Revenue (Million) Forecast, by Application 2020 & 2033
- Table 110: Spain Maize Industry in South Africa Volume (K Units) Forecast, by Application 2020 & 2033
- Table 111: Russia Maize Industry in South Africa Revenue (Million) Forecast, by Application 2020 & 2033
- Table 112: Russia Maize Industry in South Africa Volume (K Units) Forecast, by Application 2020 & 2033
- Table 113: Benelux Maize Industry in South Africa Revenue (Million) Forecast, by Application 2020 & 2033
- Table 114: Benelux Maize Industry in South Africa Volume (K Units) Forecast, by Application 2020 & 2033
- Table 115: Nordics Maize Industry in South Africa Revenue (Million) Forecast, by Application 2020 & 2033
- Table 116: Nordics Maize Industry in South Africa Volume (K Units) Forecast, by Application 2020 & 2033
- Table 117: Rest of Europe Maize Industry in South Africa Revenue (Million) Forecast, by Application 2020 & 2033
- Table 118: Rest of Europe Maize Industry in South Africa Volume (K Units) Forecast, by Application 2020 & 2033
- Table 119: Global Maize Industry in South Africa Revenue Million Forecast, by Production Analysis (Volume) 2020 & 2033
- Table 120: Global Maize Industry in South Africa Volume K Units Forecast, by Production Analysis (Volume) 2020 & 2033
- Table 121: Global Maize Industry in South Africa Revenue Million Forecast, by Consumption Analysis (Value and Volume) 2020 & 2033
- Table 122: Global Maize Industry in South Africa Volume K Units Forecast, by Consumption Analysis (Value and Volume) 2020 & 2033
- Table 123: Global Maize Industry in South Africa Revenue Million Forecast, by Import Analysis (Value and Volume) 2020 & 2033
- Table 124: Global Maize Industry in South Africa Volume K Units Forecast, by Import Analysis (Value and Volume) 2020 & 2033
- Table 125: Global Maize Industry in South Africa Revenue Million Forecast, by Export Analysis (Value and Volume) 2020 & 2033
- Table 126: Global Maize Industry in South Africa Volume K Units Forecast, by Export Analysis (Value and Volume) 2020 & 2033
- Table 127: Global Maize Industry in South Africa Revenue Million Forecast, by Price Trend Analysis 2020 & 2033
- Table 128: Global Maize Industry in South Africa Volume K Units Forecast, by Price Trend Analysis 2020 & 2033
- Table 129: Global Maize Industry in South Africa Revenue Million Forecast, by Production Analysis (Volume) 2020 & 2033
- Table 130: Global Maize Industry in South Africa Volume K Units Forecast, by Production Analysis (Volume) 2020 & 2033
- Table 131: Global Maize Industry in South Africa Revenue Million Forecast, by Consumption Analysis (Value and Volume) 2020 & 2033
- Table 132: Global Maize Industry in South Africa Volume K Units Forecast, by Consumption Analysis (Value and Volume) 2020 & 2033
- Table 133: Global Maize Industry in South Africa Revenue Million Forecast, by Import Analysis (Value and Volume) 2020 & 2033
- Table 134: Global Maize Industry in South Africa Volume K Units Forecast, by Import Analysis (Value and Volume) 2020 & 2033
- Table 135: Global Maize Industry in South Africa Revenue Million Forecast, by Export Analysis (Value and Volume) 2020 & 2033
- Table 136: Global Maize Industry in South Africa Volume K Units Forecast, by Export Analysis (Value and Volume) 2020 & 2033
- Table 137: Global Maize Industry in South Africa Revenue Million Forecast, by Price Trend Analysis 2020 & 2033
- Table 138: Global Maize Industry in South Africa Volume K Units Forecast, by Price Trend Analysis 2020 & 2033
- Table 139: Global Maize Industry in South Africa Revenue Million Forecast, by Country 2020 & 2033
- Table 140: Global Maize Industry in South Africa Volume K Units Forecast, by Country 2020 & 2033
- Table 141: Turkey Maize Industry in South Africa Revenue (Million) Forecast, by Application 2020 & 2033
- Table 142: Turkey Maize Industry in South Africa Volume (K Units) Forecast, by Application 2020 & 2033
- Table 143: Israel Maize Industry in South Africa Revenue (Million) Forecast, by Application 2020 & 2033
- Table 144: Israel Maize Industry in South Africa Volume (K Units) Forecast, by Application 2020 & 2033
- Table 145: GCC Maize Industry in South Africa Revenue (Million) Forecast, by Application 2020 & 2033
- Table 146: GCC Maize Industry in South Africa Volume (K Units) Forecast, by Application 2020 & 2033
- Table 147: North Africa Maize Industry in South Africa Revenue (Million) Forecast, by Application 2020 & 2033
- Table 148: North Africa Maize Industry in South Africa Volume (K Units) Forecast, by Application 2020 & 2033
- Table 149: South Africa Maize Industry in South Africa Revenue (Million) Forecast, by Application 2020 & 2033
- Table 150: South Africa Maize Industry in South Africa Volume (K Units) Forecast, by Application 2020 & 2033
- Table 151: Rest of Middle East & Africa Maize Industry in South Africa Revenue (Million) Forecast, by Application 2020 & 2033
- Table 152: Rest of Middle East & Africa Maize Industry in South Africa Volume (K Units) Forecast, by Application 2020 & 2033
- Table 153: Global Maize Industry in South Africa Revenue Million Forecast, by Production Analysis (Volume) 2020 & 2033
- Table 154: Global Maize Industry in South Africa Volume K Units Forecast, by Production Analysis (Volume) 2020 & 2033
- Table 155: Global Maize Industry in South Africa Revenue Million Forecast, by Consumption Analysis (Value and Volume) 2020 & 2033
- Table 156: Global Maize Industry in South Africa Volume K Units Forecast, by Consumption Analysis (Value and Volume) 2020 & 2033
- Table 157: Global Maize Industry in South Africa Revenue Million Forecast, by Import Analysis (Value and Volume) 2020 & 2033
- Table 158: Global Maize Industry in South Africa Volume K Units Forecast, by Import Analysis (Value and Volume) 2020 & 2033
- Table 159: Global Maize Industry in South Africa Revenue Million Forecast, by Export Analysis (Value and Volume) 2020 & 2033
- Table 160: Global Maize Industry in South Africa Volume K Units Forecast, by Export Analysis (Value and Volume) 2020 & 2033
- Table 161: Global Maize Industry in South Africa Revenue Million Forecast, by Price Trend Analysis 2020 & 2033
- Table 162: Global Maize Industry in South Africa Volume K Units Forecast, by Price Trend Analysis 2020 & 2033
- Table 163: Global Maize Industry in South Africa Revenue Million Forecast, by Production Analysis (Volume) 2020 & 2033
- Table 164: Global Maize Industry in South Africa Volume K Units Forecast, by Production Analysis (Volume) 2020 & 2033
- Table 165: Global Maize Industry in South Africa Revenue Million Forecast, by Consumption Analysis (Value and Volume) 2020 & 2033
- Table 166: Global Maize Industry in South Africa Volume K Units Forecast, by Consumption Analysis (Value and Volume) 2020 & 2033
- Table 167: Global Maize Industry in South Africa Revenue Million Forecast, by Import Analysis (Value and Volume) 2020 & 2033
- Table 168: Global Maize Industry in South Africa Volume K Units Forecast, by Import Analysis (Value and Volume) 2020 & 2033
- Table 169: Global Maize Industry in South Africa Revenue Million Forecast, by Export Analysis (Value and Volume) 2020 & 2033
- Table 170: Global Maize Industry in South Africa Volume K Units Forecast, by Export Analysis (Value and Volume) 2020 & 2033
- Table 171: Global Maize Industry in South Africa Revenue Million Forecast, by Price Trend Analysis 2020 & 2033
- Table 172: Global Maize Industry in South Africa Volume K Units Forecast, by Price Trend Analysis 2020 & 2033
- Table 173: Global Maize Industry in South Africa Revenue Million Forecast, by Country 2020 & 2033
- Table 174: Global Maize Industry in South Africa Volume K Units Forecast, by Country 2020 & 2033
- Table 175: China Maize Industry in South Africa Revenue (Million) Forecast, by Application 2020 & 2033
- Table 176: China Maize Industry in South Africa Volume (K Units) Forecast, by Application 2020 & 2033
- Table 177: India Maize Industry in South Africa Revenue (Million) Forecast, by Application 2020 & 2033
- Table 178: India Maize Industry in South Africa Volume (K Units) Forecast, by Application 2020 & 2033
- Table 179: Japan Maize Industry in South Africa Revenue (Million) Forecast, by Application 2020 & 2033
- Table 180: Japan Maize Industry in South Africa Volume (K Units) Forecast, by Application 2020 & 2033
- Table 181: South Korea Maize Industry in South Africa Revenue (Million) Forecast, by Application 2020 & 2033
- Table 182: South Korea Maize Industry in South Africa Volume (K Units) Forecast, by Application 2020 & 2033
- Table 183: ASEAN Maize Industry in South Africa Revenue (Million) Forecast, by Application 2020 & 2033
- Table 184: ASEAN Maize Industry in South Africa Volume (K Units) Forecast, by Application 2020 & 2033
- Table 185: Oceania Maize Industry in South Africa Revenue (Million) Forecast, by Application 2020 & 2033
- Table 186: Oceania Maize Industry in South Africa Volume (K Units) Forecast, by Application 2020 & 2033
- Table 187: Rest of Asia Pacific Maize Industry in South Africa Revenue (Million) Forecast, by Application 2020 & 2033
- Table 188: Rest of Asia Pacific Maize Industry in South Africa Volume (K Units) Forecast, by Application 2020 & 2033
Frequently Asked Questions
1. What is the projected Compound Annual Growth Rate (CAGR) of the Maize Industry in South Africa?
The projected CAGR is approximately 4.00%.
2. Which companies are prominent players in the Maize Industry in South Africa?
Key companies in the market include Pioneer Foods , NWK, Tiger Brands , Astral Foods , AfriSam .
3. What are the main segments of the Maize Industry in South Africa?
The market segments include Production Analysis (Volume), Consumption Analysis (Value and Volume), Import Analysis (Value and Volume), Export Analysis (Value and Volume), Price Trend Analysis, Production Analysis (Volume), Consumption Analysis (Value and Volume), Import Analysis (Value and Volume), Export Analysis (Value and Volume), Price Trend Analysis.
4. Can you provide details about the market size?
The market size is estimated to be USD 2.52 Million as of 2022.
5. What are some drivers contributing to market growth?
N/A
6. What are the notable trends driving market growth?
Increasing Use of Maize in Animal Feed.
7. Are there any restraints impacting market growth?
N/A
8. Can you provide examples of recent developments in the market?
August 2022: The University of the Free State and Grain South Africa entered into a joint venture for developing innovative new food maize products that could boost the nutritional intake of people in South Africa with lower incomes.
9. What pricing options are available for accessing the report?
Pricing options include single-user, multi-user, and enterprise licenses priced at USD 3800, USD 4500, and USD 5800 respectively.
10. Is the market size provided in terms of value or volume?
The market size is provided in terms of value, measured in Million and volume, measured in K Units.
11. Are there any specific market keywords associated with the report?
Yes, the market keyword associated with the report is "Maize Industry in South Africa," which aids in identifying and referencing the specific market segment covered.
12. How do I determine which pricing option suits my needs best?
The pricing options vary based on user requirements and access needs. Individual users may opt for single-user licenses, while businesses requiring broader access may choose multi-user or enterprise licenses for cost-effective access to the report.
13. Are there any additional resources or data provided in the Maize Industry in South Africa report?
While the report offers comprehensive insights, it's advisable to review the specific contents or supplementary materials provided to ascertain if additional resources or data are available.
14. How can I stay updated on further developments or reports in the Maize Industry in South Africa?
To stay informed about further developments, trends, and reports in the Maize Industry in South Africa, consider subscribing to industry newsletters, following relevant companies and organizations, or regularly checking reputable industry news sources and publications.
Methodology
Step 1 - Identification of Relevant Samples Size from Population Database


Step 2 - Approaches for Defining Global Market Size (Value, Volume* & Price*)

Note*: In applicable scenarios
Step 3 - Data Sources
Primary Research
- Web Analytics
- Survey Reports
- Research Institute
- Latest Research Reports
- Opinion Leaders
Secondary Research
- Annual Reports
- White Paper
- Latest Press Release
- Industry Association
- Paid Database
- Investor Presentations

Step 4 - Data Triangulation
Involves using different sources of information in order to increase the validity of a study
These sources are likely to be stakeholders in a program - participants, other researchers, program staff, other community members, and so on.
Then we put all data in single framework & apply various statistical tools to find out the dynamic on the market.
During the analysis stage, feedback from the stakeholder groups would be compared to determine areas of agreement as well as areas of divergence