

Key Insights
The MEA (Middle East and Africa) biofertilizers market, while currently smaller than other regions, exhibits strong growth potential fueled by increasing awareness of sustainable agriculture practices and the need to enhance crop yields in a region often facing water scarcity and challenging soil conditions. The market is segmented by crop type (grains & cereals, pulses & oilseeds, etc.), microorganism type (Rhizobium, Azospirillum, etc.), technology type (liquid, carrier-enriched), and application (soil, seed treatment). Considering the global CAGR of 6.40% and the rising demand for food security in the MEA region, we can estimate a conservative CAGR for the MEA biofertilizers market of 5-7% for the forecast period (2025-2033). This growth is driven by government initiatives promoting sustainable farming, rising disposable incomes leading to increased agricultural investment, and the increasing adoption of advanced farming techniques. However, factors such as limited awareness among farmers about the benefits of biofertilizers, high initial investment costs, and the need for robust distribution networks present challenges to market expansion. The segments likely to show the most significant growth are liquid biofertilizers due to ease of application and grains & cereals due to their widespread cultivation in the region. Key players are focusing on improving product efficacy, expanding distribution networks, and offering tailored solutions to address specific regional needs.
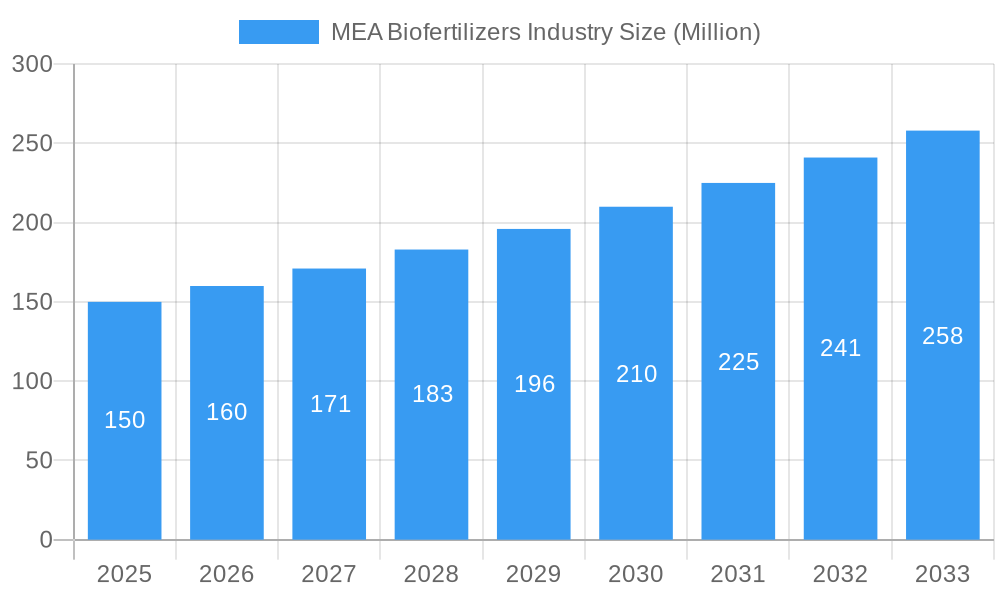
MEA Biofertilizers Industry Market Size (In Million)
The competitive landscape includes both international and regional players, with a focus on expanding market reach and building strong farmer relationships. Successful companies will need to invest in research and development to produce customized biofertilizers for various crops and soil types prevalent in the MEA region. Furthermore, educational programs targeting farmers to increase awareness of biofertilizers' advantages and proper application techniques are crucial for driving wider adoption. A balanced approach combining technological advancements, strategic partnerships, and robust marketing initiatives will be key to unlocking the full potential of the MEA biofertilizers market. The market's trajectory will depend heavily on government support, farmer education, and technological innovations designed for the unique challenges of the MEA agricultural landscape.
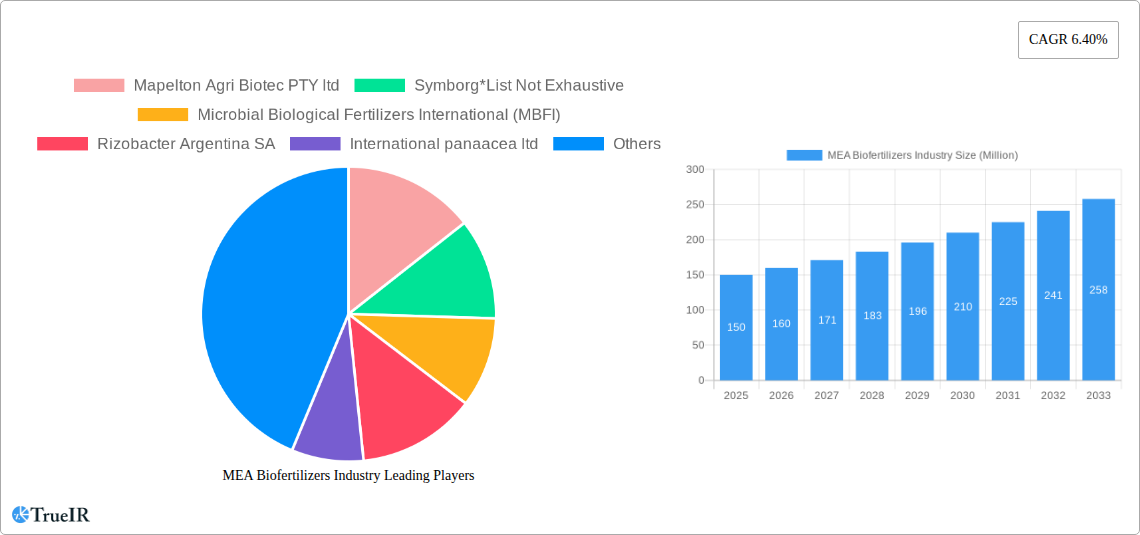
MEA Biofertilizers Industry Company Market Share
MEA Biofertilizers Industry Market Report: 2019-2033
This comprehensive report provides a detailed analysis of the MEA Biofertilizers industry, offering invaluable insights for stakeholders, investors, and industry professionals. Covering the period 2019-2033, with a base year of 2025 and a forecast period of 2025-2033, this report utilizes extensive market research and data analysis to deliver a dynamic understanding of market trends, opportunities, and challenges. The MEA biofertilizers market is projected to reach xx Million by 2033, exhibiting a CAGR of xx% during the forecast period.
MEA Biofertilizers Industry Market Structure & Competitive Landscape
The MEA biofertilizers market exhibits a moderately concentrated structure, with several key players dominating specific segments. The Herfindahl-Hirschman Index (HHI) for the market in 2025 is estimated at xx, indicating a moderately competitive landscape. Innovation is a key driver, with companies continuously developing new biofertilizer formulations and application technologies to cater to evolving agricultural needs and environmental concerns. Regulatory frameworks across MEA countries vary, impacting market entry and product registration. While chemical fertilizers remain a significant competitor, the growing awareness of environmental sustainability and the increasing demand for organic produce are driving the adoption of biofertilizers. Significant mergers and acquisitions (M&A) activity, totaling approximately xx Million in value during 2019-2024, indicate consolidation trends within the industry.
- Market Concentration: HHI of xx in 2025.
- Innovation Drivers: Development of novel biofertilizer formulations, improved application methods.
- Regulatory Impacts: Varying regulations across MEA countries impacting market access.
- Product Substitutes: Chemical fertilizers.
- End-User Segmentation: Predominantly farmers, with a growing segment of large-scale agricultural operations.
- M&A Trends: xx Million in M&A value during 2019-2024.
MEA Biofertilizers Industry Market Trends & Opportunities
The MEA biofertilizers market is experiencing robust growth, driven by several key factors. Increasing awareness of the environmental impact of chemical fertilizers, coupled with government initiatives promoting sustainable agriculture, is significantly boosting demand for eco-friendly alternatives. The market size is expected to reach xx Million by 2033, growing at a CAGR of xx%. Technological advancements in biofertilizer production and application are enhancing product efficacy and reducing costs. Consumer preferences are shifting towards organic and sustainably produced food, further fueling market expansion. Competitive dynamics are marked by both innovation and consolidation, with established players and new entrants vying for market share. The market penetration rate for biofertilizers in MEA is currently estimated at xx%, with significant potential for future growth.
Dominant Markets & Segments in MEA Biofertilizers Industry
The Grains and Cereals segment currently dominates the MEA biofertilizer market, accounting for approximately xx% of total market share in 2025. Within microorganism types, Rhizobium and Phosphate Solubilizing Bacteria are the most widely used, driven by their effectiveness in enhancing nitrogen and phosphorus uptake in crops. Liquid biofertilizers hold the largest technology segment share, due to their ease of application and higher efficacy. Soil treatment is the primary application method.
- Leading Regions/Countries: [Specific country analysis with supporting data needed here. Example: Egypt holds the largest market share, followed by…]
- Leading Segments: Grains and Cereals (Crop Type); Rhizobium & Phosphate Solubilizing Bacteria (Microorganism Type); Liquid Biofertilizers (Technology Type); Soil Treatment (Application).
- Key Growth Drivers:
- Government initiatives promoting sustainable agriculture.
- Increasing consumer demand for organic produce.
- Rising awareness of environmental concerns related to chemical fertilizers.
- Technological advancements in biofertilizer production and application.
MEA Biofertilizers Industry Product Analysis
Product innovation is a key competitive factor, with companies focusing on developing biofertilizers with enhanced efficacy, shelf life, and ease of application. The market is witnessing a rise in carrier-enriched and liquid formulations, offering superior performance compared to traditional powder-based products. The development of customized biofertilizers tailored to specific crop needs and soil conditions is also gaining traction, adding to product differentiation and market appeal.
Key Drivers, Barriers & Challenges in MEA Biofertilizers Industry
Key Drivers: Favorable government policies, rising awareness about environmental sustainability, increasing demand for organic produce, and technological innovations in biofertilizer production and delivery mechanisms are driving market growth.
Challenges: High initial investment costs, lack of awareness among farmers in some regions, inconsistent quality control in the industry, and the presence of substitute chemical fertilizers are key restraints. Furthermore, complexities in regulatory approvals and limited access to funding can impede market expansion. The supply chain often lacks efficiency, limiting product accessibility and affordability.
Growth Drivers in the MEA Biofertilizers Industry Market
Government support through subsidies and awareness campaigns, growing consumer preference for organic food, and technological advancements in biofertilizer formulations are key factors propelling market growth. Furthermore, the increasing awareness among farmers about the long-term benefits of biofertilizers is also contributing to market expansion.
Challenges Impacting MEA Biofertilizers Industry Growth
Stringent regulatory requirements and lack of standardized quality control pose significant challenges. Supply chain inefficiencies, leading to high transportation and storage costs, further hinder market expansion. Competition from established chemical fertilizer companies and limited access to finance for small and medium enterprises (SMEs) also represent significant hurdles.
Key Players Shaping the MEA Biofertilizers Industry Market
- Mapelton Agri Biotec PTY ltd
- Symborg*List Not Exhaustive
- Microbial Biological Fertilizers International (MBFI)
- Rizobacter Argentina SA
- International panacea ltd
- Agrilife
Significant MEA Biofertilizers Industry Industry Milestones
- 2020: Introduction of a new, highly effective Rhizobium-based biofertilizer by [Company Name].
- 2022: Launch of a government-sponsored awareness campaign promoting the adoption of biofertilizers in [Country Name].
- 2023: Merger between two key players in the Moroccan biofertilizer market, resulting in increased market consolidation.
- [Further milestones to be added as data becomes available]
Future Outlook for MEA Biofertilizers Industry Market
The MEA biofertilizers market is poised for significant growth in the coming years, driven by strong government support, increasing consumer demand for sustainable agriculture, and technological advancements leading to more efficient and cost-effective biofertilizers. Strategic partnerships between industry players and research institutions will be crucial in driving innovation and market expansion. The focus on developing region-specific biofertilizers to address local soil conditions and crop needs will be a key area of opportunity.
MEA Biofertilizers Industry Segmentation
- 1. Production Analysis
- 2. Consumption Analysis
- 3. Import Market Analysis (Value & Volume)
- 4. Export Market Analysis (Value & Volume)
- 5. Price Trend Analysis
MEA Biofertilizers Industry Segmentation By Geography
-
1. North America
- 1.1. United States
- 1.2. Canada
- 1.3. Mexico
-
2. South America
- 2.1. Brazil
- 2.2. Argentina
- 2.3. Rest of South America
-
3. Europe
- 3.1. United Kingdom
- 3.2. Germany
- 3.3. France
- 3.4. Italy
- 3.5. Spain
- 3.6. Russia
- 3.7. Benelux
- 3.8. Nordics
- 3.9. Rest of Europe
-
4. Middle East & Africa
- 4.1. Turkey
- 4.2. Israel
- 4.3. GCC
- 4.4. North Africa
- 4.5. South Africa
- 4.6. Rest of Middle East & Africa
-
5. Asia Pacific
- 5.1. China
- 5.2. India
- 5.3. Japan
- 5.4. South Korea
- 5.5. ASEAN
- 5.6. Oceania
- 5.7. Rest of Asia Pacific
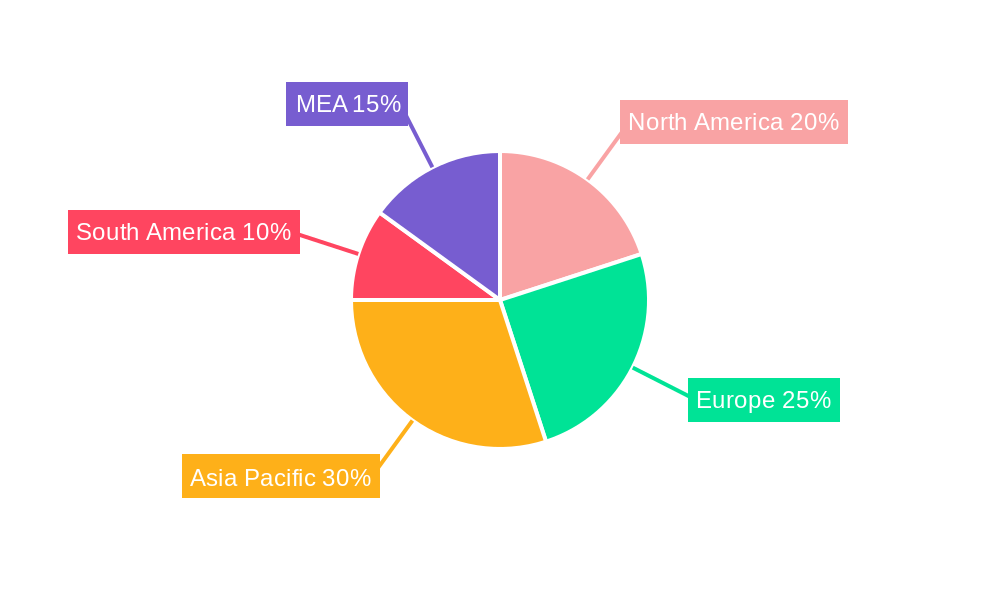
MEA Biofertilizers Industry Regional Market Share
Geographic Coverage of MEA Biofertilizers Industry
MEA Biofertilizers Industry REPORT HIGHLIGHTS
| Aspects | Details |
|---|---|
| Study Period | 2020-2034 |
| Base Year | 2025 |
| Estimated Year | 2026 |
| Forecast Period | 2026-2034 |
| Historical Period | 2020-2025 |
| Growth Rate | CAGR of 13.4% from 2020-2034 |
| Segmentation |
|
Table of Contents
- 1. Introduction
- 1.1. Research Scope
- 1.2. Market Segmentation
- 1.3. Research Objective
- 1.4. Definitions and Assumptions
- 2. Executive Summary
- 2.1. Market Snapshot
- 3. Market Dynamics
- 3.1. Market Drivers
- 3.2. Market Restrains
- 3.3. Market Trends
- 3.4. Market Opportunities
- 4. Market Factor Analysis
- 4.1. Porters Five Forces
- 4.1.1. Bargaining Power of Suppliers
- 4.1.2. Bargaining Power of Buyers
- 4.1.3. Threat of New Entrants
- 4.1.4. Threat of Substitutes
- 4.1.5. Competitive Rivalry
- 4.2. PESTEL analysis
- 4.3. BCG Analysis
- 4.3.1. Stars (High Growth, High Market Share)
- 4.3.2. Cash Cows (Low Growth, High Market Share)
- 4.3.3. Question Mark (High Growth, Low Market Share)
- 4.3.4. Dogs (Low Growth, Low Market Share)
- 4.4. Ansoff Matrix Analysis
- 4.5. Supply Chain Analysis
- 4.6. Regulatory Landscape
- 4.7. Current Market Potential and Opportunity Assessment (TAM–SAM–SOM Framework)
- 4.8. TIR Analyst Note
- 4.1. Porters Five Forces
- 5. Market Analysis, Insights and Forecast 2021-2033
- 5.1. Market Analysis, Insights and Forecast - by Production Analysis
- 5.2. Market Analysis, Insights and Forecast - by Consumption Analysis
- 5.3. Market Analysis, Insights and Forecast - by Import Market Analysis (Value & Volume)
- 5.4. Market Analysis, Insights and Forecast - by Export Market Analysis (Value & Volume)
- 5.5. Market Analysis, Insights and Forecast - by Price Trend Analysis
- 5.6. Market Analysis, Insights and Forecast - by Region
- 5.6.1. North America
- 5.6.2. South America
- 5.6.3. Europe
- 5.6.4. Middle East & Africa
- 5.6.5. Asia Pacific
- 6. Global MEA Biofertilizers Industry Analysis, Insights and Forecast, 2021-2033
- 6.1. Market Analysis, Insights and Forecast - by Production Analysis
- 6.2. Market Analysis, Insights and Forecast - by Consumption Analysis
- 6.3. Market Analysis, Insights and Forecast - by Import Market Analysis (Value & Volume)
- 6.4. Market Analysis, Insights and Forecast - by Export Market Analysis (Value & Volume)
- 6.5. Market Analysis, Insights and Forecast - by Price Trend Analysis
- 7. North America MEA Biofertilizers Industry Analysis, Insights and Forecast, 2020-2032
- 7.1. Market Analysis, Insights and Forecast - by Production Analysis
- 7.2. Market Analysis, Insights and Forecast - by Consumption Analysis
- 7.3. Market Analysis, Insights and Forecast - by Import Market Analysis (Value & Volume)
- 7.4. Market Analysis, Insights and Forecast - by Export Market Analysis (Value & Volume)
- 7.5. Market Analysis, Insights and Forecast - by Price Trend Analysis
- 8. South America MEA Biofertilizers Industry Analysis, Insights and Forecast, 2020-2032
- 8.1. Market Analysis, Insights and Forecast - by Production Analysis
- 8.2. Market Analysis, Insights and Forecast - by Consumption Analysis
- 8.3. Market Analysis, Insights and Forecast - by Import Market Analysis (Value & Volume)
- 8.4. Market Analysis, Insights and Forecast - by Export Market Analysis (Value & Volume)
- 8.5. Market Analysis, Insights and Forecast - by Price Trend Analysis
- 9. Europe MEA Biofertilizers Industry Analysis, Insights and Forecast, 2020-2032
- 9.1. Market Analysis, Insights and Forecast - by Production Analysis
- 9.2. Market Analysis, Insights and Forecast - by Consumption Analysis
- 9.3. Market Analysis, Insights and Forecast - by Import Market Analysis (Value & Volume)
- 9.4. Market Analysis, Insights and Forecast - by Export Market Analysis (Value & Volume)
- 9.5. Market Analysis, Insights and Forecast - by Price Trend Analysis
- 10. Middle East & Africa MEA Biofertilizers Industry Analysis, Insights and Forecast, 2020-2032
- 10.1. Market Analysis, Insights and Forecast - by Production Analysis
- 10.2. Market Analysis, Insights and Forecast - by Consumption Analysis
- 10.3. Market Analysis, Insights and Forecast - by Import Market Analysis (Value & Volume)
- 10.4. Market Analysis, Insights and Forecast - by Export Market Analysis (Value & Volume)
- 10.5. Market Analysis, Insights and Forecast - by Price Trend Analysis
- 11. Asia Pacific MEA Biofertilizers Industry Analysis, Insights and Forecast, 2020-2032
- 11.1. Market Analysis, Insights and Forecast - by Production Analysis
- 11.2. Market Analysis, Insights and Forecast - by Consumption Analysis
- 11.3. Market Analysis, Insights and Forecast - by Import Market Analysis (Value & Volume)
- 11.4. Market Analysis, Insights and Forecast - by Export Market Analysis (Value & Volume)
- 11.5. Market Analysis, Insights and Forecast - by Price Trend Analysis
- 12. Competitive Analysis
- 12.1. Company Profiles
- 12.1.1 Mapelton Agri Biotec PTY ltd
- 12.1.1.1. Company Overview
- 12.1.1.2. Products
- 12.1.1.3. Company Financials
- 12.1.1.4. SWOT Analysis
- 12.1.2 Symborg*List Not Exhaustive
- 12.1.2.1. Company Overview
- 12.1.2.2. Products
- 12.1.2.3. Company Financials
- 12.1.2.4. SWOT Analysis
- 12.1.3 Microbial Biological Fertilizers International (MBFI)
- 12.1.3.1. Company Overview
- 12.1.3.2. Products
- 12.1.3.3. Company Financials
- 12.1.3.4. SWOT Analysis
- 12.1.4 Rizobacter Argentina SA
- 12.1.4.1. Company Overview
- 12.1.4.2. Products
- 12.1.4.3. Company Financials
- 12.1.4.4. SWOT Analysis
- 12.1.5 International panaacea ltd
- 12.1.5.1. Company Overview
- 12.1.5.2. Products
- 12.1.5.3. Company Financials
- 12.1.5.4. SWOT Analysis
- 12.1.6 Agrilife
- 12.1.6.1. Company Overview
- 12.1.6.2. Products
- 12.1.6.3. Company Financials
- 12.1.6.4. SWOT Analysis
- 12.1.1 Mapelton Agri Biotec PTY ltd
- 12.2. Market Entropy
- 12.2.1 Company's Key Areas Served
- 12.2.2 Recent Developments
- 12.3. Company Market Share Analysis 2025
- 12.3.1 Top 5 Companies Market Share Analysis
- 12.3.2 Top 3 Companies Market Share Analysis
- 12.4. List of Potential Customers
- 13. Research Methodology
List of Figures
- Figure 1: Global MEA Biofertilizers Industry Revenue Breakdown (billion, %) by Region 2025 & 2033
- Figure 2: North America MEA Biofertilizers Industry Revenue (billion), by Production Analysis 2025 & 2033
- Figure 3: North America MEA Biofertilizers Industry Revenue Share (%), by Production Analysis 2025 & 2033
- Figure 4: North America MEA Biofertilizers Industry Revenue (billion), by Consumption Analysis 2025 & 2033
- Figure 5: North America MEA Biofertilizers Industry Revenue Share (%), by Consumption Analysis 2025 & 2033
- Figure 6: North America MEA Biofertilizers Industry Revenue (billion), by Import Market Analysis (Value & Volume) 2025 & 2033
- Figure 7: North America MEA Biofertilizers Industry Revenue Share (%), by Import Market Analysis (Value & Volume) 2025 & 2033
- Figure 8: North America MEA Biofertilizers Industry Revenue (billion), by Export Market Analysis (Value & Volume) 2025 & 2033
- Figure 9: North America MEA Biofertilizers Industry Revenue Share (%), by Export Market Analysis (Value & Volume) 2025 & 2033
- Figure 10: North America MEA Biofertilizers Industry Revenue (billion), by Price Trend Analysis 2025 & 2033
- Figure 11: North America MEA Biofertilizers Industry Revenue Share (%), by Price Trend Analysis 2025 & 2033
- Figure 12: North America MEA Biofertilizers Industry Revenue (billion), by Country 2025 & 2033
- Figure 13: North America MEA Biofertilizers Industry Revenue Share (%), by Country 2025 & 2033
- Figure 14: South America MEA Biofertilizers Industry Revenue (billion), by Production Analysis 2025 & 2033
- Figure 15: South America MEA Biofertilizers Industry Revenue Share (%), by Production Analysis 2025 & 2033
- Figure 16: South America MEA Biofertilizers Industry Revenue (billion), by Consumption Analysis 2025 & 2033
- Figure 17: South America MEA Biofertilizers Industry Revenue Share (%), by Consumption Analysis 2025 & 2033
- Figure 18: South America MEA Biofertilizers Industry Revenue (billion), by Import Market Analysis (Value & Volume) 2025 & 2033
- Figure 19: South America MEA Biofertilizers Industry Revenue Share (%), by Import Market Analysis (Value & Volume) 2025 & 2033
- Figure 20: South America MEA Biofertilizers Industry Revenue (billion), by Export Market Analysis (Value & Volume) 2025 & 2033
- Figure 21: South America MEA Biofertilizers Industry Revenue Share (%), by Export Market Analysis (Value & Volume) 2025 & 2033
- Figure 22: South America MEA Biofertilizers Industry Revenue (billion), by Price Trend Analysis 2025 & 2033
- Figure 23: South America MEA Biofertilizers Industry Revenue Share (%), by Price Trend Analysis 2025 & 2033
- Figure 24: South America MEA Biofertilizers Industry Revenue (billion), by Country 2025 & 2033
- Figure 25: South America MEA Biofertilizers Industry Revenue Share (%), by Country 2025 & 2033
- Figure 26: Europe MEA Biofertilizers Industry Revenue (billion), by Production Analysis 2025 & 2033
- Figure 27: Europe MEA Biofertilizers Industry Revenue Share (%), by Production Analysis 2025 & 2033
- Figure 28: Europe MEA Biofertilizers Industry Revenue (billion), by Consumption Analysis 2025 & 2033
- Figure 29: Europe MEA Biofertilizers Industry Revenue Share (%), by Consumption Analysis 2025 & 2033
- Figure 30: Europe MEA Biofertilizers Industry Revenue (billion), by Import Market Analysis (Value & Volume) 2025 & 2033
- Figure 31: Europe MEA Biofertilizers Industry Revenue Share (%), by Import Market Analysis (Value & Volume) 2025 & 2033
- Figure 32: Europe MEA Biofertilizers Industry Revenue (billion), by Export Market Analysis (Value & Volume) 2025 & 2033
- Figure 33: Europe MEA Biofertilizers Industry Revenue Share (%), by Export Market Analysis (Value & Volume) 2025 & 2033
- Figure 34: Europe MEA Biofertilizers Industry Revenue (billion), by Price Trend Analysis 2025 & 2033
- Figure 35: Europe MEA Biofertilizers Industry Revenue Share (%), by Price Trend Analysis 2025 & 2033
- Figure 36: Europe MEA Biofertilizers Industry Revenue (billion), by Country 2025 & 2033
- Figure 37: Europe MEA Biofertilizers Industry Revenue Share (%), by Country 2025 & 2033
- Figure 38: Middle East & Africa MEA Biofertilizers Industry Revenue (billion), by Production Analysis 2025 & 2033
- Figure 39: Middle East & Africa MEA Biofertilizers Industry Revenue Share (%), by Production Analysis 2025 & 2033
- Figure 40: Middle East & Africa MEA Biofertilizers Industry Revenue (billion), by Consumption Analysis 2025 & 2033
- Figure 41: Middle East & Africa MEA Biofertilizers Industry Revenue Share (%), by Consumption Analysis 2025 & 2033
- Figure 42: Middle East & Africa MEA Biofertilizers Industry Revenue (billion), by Import Market Analysis (Value & Volume) 2025 & 2033
- Figure 43: Middle East & Africa MEA Biofertilizers Industry Revenue Share (%), by Import Market Analysis (Value & Volume) 2025 & 2033
- Figure 44: Middle East & Africa MEA Biofertilizers Industry Revenue (billion), by Export Market Analysis (Value & Volume) 2025 & 2033
- Figure 45: Middle East & Africa MEA Biofertilizers Industry Revenue Share (%), by Export Market Analysis (Value & Volume) 2025 & 2033
- Figure 46: Middle East & Africa MEA Biofertilizers Industry Revenue (billion), by Price Trend Analysis 2025 & 2033
- Figure 47: Middle East & Africa MEA Biofertilizers Industry Revenue Share (%), by Price Trend Analysis 2025 & 2033
- Figure 48: Middle East & Africa MEA Biofertilizers Industry Revenue (billion), by Country 2025 & 2033
- Figure 49: Middle East & Africa MEA Biofertilizers Industry Revenue Share (%), by Country 2025 & 2033
- Figure 50: Asia Pacific MEA Biofertilizers Industry Revenue (billion), by Production Analysis 2025 & 2033
- Figure 51: Asia Pacific MEA Biofertilizers Industry Revenue Share (%), by Production Analysis 2025 & 2033
- Figure 52: Asia Pacific MEA Biofertilizers Industry Revenue (billion), by Consumption Analysis 2025 & 2033
- Figure 53: Asia Pacific MEA Biofertilizers Industry Revenue Share (%), by Consumption Analysis 2025 & 2033
- Figure 54: Asia Pacific MEA Biofertilizers Industry Revenue (billion), by Import Market Analysis (Value & Volume) 2025 & 2033
- Figure 55: Asia Pacific MEA Biofertilizers Industry Revenue Share (%), by Import Market Analysis (Value & Volume) 2025 & 2033
- Figure 56: Asia Pacific MEA Biofertilizers Industry Revenue (billion), by Export Market Analysis (Value & Volume) 2025 & 2033
- Figure 57: Asia Pacific MEA Biofertilizers Industry Revenue Share (%), by Export Market Analysis (Value & Volume) 2025 & 2033
- Figure 58: Asia Pacific MEA Biofertilizers Industry Revenue (billion), by Price Trend Analysis 2025 & 2033
- Figure 59: Asia Pacific MEA Biofertilizers Industry Revenue Share (%), by Price Trend Analysis 2025 & 2033
- Figure 60: Asia Pacific MEA Biofertilizers Industry Revenue (billion), by Country 2025 & 2033
- Figure 61: Asia Pacific MEA Biofertilizers Industry Revenue Share (%), by Country 2025 & 2033
List of Tables
- Table 1: Global MEA Biofertilizers Industry Revenue billion Forecast, by Production Analysis 2020 & 2033
- Table 2: Global MEA Biofertilizers Industry Revenue billion Forecast, by Consumption Analysis 2020 & 2033
- Table 3: Global MEA Biofertilizers Industry Revenue billion Forecast, by Import Market Analysis (Value & Volume) 2020 & 2033
- Table 4: Global MEA Biofertilizers Industry Revenue billion Forecast, by Export Market Analysis (Value & Volume) 2020 & 2033
- Table 5: Global MEA Biofertilizers Industry Revenue billion Forecast, by Price Trend Analysis 2020 & 2033
- Table 6: Global MEA Biofertilizers Industry Revenue billion Forecast, by Region 2020 & 2033
- Table 7: Global MEA Biofertilizers Industry Revenue billion Forecast, by Production Analysis 2020 & 2033
- Table 8: Global MEA Biofertilizers Industry Revenue billion Forecast, by Consumption Analysis 2020 & 2033
- Table 9: Global MEA Biofertilizers Industry Revenue billion Forecast, by Import Market Analysis (Value & Volume) 2020 & 2033
- Table 10: Global MEA Biofertilizers Industry Revenue billion Forecast, by Export Market Analysis (Value & Volume) 2020 & 2033
- Table 11: Global MEA Biofertilizers Industry Revenue billion Forecast, by Price Trend Analysis 2020 & 2033
- Table 12: Global MEA Biofertilizers Industry Revenue billion Forecast, by Country 2020 & 2033
- Table 13: United States MEA Biofertilizers Industry Revenue (billion) Forecast, by Application 2020 & 2033
- Table 14: Canada MEA Biofertilizers Industry Revenue (billion) Forecast, by Application 2020 & 2033
- Table 15: Mexico MEA Biofertilizers Industry Revenue (billion) Forecast, by Application 2020 & 2033
- Table 16: Global MEA Biofertilizers Industry Revenue billion Forecast, by Production Analysis 2020 & 2033
- Table 17: Global MEA Biofertilizers Industry Revenue billion Forecast, by Consumption Analysis 2020 & 2033
- Table 18: Global MEA Biofertilizers Industry Revenue billion Forecast, by Import Market Analysis (Value & Volume) 2020 & 2033
- Table 19: Global MEA Biofertilizers Industry Revenue billion Forecast, by Export Market Analysis (Value & Volume) 2020 & 2033
- Table 20: Global MEA Biofertilizers Industry Revenue billion Forecast, by Price Trend Analysis 2020 & 2033
- Table 21: Global MEA Biofertilizers Industry Revenue billion Forecast, by Country 2020 & 2033
- Table 22: Brazil MEA Biofertilizers Industry Revenue (billion) Forecast, by Application 2020 & 2033
- Table 23: Argentina MEA Biofertilizers Industry Revenue (billion) Forecast, by Application 2020 & 2033
- Table 24: Rest of South America MEA Biofertilizers Industry Revenue (billion) Forecast, by Application 2020 & 2033
- Table 25: Global MEA Biofertilizers Industry Revenue billion Forecast, by Production Analysis 2020 & 2033
- Table 26: Global MEA Biofertilizers Industry Revenue billion Forecast, by Consumption Analysis 2020 & 2033
- Table 27: Global MEA Biofertilizers Industry Revenue billion Forecast, by Import Market Analysis (Value & Volume) 2020 & 2033
- Table 28: Global MEA Biofertilizers Industry Revenue billion Forecast, by Export Market Analysis (Value & Volume) 2020 & 2033
- Table 29: Global MEA Biofertilizers Industry Revenue billion Forecast, by Price Trend Analysis 2020 & 2033
- Table 30: Global MEA Biofertilizers Industry Revenue billion Forecast, by Country 2020 & 2033
- Table 31: United Kingdom MEA Biofertilizers Industry Revenue (billion) Forecast, by Application 2020 & 2033
- Table 32: Germany MEA Biofertilizers Industry Revenue (billion) Forecast, by Application 2020 & 2033
- Table 33: France MEA Biofertilizers Industry Revenue (billion) Forecast, by Application 2020 & 2033
- Table 34: Italy MEA Biofertilizers Industry Revenue (billion) Forecast, by Application 2020 & 2033
- Table 35: Spain MEA Biofertilizers Industry Revenue (billion) Forecast, by Application 2020 & 2033
- Table 36: Russia MEA Biofertilizers Industry Revenue (billion) Forecast, by Application 2020 & 2033
- Table 37: Benelux MEA Biofertilizers Industry Revenue (billion) Forecast, by Application 2020 & 2033
- Table 38: Nordics MEA Biofertilizers Industry Revenue (billion) Forecast, by Application 2020 & 2033
- Table 39: Rest of Europe MEA Biofertilizers Industry Revenue (billion) Forecast, by Application 2020 & 2033
- Table 40: Global MEA Biofertilizers Industry Revenue billion Forecast, by Production Analysis 2020 & 2033
- Table 41: Global MEA Biofertilizers Industry Revenue billion Forecast, by Consumption Analysis 2020 & 2033
- Table 42: Global MEA Biofertilizers Industry Revenue billion Forecast, by Import Market Analysis (Value & Volume) 2020 & 2033
- Table 43: Global MEA Biofertilizers Industry Revenue billion Forecast, by Export Market Analysis (Value & Volume) 2020 & 2033
- Table 44: Global MEA Biofertilizers Industry Revenue billion Forecast, by Price Trend Analysis 2020 & 2033
- Table 45: Global MEA Biofertilizers Industry Revenue billion Forecast, by Country 2020 & 2033
- Table 46: Turkey MEA Biofertilizers Industry Revenue (billion) Forecast, by Application 2020 & 2033
- Table 47: Israel MEA Biofertilizers Industry Revenue (billion) Forecast, by Application 2020 & 2033
- Table 48: GCC MEA Biofertilizers Industry Revenue (billion) Forecast, by Application 2020 & 2033
- Table 49: North Africa MEA Biofertilizers Industry Revenue (billion) Forecast, by Application 2020 & 2033
- Table 50: South Africa MEA Biofertilizers Industry Revenue (billion) Forecast, by Application 2020 & 2033
- Table 51: Rest of Middle East & Africa MEA Biofertilizers Industry Revenue (billion) Forecast, by Application 2020 & 2033
- Table 52: Global MEA Biofertilizers Industry Revenue billion Forecast, by Production Analysis 2020 & 2033
- Table 53: Global MEA Biofertilizers Industry Revenue billion Forecast, by Consumption Analysis 2020 & 2033
- Table 54: Global MEA Biofertilizers Industry Revenue billion Forecast, by Import Market Analysis (Value & Volume) 2020 & 2033
- Table 55: Global MEA Biofertilizers Industry Revenue billion Forecast, by Export Market Analysis (Value & Volume) 2020 & 2033
- Table 56: Global MEA Biofertilizers Industry Revenue billion Forecast, by Price Trend Analysis 2020 & 2033
- Table 57: Global MEA Biofertilizers Industry Revenue billion Forecast, by Country 2020 & 2033
- Table 58: China MEA Biofertilizers Industry Revenue (billion) Forecast, by Application 2020 & 2033
- Table 59: India MEA Biofertilizers Industry Revenue (billion) Forecast, by Application 2020 & 2033
- Table 60: Japan MEA Biofertilizers Industry Revenue (billion) Forecast, by Application 2020 & 2033
- Table 61: South Korea MEA Biofertilizers Industry Revenue (billion) Forecast, by Application 2020 & 2033
- Table 62: ASEAN MEA Biofertilizers Industry Revenue (billion) Forecast, by Application 2020 & 2033
- Table 63: Oceania MEA Biofertilizers Industry Revenue (billion) Forecast, by Application 2020 & 2033
- Table 64: Rest of Asia Pacific MEA Biofertilizers Industry Revenue (billion) Forecast, by Application 2020 & 2033
Frequently Asked Questions
1. What is the projected Compound Annual Growth Rate (CAGR) of the MEA Biofertilizers Industry?
The projected CAGR is approximately 13.4%.
2. Which companies are prominent players in the MEA Biofertilizers Industry?
Key companies in the market include Mapelton Agri Biotec PTY ltd, Symborg*List Not Exhaustive, Microbial Biological Fertilizers International (MBFI), Rizobacter Argentina SA, International panaacea ltd, Agrilife.
3. What are the main segments of the MEA Biofertilizers Industry?
The market segments include Production Analysis, Consumption Analysis, Import Market Analysis (Value & Volume), Export Market Analysis (Value & Volume), Price Trend Analysis.
4. Can you provide details about the market size?
The market size is estimated to be USD 2.1 billion as of 2022.
5. What are some drivers contributing to market growth?
Seed Treatment As A Solution To Enhance Yield; Growing Awareness For Seed Treatment Among The Farmers; Rising Trend Of Organic Farming.
6. What are the notable trends driving market growth?
Increased Food Demand and Need for Sustainable Agricultural Development.
7. Are there any restraints impacting market growth?
Limitations Across Farm-Level Seed Treatment; Rising Environmental Concerns.
8. Can you provide examples of recent developments in the market?
N/A
9. What pricing options are available for accessing the report?
Pricing options include single-user, multi-user, and enterprise licenses priced at USD 4750, USD 5250, and USD 8750 respectively.
10. Is the market size provided in terms of value or volume?
The market size is provided in terms of value, measured in billion.
11. Are there any specific market keywords associated with the report?
Yes, the market keyword associated with the report is "MEA Biofertilizers Industry," which aids in identifying and referencing the specific market segment covered.
12. How do I determine which pricing option suits my needs best?
The pricing options vary based on user requirements and access needs. Individual users may opt for single-user licenses, while businesses requiring broader access may choose multi-user or enterprise licenses for cost-effective access to the report.
13. Are there any additional resources or data provided in the MEA Biofertilizers Industry report?
While the report offers comprehensive insights, it's advisable to review the specific contents or supplementary materials provided to ascertain if additional resources or data are available.
14. How can I stay updated on further developments or reports in the MEA Biofertilizers Industry?
To stay informed about further developments, trends, and reports in the MEA Biofertilizers Industry, consider subscribing to industry newsletters, following relevant companies and organizations, or regularly checking reputable industry news sources and publications.
Methodology
Step 1 - Identification of Relevant Samples Size from Population Database


Step 2 - Approaches for Defining Global Market Size (Value, Volume* & Price*)

Note*: In applicable scenarios
Step 3 - Data Sources
Primary Research
- Web Analytics
- Survey Reports
- Research Institute
- Latest Research Reports
- Opinion Leaders
Secondary Research
- Annual Reports
- White Paper
- Latest Press Release
- Industry Association
- Paid Database
- Investor Presentations

Step 4 - Data Triangulation
Involves using different sources of information in order to increase the validity of a study
These sources are likely to be stakeholders in a program - participants, other researchers, program staff, other community members, and so on.
Then we put all data in single framework & apply various statistical tools to find out the dynamic on the market.
During the analysis stage, feedback from the stakeholder groups would be compared to determine areas of agreement as well as areas of divergence