

Key Insights
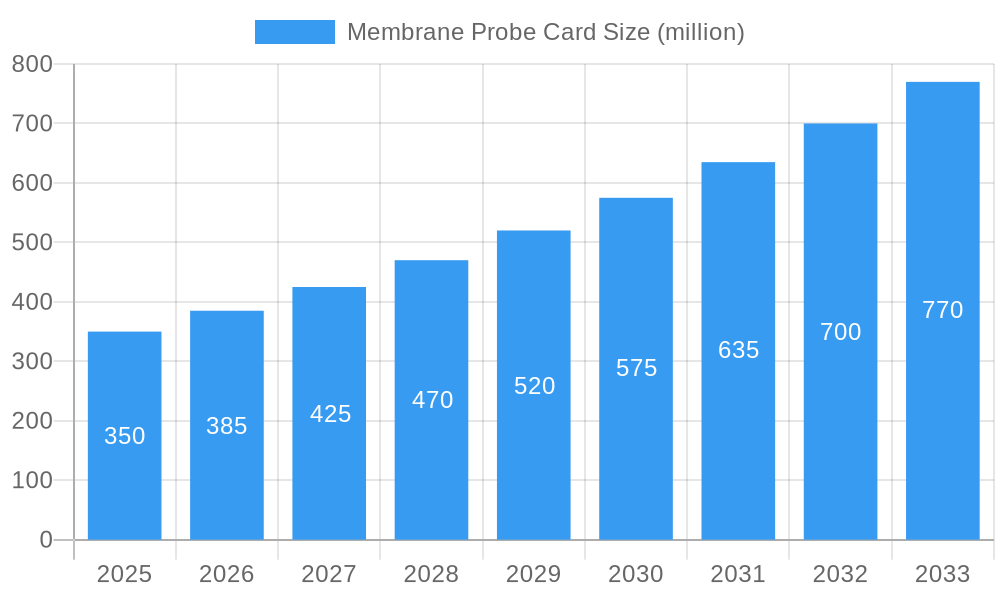
The global membrane probe card market is experiencing robust growth, driven by the increasing demand for advanced semiconductor testing solutions in the electronics industry. The market's expansion is fueled by several key factors, including the proliferation of miniaturized electronic devices, the rising adoption of high-frequency and high-bandwidth applications (like 5G and AI), and the increasing complexity of integrated circuits (ICs). These factors necessitate more sophisticated testing methodologies, with membrane probe cards offering superior performance compared to traditional probe cards in terms of signal integrity, throughput, and cost-effectiveness for testing advanced nodes. The market is segmented based on type (e.g., cantilever, vertical), application (e.g., memory, logic), and region. While precise market sizing requires specific data, a conservative estimate based on industry reports and the mentioned CAGR suggests a market value in the hundreds of millions of dollars in 2025, growing steadily over the forecast period (2025-2033). Competition is relatively fragmented, with key players like FormFactor, Tektronix, and Cascade Microtech leading the market through continuous innovation in probe card technology and addressing the growing demand for customized solutions.
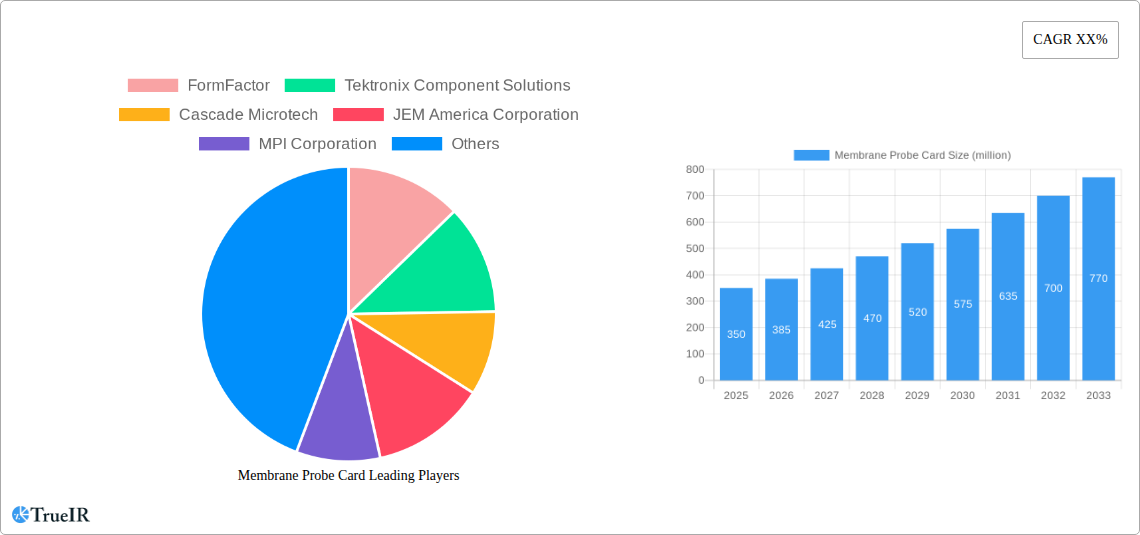
Membrane Probe Card Market Size (In Million)
The future trajectory of the membrane probe card market appears promising, particularly with ongoing advancements in materials science and manufacturing techniques leading to higher density, smaller form-factor probe cards. The integration of advanced features like embedded sensors and improved thermal management will further enhance the performance and reliability of these crucial testing components. However, challenges remain, including the high cost of development and manufacturing, the need for specialized expertise in handling and maintenance, and potential supply chain disruptions. Overcoming these obstacles and leveraging strategic partnerships will be critical for market participants seeking sustained growth. The expansion into emerging markets and technological innovations, such as advanced packaging technologies and the adoption of Artificial Intelligence in test processes, will offer significant opportunities for growth in the coming years.
Membrane Probe Card Company Market Share
Membrane Probe Card Market Report: A Comprehensive Analysis (2019-2033)
This dynamic report provides a comprehensive analysis of the global Membrane Probe Card market, projecting a multi-million-dollar valuation by 2033. The study covers the period 2019-2033, with 2025 serving as the base and estimated year. It delves into market structure, competitive dynamics, technological advancements, and future growth prospects, offering invaluable insights for industry stakeholders. This report utilizes data from a variety of sources to provide accurate and up-to-date information.
Membrane Probe Card Market Structure & Competitive Landscape
The global membrane probe card market is characterized by a moderately concentrated landscape, with a few major players commanding significant market share. The Herfindahl-Hirschman Index (HHI) for 2024 is estimated at xx, indicating a moderately consolidated market. Innovation is a key driver, with companies continually investing in R&D to improve performance, reduce costs, and expand applications. Regulatory changes related to material safety and environmental concerns also influence market dynamics. Product substitutes, such as alternative testing methods, pose a potential threat, though their market penetration remains relatively low at xx%. The end-user segmentation is primarily driven by the semiconductor industry, with significant contributions from other electronics sectors. M&A activity in the sector has been moderate in recent years, with approximately xx transactions recorded between 2019 and 2024, leading to some consolidation and shifts in market share.
- Market Concentration: HHI of xx in 2024.
- Innovation Drivers: Miniaturization, improved signal integrity, and material advancements.
- Regulatory Impacts: Compliance with RoHS and REACH directives.
- Product Substitutes: Alternative testing methods with xx% market penetration in 2024.
- End-User Segmentation: Dominated by the semiconductor industry, followed by other electronics sectors.
- M&A Trends: Approximately xx transactions between 2019 and 2024.
Membrane Probe Card Market Trends & Opportunities
The global membrane probe card market is poised for significant growth, with a projected CAGR of xx% during the forecast period (2025-2033). This growth is fueled by several factors, including the increasing demand for advanced semiconductor devices, the rising adoption of 5G and IoT technologies, and the continuous miniaturization of electronic components. Technological advancements, such as the development of high-frequency membrane probe cards and advanced materials, are further driving market expansion. Consumer preferences are shifting towards higher-performance and more energy-efficient devices, which in turn fuels the demand for advanced testing solutions. The competitive landscape is dynamic, with companies focusing on innovation, strategic partnerships, and market expansion to gain a competitive edge. Market penetration of membrane probe cards in various applications continues to grow, exceeding xx% in key segments by 2025.
Dominant Markets & Segments in Membrane Probe Card
The Asia-Pacific region, specifically countries like China, South Korea, and Taiwan, is the dominant market for membrane probe cards. This dominance stems from the high concentration of semiconductor manufacturing facilities and a robust electronics industry.
- Key Growth Drivers in Asia-Pacific:
- Rapid expansion of semiconductor manufacturing capacity.
- Government support for technological advancements and infrastructure development.
- Growing demand for consumer electronics and communication devices.
- Strong investments in R&D within the region.
The growth in the region is further underpinned by supportive government policies aimed at boosting technological innovation and infrastructure development. The strong presence of major semiconductor manufacturers and the booming consumer electronics market act as major growth catalysts in the Asia-Pacific region, making it the dominant market for membrane probe cards. This trend is expected to continue throughout the forecast period.
Membrane Probe Card Product Analysis
Membrane probe card technology is constantly evolving, with innovations focused on improving signal integrity, increasing bandwidth, and reducing overall size. Advanced materials and manufacturing processes are being adopted to create more reliable and durable cards, capable of handling the demands of high-speed testing. The key competitive advantages lie in superior signal fidelity, faster test times, reduced costs, and compatibility with diverse chip packages. These advancements are essential for supporting the development of next-generation microelectronics.
Key Drivers, Barriers & Challenges in Membrane Probe Card
Key Drivers: The primary drivers are the increasing demand for high-performance semiconductors, advancements in semiconductor technology (particularly in advanced packaging), and the growing adoption of 5G and IoT technologies. The expanding market for miniaturized electronics and the need for high-speed testing capabilities further accelerate demand.
Challenges: Key challenges include the high cost of developing and manufacturing advanced membrane probe cards, the need for specialized expertise, and potential supply chain disruptions. Strict quality control requirements, competition from alternative testing methods, and the need to adapt to evolving semiconductor packaging standards are also considerable obstacles. These factors, if not adequately addressed, can hinder market growth. Specifically, a xx% increase in raw material costs in 2024 impacted profitability margins.
Growth Drivers in the Membrane Probe Card Market
Technological advancements in semiconductor technology, particularly in advanced packaging, are a primary driver. The increasing demand for high-performance semiconductors, driven by the proliferation of 5G and IoT devices, also fuels market expansion. Government initiatives supporting technological innovation and infrastructure investments in key regions contribute significantly. The growing adoption of advanced testing techniques further enhances the demand.
Challenges Impacting Membrane Probe Card Growth
Supply chain disruptions, rising raw material costs, and competition from substitute technologies are significant challenges. Regulatory hurdles, particularly concerning environmental compliance and material safety, also impact growth. The need for specialized skills and expertise presents a barrier to entry for new players. These challenges require strategic planning and investment to mitigate their effects and ensure sustained growth.
Key Players Shaping the Membrane Probe Card Market
- FormFactor
- Tektronix Component Solutions
- Cascade Microtech
- JEM America Corporation
- MPI Corporation
- Micronics Japan Co.,Ltd
- Technoprobe SpA
- Japan Electronic Materials Corporation
- Microfriend
- Wuhan Memscard Electronic
- SMART CHAIN ENTERPRISE
- Suzhou Jieyu Sci-Tech
- MemsFlex
- Sentech
Significant Membrane Probe Card Industry Milestones
- 2020, Q3: FormFactor launches a new high-bandwidth membrane probe card.
- 2021, Q1: Cascade Microtech acquires a smaller competitor, expanding its market share.
- 2022, Q4: Significant investment in R&D by multiple companies leads to improvements in material science and manufacturing processes.
- 2023, Q2: New regulations concerning material safety are implemented, affecting manufacturing costs.
- 2024, Q1: A major technological breakthrough increases the signal integrity of membrane probe cards.
Future Outlook for Membrane Probe Card Market
The membrane probe card market is expected to maintain a strong growth trajectory over the forecast period, driven by the continued miniaturization of electronic components, the expansion of the semiconductor industry, and the increasing demand for high-speed testing capabilities. The development of new materials and manufacturing techniques, as well as strategic partnerships and acquisitions, will shape the competitive landscape. The market presents significant opportunities for companies with innovative products and effective strategies. The overall market potential is vast, and significant growth is expected, especially in regions with strong technological infrastructure.
Membrane Probe Card Segmentation
-
1. Application
- 1.1. IC Test
- 1.2. FPD Test
- 1.3. Micro LED Test
- 1.4. Other
-
2. Types
- 2.1. Thin-Film Probe Card For IC Testing
- 2.2. Thin-Film Probe Card For FPD Testing
- 2.3. Other
Membrane Probe Card Segmentation By Geography
-
1. North America
- 1.1. United States
- 1.2. Canada
- 1.3. Mexico
-
2. South America
- 2.1. Brazil
- 2.2. Argentina
- 2.3. Rest of South America
-
3. Europe
- 3.1. United Kingdom
- 3.2. Germany
- 3.3. France
- 3.4. Italy
- 3.5. Spain
- 3.6. Russia
- 3.7. Benelux
- 3.8. Nordics
- 3.9. Rest of Europe
-
4. Middle East & Africa
- 4.1. Turkey
- 4.2. Israel
- 4.3. GCC
- 4.4. North Africa
- 4.5. South Africa
- 4.6. Rest of Middle East & Africa
-
5. Asia Pacific
- 5.1. China
- 5.2. India
- 5.3. Japan
- 5.4. South Korea
- 5.5. ASEAN
- 5.6. Oceania
- 5.7. Rest of Asia Pacific
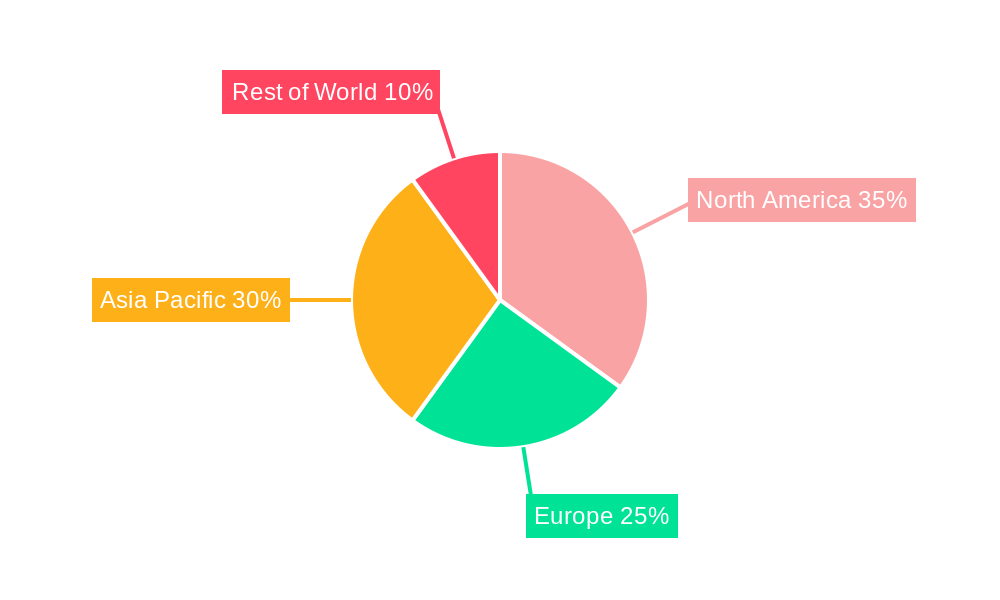
Membrane Probe Card Regional Market Share
Geographic Coverage of Membrane Probe Card
Membrane Probe Card REPORT HIGHLIGHTS
| Aspects | Details |
|---|---|
| Study Period | 2020-2034 |
| Base Year | 2025 |
| Estimated Year | 2026 |
| Forecast Period | 2026-2034 |
| Historical Period | 2020-2025 |
| Growth Rate | CAGR of 8.1% from 2020-2034 |
| Segmentation |
|
Table of Contents
- 1. Introduction
- 1.1. Research Scope
- 1.2. Market Segmentation
- 1.3. Research Objective
- 1.4. Definitions and Assumptions
- 2. Executive Summary
- 2.1. Market Snapshot
- 3. Market Dynamics
- 3.1. Market Drivers
- 3.2. Market Restrains
- 3.3. Market Trends
- 3.4. Market Opportunities
- 4. Market Factor Analysis
- 4.1. Porters Five Forces
- 4.1.1. Bargaining Power of Suppliers
- 4.1.2. Bargaining Power of Buyers
- 4.1.3. Threat of New Entrants
- 4.1.4. Threat of Substitutes
- 4.1.5. Competitive Rivalry
- 4.2. PESTEL analysis
- 4.3. BCG Analysis
- 4.3.1. Stars (High Growth, High Market Share)
- 4.3.2. Cash Cows (Low Growth, High Market Share)
- 4.3.3. Question Mark (High Growth, Low Market Share)
- 4.3.4. Dogs (Low Growth, Low Market Share)
- 4.4. Ansoff Matrix Analysis
- 4.5. Supply Chain Analysis
- 4.6. Regulatory Landscape
- 4.7. Current Market Potential and Opportunity Assessment (TAM–SAM–SOM Framework)
- 4.8. TIR Analyst Note
- 4.1. Porters Five Forces
- 5. Market Analysis, Insights and Forecast 2021-2033
- 5.1. Market Analysis, Insights and Forecast - by Application
- 5.1.1. IC Test
- 5.1.2. FPD Test
- 5.1.3. Micro LED Test
- 5.1.4. Other
- 5.2. Market Analysis, Insights and Forecast - by Types
- 5.2.1. Thin-Film Probe Card For IC Testing
- 5.2.2. Thin-Film Probe Card For FPD Testing
- 5.2.3. Other
- 5.3. Market Analysis, Insights and Forecast - by Region
- 5.3.1. North America
- 5.3.2. South America
- 5.3.3. Europe
- 5.3.4. Middle East & Africa
- 5.3.5. Asia Pacific
- 5.1. Market Analysis, Insights and Forecast - by Application
- 6. Global Membrane Probe Card Analysis, Insights and Forecast, 2021-2033
- 6.1. Market Analysis, Insights and Forecast - by Application
- 6.1.1. IC Test
- 6.1.2. FPD Test
- 6.1.3. Micro LED Test
- 6.1.4. Other
- 6.2. Market Analysis, Insights and Forecast - by Types
- 6.2.1. Thin-Film Probe Card For IC Testing
- 6.2.2. Thin-Film Probe Card For FPD Testing
- 6.2.3. Other
- 6.1. Market Analysis, Insights and Forecast - by Application
- 7. North America Membrane Probe Card Analysis, Insights and Forecast, 2020-2032
- 7.1. Market Analysis, Insights and Forecast - by Application
- 7.1.1. IC Test
- 7.1.2. FPD Test
- 7.1.3. Micro LED Test
- 7.1.4. Other
- 7.2. Market Analysis, Insights and Forecast - by Types
- 7.2.1. Thin-Film Probe Card For IC Testing
- 7.2.2. Thin-Film Probe Card For FPD Testing
- 7.2.3. Other
- 7.1. Market Analysis, Insights and Forecast - by Application
- 8. South America Membrane Probe Card Analysis, Insights and Forecast, 2020-2032
- 8.1. Market Analysis, Insights and Forecast - by Application
- 8.1.1. IC Test
- 8.1.2. FPD Test
- 8.1.3. Micro LED Test
- 8.1.4. Other
- 8.2. Market Analysis, Insights and Forecast - by Types
- 8.2.1. Thin-Film Probe Card For IC Testing
- 8.2.2. Thin-Film Probe Card For FPD Testing
- 8.2.3. Other
- 8.1. Market Analysis, Insights and Forecast - by Application
- 9. Europe Membrane Probe Card Analysis, Insights and Forecast, 2020-2032
- 9.1. Market Analysis, Insights and Forecast - by Application
- 9.1.1. IC Test
- 9.1.2. FPD Test
- 9.1.3. Micro LED Test
- 9.1.4. Other
- 9.2. Market Analysis, Insights and Forecast - by Types
- 9.2.1. Thin-Film Probe Card For IC Testing
- 9.2.2. Thin-Film Probe Card For FPD Testing
- 9.2.3. Other
- 9.1. Market Analysis, Insights and Forecast - by Application
- 10. Middle East & Africa Membrane Probe Card Analysis, Insights and Forecast, 2020-2032
- 10.1. Market Analysis, Insights and Forecast - by Application
- 10.1.1. IC Test
- 10.1.2. FPD Test
- 10.1.3. Micro LED Test
- 10.1.4. Other
- 10.2. Market Analysis, Insights and Forecast - by Types
- 10.2.1. Thin-Film Probe Card For IC Testing
- 10.2.2. Thin-Film Probe Card For FPD Testing
- 10.2.3. Other
- 10.1. Market Analysis, Insights and Forecast - by Application
- 11. Asia Pacific Membrane Probe Card Analysis, Insights and Forecast, 2020-2032
- 11.1. Market Analysis, Insights and Forecast - by Application
- 11.1.1. IC Test
- 11.1.2. FPD Test
- 11.1.3. Micro LED Test
- 11.1.4. Other
- 11.2. Market Analysis, Insights and Forecast - by Types
- 11.2.1. Thin-Film Probe Card For IC Testing
- 11.2.2. Thin-Film Probe Card For FPD Testing
- 11.2.3. Other
- 11.1. Market Analysis, Insights and Forecast - by Application
- 12. Competitive Analysis
- 12.1. Company Profiles
- 12.1.1 FormFactor
- 12.1.1.1. Company Overview
- 12.1.1.2. Products
- 12.1.1.3. Company Financials
- 12.1.1.4. SWOT Analysis
- 12.1.2 Tektronix Component Solutions
- 12.1.2.1. Company Overview
- 12.1.2.2. Products
- 12.1.2.3. Company Financials
- 12.1.2.4. SWOT Analysis
- 12.1.3 Cascade Microtech
- 12.1.3.1. Company Overview
- 12.1.3.2. Products
- 12.1.3.3. Company Financials
- 12.1.3.4. SWOT Analysis
- 12.1.4 JEM America Corporation
- 12.1.4.1. Company Overview
- 12.1.4.2. Products
- 12.1.4.3. Company Financials
- 12.1.4.4. SWOT Analysis
- 12.1.5 MPI Corporation
- 12.1.5.1. Company Overview
- 12.1.5.2. Products
- 12.1.5.3. Company Financials
- 12.1.5.4. SWOT Analysis
- 12.1.6 Micronics Japan Co.
- 12.1.6.1. Company Overview
- 12.1.6.2. Products
- 12.1.6.3. Company Financials
- 12.1.6.4. SWOT Analysis
- 12.1.7 Ltd
- 12.1.7.1. Company Overview
- 12.1.7.2. Products
- 12.1.7.3. Company Financials
- 12.1.7.4. SWOT Analysis
- 12.1.8 Technoprobe SpA
- 12.1.8.1. Company Overview
- 12.1.8.2. Products
- 12.1.8.3. Company Financials
- 12.1.8.4. SWOT Analysis
- 12.1.9 Japan Electronic Materials Corporation
- 12.1.9.1. Company Overview
- 12.1.9.2. Products
- 12.1.9.3. Company Financials
- 12.1.9.4. SWOT Analysis
- 12.1.10 Microfriend
- 12.1.10.1. Company Overview
- 12.1.10.2. Products
- 12.1.10.3. Company Financials
- 12.1.10.4. SWOT Analysis
- 12.1.11 Wuhan Memscard Electronic
- 12.1.11.1. Company Overview
- 12.1.11.2. Products
- 12.1.11.3. Company Financials
- 12.1.11.4. SWOT Analysis
- 12.1.12 SMART CHAIN ENTERPRISE
- 12.1.12.1. Company Overview
- 12.1.12.2. Products
- 12.1.12.3. Company Financials
- 12.1.12.4. SWOT Analysis
- 12.1.13 Suzhou Jieyu Sci-Tech
- 12.1.13.1. Company Overview
- 12.1.13.2. Products
- 12.1.13.3. Company Financials
- 12.1.13.4. SWOT Analysis
- 12.1.14 MemsFlex
- 12.1.14.1. Company Overview
- 12.1.14.2. Products
- 12.1.14.3. Company Financials
- 12.1.14.4. SWOT Analysis
- 12.1.15 Sentech
- 12.1.15.1. Company Overview
- 12.1.15.2. Products
- 12.1.15.3. Company Financials
- 12.1.15.4. SWOT Analysis
- 12.1.1 FormFactor
- 12.2. Market Entropy
- 12.2.1 Company's Key Areas Served
- 12.2.2 Recent Developments
- 12.3. Company Market Share Analysis 2025
- 12.3.1 Top 5 Companies Market Share Analysis
- 12.3.2 Top 3 Companies Market Share Analysis
- 12.4. List of Potential Customers
- 13. Research Methodology
List of Figures
- Figure 1: Global Membrane Probe Card Revenue Breakdown (undefined, %) by Region 2025 & 2033
- Figure 2: Global Membrane Probe Card Volume Breakdown (K, %) by Region 2025 & 2033
- Figure 3: North America Membrane Probe Card Revenue (undefined), by Application 2025 & 2033
- Figure 4: North America Membrane Probe Card Volume (K), by Application 2025 & 2033
- Figure 5: North America Membrane Probe Card Revenue Share (%), by Application 2025 & 2033
- Figure 6: North America Membrane Probe Card Volume Share (%), by Application 2025 & 2033
- Figure 7: North America Membrane Probe Card Revenue (undefined), by Types 2025 & 2033
- Figure 8: North America Membrane Probe Card Volume (K), by Types 2025 & 2033
- Figure 9: North America Membrane Probe Card Revenue Share (%), by Types 2025 & 2033
- Figure 10: North America Membrane Probe Card Volume Share (%), by Types 2025 & 2033
- Figure 11: North America Membrane Probe Card Revenue (undefined), by Country 2025 & 2033
- Figure 12: North America Membrane Probe Card Volume (K), by Country 2025 & 2033
- Figure 13: North America Membrane Probe Card Revenue Share (%), by Country 2025 & 2033
- Figure 14: North America Membrane Probe Card Volume Share (%), by Country 2025 & 2033
- Figure 15: South America Membrane Probe Card Revenue (undefined), by Application 2025 & 2033
- Figure 16: South America Membrane Probe Card Volume (K), by Application 2025 & 2033
- Figure 17: South America Membrane Probe Card Revenue Share (%), by Application 2025 & 2033
- Figure 18: South America Membrane Probe Card Volume Share (%), by Application 2025 & 2033
- Figure 19: South America Membrane Probe Card Revenue (undefined), by Types 2025 & 2033
- Figure 20: South America Membrane Probe Card Volume (K), by Types 2025 & 2033
- Figure 21: South America Membrane Probe Card Revenue Share (%), by Types 2025 & 2033
- Figure 22: South America Membrane Probe Card Volume Share (%), by Types 2025 & 2033
- Figure 23: South America Membrane Probe Card Revenue (undefined), by Country 2025 & 2033
- Figure 24: South America Membrane Probe Card Volume (K), by Country 2025 & 2033
- Figure 25: South America Membrane Probe Card Revenue Share (%), by Country 2025 & 2033
- Figure 26: South America Membrane Probe Card Volume Share (%), by Country 2025 & 2033
- Figure 27: Europe Membrane Probe Card Revenue (undefined), by Application 2025 & 2033
- Figure 28: Europe Membrane Probe Card Volume (K), by Application 2025 & 2033
- Figure 29: Europe Membrane Probe Card Revenue Share (%), by Application 2025 & 2033
- Figure 30: Europe Membrane Probe Card Volume Share (%), by Application 2025 & 2033
- Figure 31: Europe Membrane Probe Card Revenue (undefined), by Types 2025 & 2033
- Figure 32: Europe Membrane Probe Card Volume (K), by Types 2025 & 2033
- Figure 33: Europe Membrane Probe Card Revenue Share (%), by Types 2025 & 2033
- Figure 34: Europe Membrane Probe Card Volume Share (%), by Types 2025 & 2033
- Figure 35: Europe Membrane Probe Card Revenue (undefined), by Country 2025 & 2033
- Figure 36: Europe Membrane Probe Card Volume (K), by Country 2025 & 2033
- Figure 37: Europe Membrane Probe Card Revenue Share (%), by Country 2025 & 2033
- Figure 38: Europe Membrane Probe Card Volume Share (%), by Country 2025 & 2033
- Figure 39: Middle East & Africa Membrane Probe Card Revenue (undefined), by Application 2025 & 2033
- Figure 40: Middle East & Africa Membrane Probe Card Volume (K), by Application 2025 & 2033
- Figure 41: Middle East & Africa Membrane Probe Card Revenue Share (%), by Application 2025 & 2033
- Figure 42: Middle East & Africa Membrane Probe Card Volume Share (%), by Application 2025 & 2033
- Figure 43: Middle East & Africa Membrane Probe Card Revenue (undefined), by Types 2025 & 2033
- Figure 44: Middle East & Africa Membrane Probe Card Volume (K), by Types 2025 & 2033
- Figure 45: Middle East & Africa Membrane Probe Card Revenue Share (%), by Types 2025 & 2033
- Figure 46: Middle East & Africa Membrane Probe Card Volume Share (%), by Types 2025 & 2033
- Figure 47: Middle East & Africa Membrane Probe Card Revenue (undefined), by Country 2025 & 2033
- Figure 48: Middle East & Africa Membrane Probe Card Volume (K), by Country 2025 & 2033
- Figure 49: Middle East & Africa Membrane Probe Card Revenue Share (%), by Country 2025 & 2033
- Figure 50: Middle East & Africa Membrane Probe Card Volume Share (%), by Country 2025 & 2033
- Figure 51: Asia Pacific Membrane Probe Card Revenue (undefined), by Application 2025 & 2033
- Figure 52: Asia Pacific Membrane Probe Card Volume (K), by Application 2025 & 2033
- Figure 53: Asia Pacific Membrane Probe Card Revenue Share (%), by Application 2025 & 2033
- Figure 54: Asia Pacific Membrane Probe Card Volume Share (%), by Application 2025 & 2033
- Figure 55: Asia Pacific Membrane Probe Card Revenue (undefined), by Types 2025 & 2033
- Figure 56: Asia Pacific Membrane Probe Card Volume (K), by Types 2025 & 2033
- Figure 57: Asia Pacific Membrane Probe Card Revenue Share (%), by Types 2025 & 2033
- Figure 58: Asia Pacific Membrane Probe Card Volume Share (%), by Types 2025 & 2033
- Figure 59: Asia Pacific Membrane Probe Card Revenue (undefined), by Country 2025 & 2033
- Figure 60: Asia Pacific Membrane Probe Card Volume (K), by Country 2025 & 2033
- Figure 61: Asia Pacific Membrane Probe Card Revenue Share (%), by Country 2025 & 2033
- Figure 62: Asia Pacific Membrane Probe Card Volume Share (%), by Country 2025 & 2033
List of Tables
- Table 1: Global Membrane Probe Card Revenue undefined Forecast, by Application 2020 & 2033
- Table 2: Global Membrane Probe Card Volume K Forecast, by Application 2020 & 2033
- Table 3: Global Membrane Probe Card Revenue undefined Forecast, by Types 2020 & 2033
- Table 4: Global Membrane Probe Card Volume K Forecast, by Types 2020 & 2033
- Table 5: Global Membrane Probe Card Revenue undefined Forecast, by Region 2020 & 2033
- Table 6: Global Membrane Probe Card Volume K Forecast, by Region 2020 & 2033
- Table 7: Global Membrane Probe Card Revenue undefined Forecast, by Application 2020 & 2033
- Table 8: Global Membrane Probe Card Volume K Forecast, by Application 2020 & 2033
- Table 9: Global Membrane Probe Card Revenue undefined Forecast, by Types 2020 & 2033
- Table 10: Global Membrane Probe Card Volume K Forecast, by Types 2020 & 2033
- Table 11: Global Membrane Probe Card Revenue undefined Forecast, by Country 2020 & 2033
- Table 12: Global Membrane Probe Card Volume K Forecast, by Country 2020 & 2033
- Table 13: United States Membrane Probe Card Revenue (undefined) Forecast, by Application 2020 & 2033
- Table 14: United States Membrane Probe Card Volume (K) Forecast, by Application 2020 & 2033
- Table 15: Canada Membrane Probe Card Revenue (undefined) Forecast, by Application 2020 & 2033
- Table 16: Canada Membrane Probe Card Volume (K) Forecast, by Application 2020 & 2033
- Table 17: Mexico Membrane Probe Card Revenue (undefined) Forecast, by Application 2020 & 2033
- Table 18: Mexico Membrane Probe Card Volume (K) Forecast, by Application 2020 & 2033
- Table 19: Global Membrane Probe Card Revenue undefined Forecast, by Application 2020 & 2033
- Table 20: Global Membrane Probe Card Volume K Forecast, by Application 2020 & 2033
- Table 21: Global Membrane Probe Card Revenue undefined Forecast, by Types 2020 & 2033
- Table 22: Global Membrane Probe Card Volume K Forecast, by Types 2020 & 2033
- Table 23: Global Membrane Probe Card Revenue undefined Forecast, by Country 2020 & 2033
- Table 24: Global Membrane Probe Card Volume K Forecast, by Country 2020 & 2033
- Table 25: Brazil Membrane Probe Card Revenue (undefined) Forecast, by Application 2020 & 2033
- Table 26: Brazil Membrane Probe Card Volume (K) Forecast, by Application 2020 & 2033
- Table 27: Argentina Membrane Probe Card Revenue (undefined) Forecast, by Application 2020 & 2033
- Table 28: Argentina Membrane Probe Card Volume (K) Forecast, by Application 2020 & 2033
- Table 29: Rest of South America Membrane Probe Card Revenue (undefined) Forecast, by Application 2020 & 2033
- Table 30: Rest of South America Membrane Probe Card Volume (K) Forecast, by Application 2020 & 2033
- Table 31: Global Membrane Probe Card Revenue undefined Forecast, by Application 2020 & 2033
- Table 32: Global Membrane Probe Card Volume K Forecast, by Application 2020 & 2033
- Table 33: Global Membrane Probe Card Revenue undefined Forecast, by Types 2020 & 2033
- Table 34: Global Membrane Probe Card Volume K Forecast, by Types 2020 & 2033
- Table 35: Global Membrane Probe Card Revenue undefined Forecast, by Country 2020 & 2033
- Table 36: Global Membrane Probe Card Volume K Forecast, by Country 2020 & 2033
- Table 37: United Kingdom Membrane Probe Card Revenue (undefined) Forecast, by Application 2020 & 2033
- Table 38: United Kingdom Membrane Probe Card Volume (K) Forecast, by Application 2020 & 2033
- Table 39: Germany Membrane Probe Card Revenue (undefined) Forecast, by Application 2020 & 2033
- Table 40: Germany Membrane Probe Card Volume (K) Forecast, by Application 2020 & 2033
- Table 41: France Membrane Probe Card Revenue (undefined) Forecast, by Application 2020 & 2033
- Table 42: France Membrane Probe Card Volume (K) Forecast, by Application 2020 & 2033
- Table 43: Italy Membrane Probe Card Revenue (undefined) Forecast, by Application 2020 & 2033
- Table 44: Italy Membrane Probe Card Volume (K) Forecast, by Application 2020 & 2033
- Table 45: Spain Membrane Probe Card Revenue (undefined) Forecast, by Application 2020 & 2033
- Table 46: Spain Membrane Probe Card Volume (K) Forecast, by Application 2020 & 2033
- Table 47: Russia Membrane Probe Card Revenue (undefined) Forecast, by Application 2020 & 2033
- Table 48: Russia Membrane Probe Card Volume (K) Forecast, by Application 2020 & 2033
- Table 49: Benelux Membrane Probe Card Revenue (undefined) Forecast, by Application 2020 & 2033
- Table 50: Benelux Membrane Probe Card Volume (K) Forecast, by Application 2020 & 2033
- Table 51: Nordics Membrane Probe Card Revenue (undefined) Forecast, by Application 2020 & 2033
- Table 52: Nordics Membrane Probe Card Volume (K) Forecast, by Application 2020 & 2033
- Table 53: Rest of Europe Membrane Probe Card Revenue (undefined) Forecast, by Application 2020 & 2033
- Table 54: Rest of Europe Membrane Probe Card Volume (K) Forecast, by Application 2020 & 2033
- Table 55: Global Membrane Probe Card Revenue undefined Forecast, by Application 2020 & 2033
- Table 56: Global Membrane Probe Card Volume K Forecast, by Application 2020 & 2033
- Table 57: Global Membrane Probe Card Revenue undefined Forecast, by Types 2020 & 2033
- Table 58: Global Membrane Probe Card Volume K Forecast, by Types 2020 & 2033
- Table 59: Global Membrane Probe Card Revenue undefined Forecast, by Country 2020 & 2033
- Table 60: Global Membrane Probe Card Volume K Forecast, by Country 2020 & 2033
- Table 61: Turkey Membrane Probe Card Revenue (undefined) Forecast, by Application 2020 & 2033
- Table 62: Turkey Membrane Probe Card Volume (K) Forecast, by Application 2020 & 2033
- Table 63: Israel Membrane Probe Card Revenue (undefined) Forecast, by Application 2020 & 2033
- Table 64: Israel Membrane Probe Card Volume (K) Forecast, by Application 2020 & 2033
- Table 65: GCC Membrane Probe Card Revenue (undefined) Forecast, by Application 2020 & 2033
- Table 66: GCC Membrane Probe Card Volume (K) Forecast, by Application 2020 & 2033
- Table 67: North Africa Membrane Probe Card Revenue (undefined) Forecast, by Application 2020 & 2033
- Table 68: North Africa Membrane Probe Card Volume (K) Forecast, by Application 2020 & 2033
- Table 69: South Africa Membrane Probe Card Revenue (undefined) Forecast, by Application 2020 & 2033
- Table 70: South Africa Membrane Probe Card Volume (K) Forecast, by Application 2020 & 2033
- Table 71: Rest of Middle East & Africa Membrane Probe Card Revenue (undefined) Forecast, by Application 2020 & 2033
- Table 72: Rest of Middle East & Africa Membrane Probe Card Volume (K) Forecast, by Application 2020 & 2033
- Table 73: Global Membrane Probe Card Revenue undefined Forecast, by Application 2020 & 2033
- Table 74: Global Membrane Probe Card Volume K Forecast, by Application 2020 & 2033
- Table 75: Global Membrane Probe Card Revenue undefined Forecast, by Types 2020 & 2033
- Table 76: Global Membrane Probe Card Volume K Forecast, by Types 2020 & 2033
- Table 77: Global Membrane Probe Card Revenue undefined Forecast, by Country 2020 & 2033
- Table 78: Global Membrane Probe Card Volume K Forecast, by Country 2020 & 2033
- Table 79: China Membrane Probe Card Revenue (undefined) Forecast, by Application 2020 & 2033
- Table 80: China Membrane Probe Card Volume (K) Forecast, by Application 2020 & 2033
- Table 81: India Membrane Probe Card Revenue (undefined) Forecast, by Application 2020 & 2033
- Table 82: India Membrane Probe Card Volume (K) Forecast, by Application 2020 & 2033
- Table 83: Japan Membrane Probe Card Revenue (undefined) Forecast, by Application 2020 & 2033
- Table 84: Japan Membrane Probe Card Volume (K) Forecast, by Application 2020 & 2033
- Table 85: South Korea Membrane Probe Card Revenue (undefined) Forecast, by Application 2020 & 2033
- Table 86: South Korea Membrane Probe Card Volume (K) Forecast, by Application 2020 & 2033
- Table 87: ASEAN Membrane Probe Card Revenue (undefined) Forecast, by Application 2020 & 2033
- Table 88: ASEAN Membrane Probe Card Volume (K) Forecast, by Application 2020 & 2033
- Table 89: Oceania Membrane Probe Card Revenue (undefined) Forecast, by Application 2020 & 2033
- Table 90: Oceania Membrane Probe Card Volume (K) Forecast, by Application 2020 & 2033
- Table 91: Rest of Asia Pacific Membrane Probe Card Revenue (undefined) Forecast, by Application 2020 & 2033
- Table 92: Rest of Asia Pacific Membrane Probe Card Volume (K) Forecast, by Application 2020 & 2033
Frequently Asked Questions
1. What is the projected Compound Annual Growth Rate (CAGR) of the Membrane Probe Card?
The projected CAGR is approximately 8.1%.
2. Which companies are prominent players in the Membrane Probe Card?
Key companies in the market include FormFactor, Tektronix Component Solutions, Cascade Microtech, JEM America Corporation, MPI Corporation, Micronics Japan Co., Ltd, Technoprobe SpA, Japan Electronic Materials Corporation, Microfriend, Wuhan Memscard Electronic, SMART CHAIN ENTERPRISE, Suzhou Jieyu Sci-Tech, MemsFlex, Sentech.
3. What are the main segments of the Membrane Probe Card?
The market segments include Application, Types.
4. Can you provide details about the market size?
The market size is estimated to be USD XXX N/A as of 2022.
5. What are some drivers contributing to market growth?
N/A
6. What are the notable trends driving market growth?
N/A
7. Are there any restraints impacting market growth?
N/A
8. Can you provide examples of recent developments in the market?
N/A
9. What pricing options are available for accessing the report?
Pricing options include single-user, multi-user, and enterprise licenses priced at USD 3350.00, USD 5025.00, and USD 6700.00 respectively.
10. Is the market size provided in terms of value or volume?
The market size is provided in terms of value, measured in N/A and volume, measured in K.
11. Are there any specific market keywords associated with the report?
Yes, the market keyword associated with the report is "Membrane Probe Card," which aids in identifying and referencing the specific market segment covered.
12. How do I determine which pricing option suits my needs best?
The pricing options vary based on user requirements and access needs. Individual users may opt for single-user licenses, while businesses requiring broader access may choose multi-user or enterprise licenses for cost-effective access to the report.
13. Are there any additional resources or data provided in the Membrane Probe Card report?
While the report offers comprehensive insights, it's advisable to review the specific contents or supplementary materials provided to ascertain if additional resources or data are available.
14. How can I stay updated on further developments or reports in the Membrane Probe Card?
To stay informed about further developments, trends, and reports in the Membrane Probe Card, consider subscribing to industry newsletters, following relevant companies and organizations, or regularly checking reputable industry news sources and publications.
Methodology
Step 1 - Identification of Relevant Samples Size from Population Database


Step 2 - Approaches for Defining Global Market Size (Value, Volume* & Price*)

Note*: In applicable scenarios
Step 3 - Data Sources
Primary Research
- Web Analytics
- Survey Reports
- Research Institute
- Latest Research Reports
- Opinion Leaders
Secondary Research
- Annual Reports
- White Paper
- Latest Press Release
- Industry Association
- Paid Database
- Investor Presentations

Step 4 - Data Triangulation
Involves using different sources of information in order to increase the validity of a study
These sources are likely to be stakeholders in a program - participants, other researchers, program staff, other community members, and so on.
Then we put all data in single framework & apply various statistical tools to find out the dynamic on the market.
During the analysis stage, feedback from the stakeholder groups would be compared to determine areas of agreement as well as areas of divergence